Have you ever wondered where trading risks are actually rooted? What causes risk, and even more importantly, what is causing losses? Spend a few minutes learning more about where the main risks of Forex trading actually come from.

Error in analysis and prognosis. Any publication of statistical information, the publication of the results of the Fed meeting, and meetings of other central banks have their effects. What we’d better find out is whether the trader correctly assessed the importance of this or that news item. And the forecasts, made by the majority, were justified? Traders should consider these and other factors in the forecast. And there can often be mistakes. Traders often ignore or lose something important, which can result in an incorrect forecast.
Force majeure. It can come in many ways: human disaster, unexpected political decision, terrorist misfortune, the discovery of new mineral deposits, release to the market of a new product that has not been previously announced, sudden bankruptcy. Force majeure often has both long-term and immediate consequences. Examples of long-term force majeure include the collapse of “dotcom” and the mortgage crisis in the United States, which has become a global crisis. It should be noted that there are investors who managed to make a profit from the crisis. (I recommend watching the American film “The Big Short”, which describes this situation quite well).
Human factor. Incorrect interpretation of patterns, signs due to fatigue, lack of attention, stress, etc.
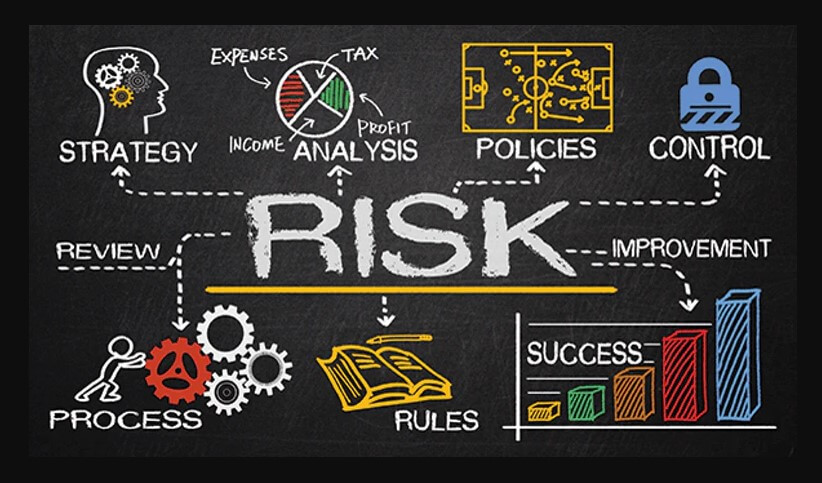
Another classification is the simplified division of the causes of trading risks into forecasting errors in technical, fundamental, and human analysis. I have already commented on the main reasons for the main risks in the section “Force Majeure”, and I will dwell on more details on the risks resulting from errors in technical analysis.
- High volatility at the time of opening the transaction. The greater the volatility, the greater the breadth of price changes and, therefore, the more and faster you can gain from it. It seems reasonable, but the risk lies in assessing this volatility because if the price going to your detriment, you can lose even more than you earn. The data of the indicators are relative, as well as the data of the volatility calculators.
TIP: Identify volatility visually. The price range is often identified as the distance between opposite fractal ends or candle accumulation. For starters, you can trade on the history. At first, it will be difficult for beginner traders (know from experience). Second tip: greater volatility, different from the daily average, is observed at the time of the appearance of fundamental factors. Just don’t open any transaction at this time.
- Level of trading. The trading strategy of trading by levels individually: someone opens positions expecting a level rebound, someone tries at breakup. For someone that’s a loss limiter. There is the so-called zone of turbulence around fractal levels in short-term time frames, where the price moves in different directions with a narrow amplitude. Predicting price movements in this area is inefficient.
TIP: Use the levels only as a guide. Open transactions out of levels and try to avoid staging at levels of resistance and stop support, as it can be used by large traders (market makers, which will be discussed below). If the transaction is already open in the direction of levels, then it is better to leave before reaching the level. Otherwise, there could be a rebound with the possible slip, which will worsen performance. Basically, the analysis is reduced to determine whether the break/rebound of a level is true (the trend) or false (the correction). Does it make any sense to risk it?
- Opening of transactions in overbought and oversold areas. This is the risk of opening a position at the end of a final trend. A classic mistake is trying to enter when the trend is already underway. At the peak of growth, large traders abandon trading, reaping some less intelligent traders.
It seems reasonable to employ RSI or stochastic, but they are not efficient at minimizing risks. They are often lagging behind, they invest in extreme price zones, and so on. So even if you use the indicators to determine the zones, you can still make a mistake.
TIP: You can identify signs of trend depletion as follows. The amplitudes in the three fractal sections are compared side by side in the time frame M1 (the exhaustion of the trend is clear there before). If the amplitude is shrinking (the amplitude of each subsequent fractal is shrinking), this suggests that the trend is exhausting.
And the wisest and simplest advice is to know how to get into an operation right at the beginning of the trend, not to imitate most. Be careful when interpreting the signals of the indicators, there are no perfect and impeccable indicators.
- Opening of transactions where there is no clear trend. There are situations where a trader makes a correction or a local price change for a new trend, which often occurs on the flat. It is difficult, especially when inexperienced to identify the flat end, as it often does not have a clear beginning or end.
TIP: I suggest again to use the comparison of price amplitude within the flat trend. If in the short term, there is a price movement whose amplitude deviates sharply from the average value, you should be alert. Do not enter an operation immediately, the first price change could be a correction. Analyze multiple time periods at a time: the signal period is М1-М5, confirming longer periods.
- Incorrect indicator parameters. This will result in an incorrect interpretation of the signals.
Council. Before starting to use an indicator with adjusted parameters in trading on a real account, try the system (tester МТ4, FxBlue). More detailed information about testing and optimization strategies in this summary.
- Application of pending orders. Outstanding orders are used in trading strategies based on the opening of transactions when the price exceeds the consolidation area. Orders are placed in opposite directions, betting that one of them will work. The risk arises from the fact that outstanding orders are set on the basis of intuition, rather than actual price movements. The distance is calculated, for example, in percentages of the average value of the price movement in the consolidation area. There is always the risk that the price will be positioned outside the area, order, and go in the opposite direction.
TIP: To reduce risk, avoid using pending orders.
- Abrupt reduction of contributions when a long position is opened. There are many examples of when the price fluctuated by 500-1000 points in just a few minutes. Of course, hardly anyone could react, make a decision, and make a compromise.
TIP: Always use stop loss.
- Market makers. A particular trader is just a token of a bigger game. Market makers are big players, and they can influence price through their huge capitals. They can create a necessary repository of information by manipulating media, forums, and other resources through forecasting, analysis, and information.
But this is not his only means. They could see levels where purchase and sale orders are concentrated, that is, stop losses and pending orders established in advance. As practice shows, most traders set stop loss in the area of the local ends, being tied to strong or rounded levels of support/resistance. Pending commands can be configured the same way. The market makers oppose the majority, bring the price to the levels at which orders accumulate, and therefore, even if we are forward-thinking, most traders are activated to stop.
For example. Market makers will always want to sell a currency at the best price. You see multiple stop loss higher than the current rates (green horizontal line at the bottom of the screen), which are basically the orders requested. On the other hand, market makers see many orders pending in the same price area, which does not allow the price to rise (volume equilibrium).
The price is pushed with small orders to the necessary level, after which it satisfies your sales volumes through purchase requests (stop loss). Given the number of short requests, it is unlikely that the price will go further.
TIP: There is no point in fighting with market makers. Therefore, you should learn to identify potential areas of command concentration and try to avoid them. It should also bear in mind that indicators cannot anticipate the possible actions of market makers. Therefore, it makes sense to rely less on indicators and pay more attention to levels, patterns, and exchange of information (trading volumes, order table). You can suggest any other risk of technical analysis, write in the comments. Let’s look for more ways to minimize and optimize trading risks together.
With regard to reducing the risks of erroneous forecasts based on fundamental analysis, there are few recommendations:
-Do not blindly trust everything that is reported in the media and be especially careful with “expert” forecasts. Check the official data reported by news agencies and official resources.
-Use complementary analytical tools: economic calendar, action analyzers.
-Evaluate dynamics statistics, comparing them with analysts’ expectations and previous reports.
-And lastly, prepare to react instantly to a force majeure.