The U.S. stock index Russell 2,000 and the S&P 500 shows a divergence in its long-term trend. While the S&P 500 reaches fresh highs recovering from its 2020’s losses, the Russell 2000 index remains negative.
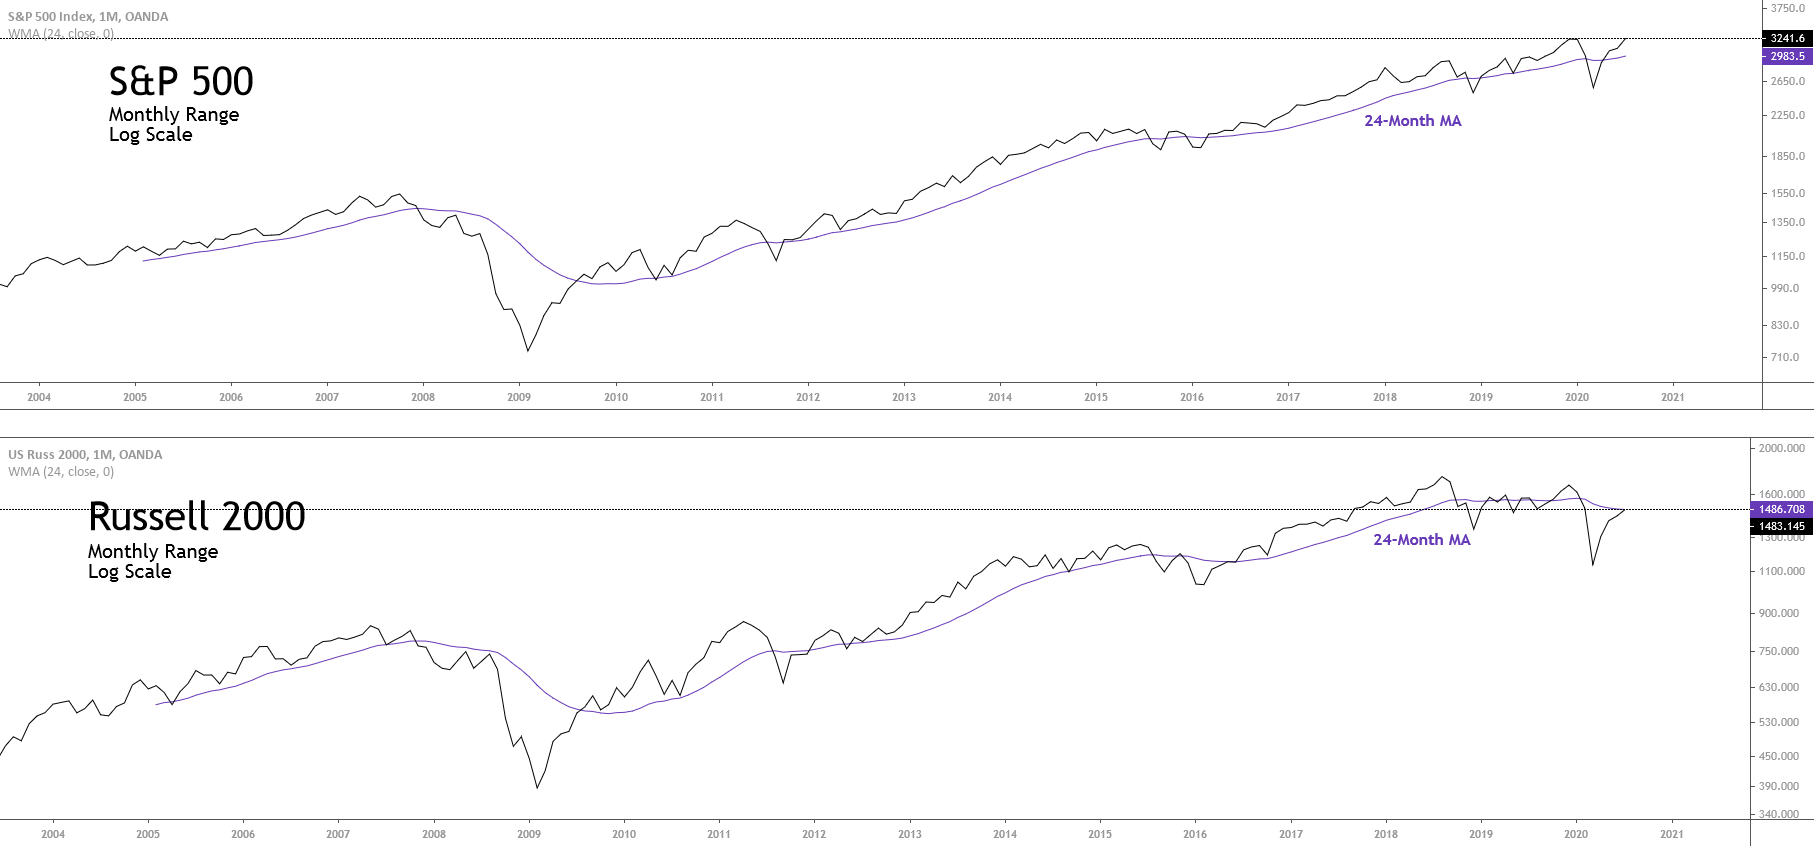
As the previous chart illustrates, Russell 2000 continues moving below its 24-month moving average while the S&P 500 already moves on the bullish side. This market context could lead Russell 2000 to see more declines in the coming weeks, although, currently the short-term bias is still hinting to further advances.
Market Sentiment Overview
This year, the index that groups the 2,000 most prominent small-cap U.S. companies sheds near 11.5% (YTD), dragged by the pandemic lockdown.
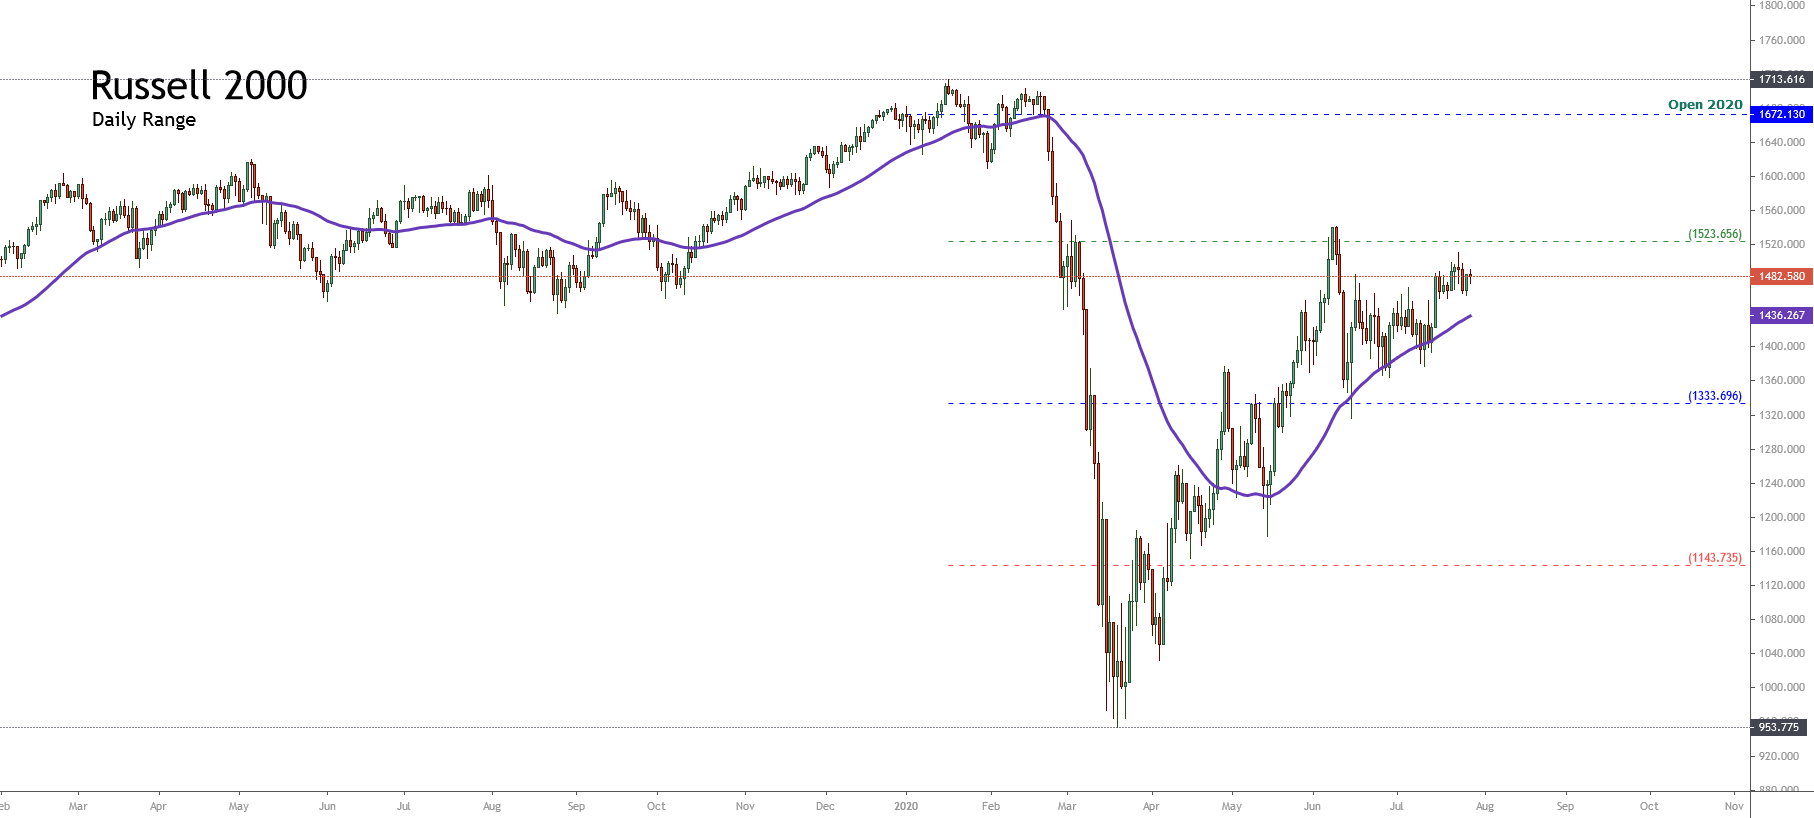
The following chart exposes to Russell 2000 in its daily timeframe. On the figure, we distinguish the price moving above the 60-day moving average, which leads us to conclude that the short-term bias still remains on the bullish side.
At the same time, from the 52-week high and low range, we note the price action continues moving bellow the 1,523.65 pts, which makes us hold our bullish bias. In this context, the possibility of a strike over the 1,523.65 pts could reveal an extreme bullish sentiment on the Russell 2000 index.
On the other hand, the absence of a bearish reversal pattern discards, for now, the probability of a plummet in the U.S. stock market.
Elliott Wave Outlook
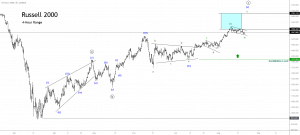
The short-term Elliott wave perspective of the Russell 2000 index exposed in its 4-hour chart reveals the recovery experienced by the U.S. stock market from last March 23rd when the price found fresh buyers at 963.62 pts.
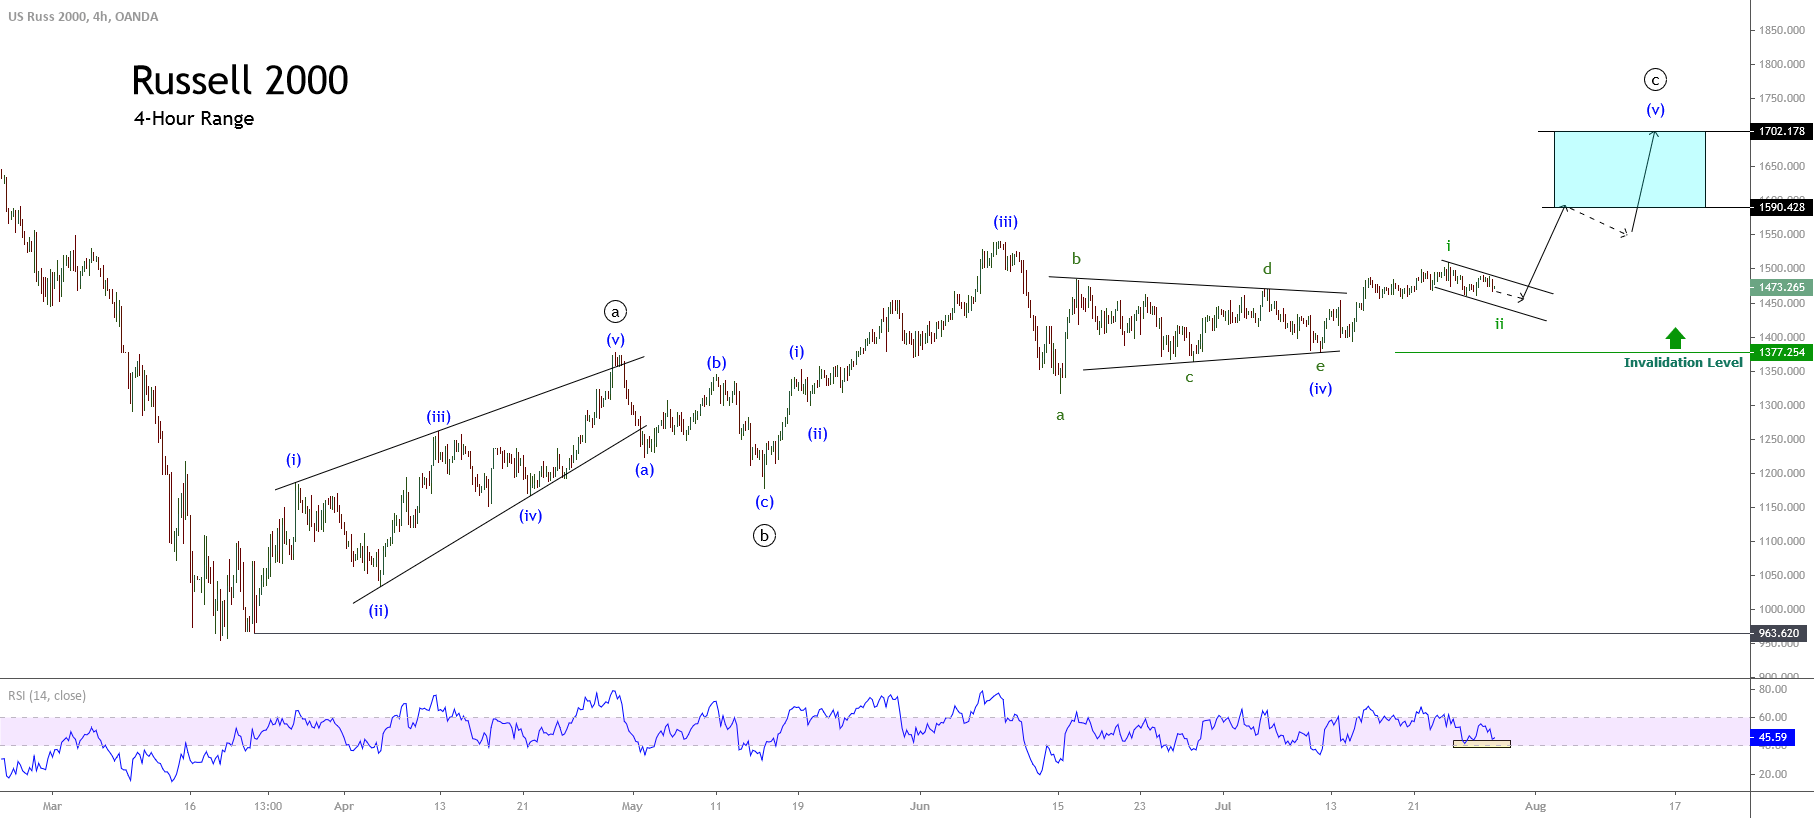
In the previous chart, we observe a first five-wave structural sequence corresponding to a leading diagonal pattern identified as wave ((a)) of Minute degree labeled in black. The first five-wave sequence topped at 1,376.52 pts where the price started to develop a corrective move in three waves corresponding to wave ((b)) in black, which found support at 1,177.26 pts on May 14th.
Once the second wave ended, the price began a new rally, which remains in progress. After the third wave of Minuette degree labeled in blue, Russell 2000 developed a correction identified as a triangle pattern. After the breakout of the upper guideline b-d, the U.S. index resumed its short-term upward trend.
Currently, the price action remains consolidating in a wave ii of Subminuette degree identified in green. In this context, the RSI oscillator continues moving above the 40-level, which leads us to confirm the retracement and the bullish bias of Russell 2000.
Finally, the upward continuation could drive to Russell 2000 toward 1,590.42 and even extend its gains until 1,702.17 pts. On the other hand, the bullish scenario will remain valid while the price continues above 1,377.25 pts.