Overview
The Indian benchmark NIFTY50 index that groups the 50 largest capitalized companies of the Indian stock market loses over 6.6% during 2020. However, since March’s low at 7,511.10 pts, NIFTY 50 recovers over 51% and could visit the 12,000 pts in the following trading sessions.

Market Sentiment Overview
The Indian stock market led by the NIFTY 50 index underperforms 6.69% (YTD), recovering its losses from the massive sell-off starting last February, which dragged it to lose over 38% mid-March when the price found support at 7,511.10 pts. Once the Indian index found support, the price began to recover from its declines advancing over 51% to date.
The following chart exposes to NIFTY 50 in its daily timeframe moving above the 11,200.65 pts corresponding to the zone of extreme bullish sentiment. At the same time, from the figure, we distinguish the Indian benchmark moving above the 200-day and 60-day moving average, confirming us the bullish bias of NIFTY 50.

Considering that the extreme bullish sentiment prevails in the NIFTY 50 index, the price could advance toward the 12,000 pts as a psychological barrier, which coincides with a previous consolidation zone.
Elliott Wave Outlook
The big picture of NIFTY 50 under the Elliott wave perspective unveiled in the 2-week chart and log scale, exposes the advance of the Indian stock market in the fourth wave of Primary degree labeled in black. Once the price reached its all-time high at 12,430.50 pts in January 2020, completing its wave ((3)) of Primary degree began.
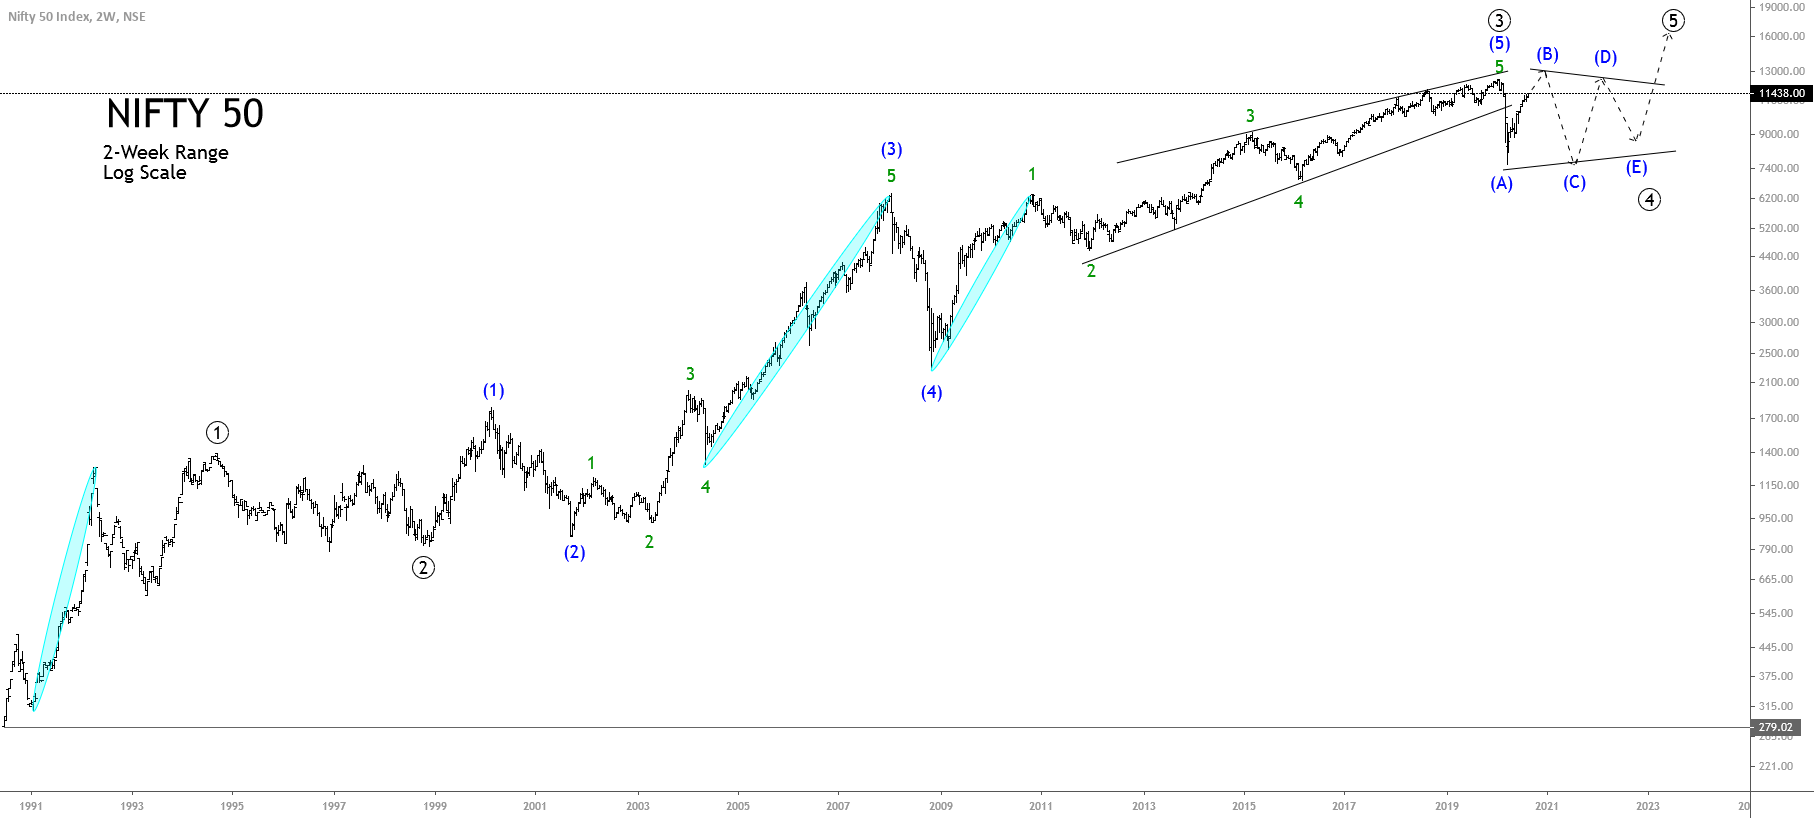
From the chart, we observe some extended waves developed by NIFTY 50 in each impulsive movement identified with ellipses. In the first wave of Primary degree, in its internal structure, the third wave corresponds to the extended wave. While in the third wave of Primary degree, watching inside of the fifth wave of Minor degree labeled in green, which belongs to the third wave of Intermediate degree in blue, corresponds to the extended wave.
Finally, in the fifth wave of Intermediate degree, we recognize the first wave of Minor degree as the extended wave. In this context, the fifth wave of Intermediate degree could be confused with an ending diagonal pattern. Although the ending diagonal pattern tends to appear in a fifth wave or wave c, this case does not correspond to an ending diagonal pattern.
On the other hand, considering the previous corrective formations that look like a three-wave structural sequence, the current fourth wave of Primary degree could be a complex formation as a triangle pattern, which holds a 3-3-3-3-3 series. Under this scenario, our short-term outlook for the Indian benchmark foresees the bullish continuation, which could surpass the last all-time high at 12,430.50 pts.
Once the price completes its wave (B) of Intermediate degree in blue, the Indian stock market could develop a sideways movement forming a potential triangle pattern. Once the corrective formation in progress ended, NIFTY 50 could resume its advances developing a wave ((5)) in black, which could see fresh all-time highs.