
Almost every single cryptocurrency in the top100 was in the red today after Bitcoin broke $12,000 to the downside. Bitcoin is currently trading for $11,685, which represents a decrease of 4.7% on the day. Meanwhile, Ethereum lost 5.56% on the day, while XRP lost 9.4%.
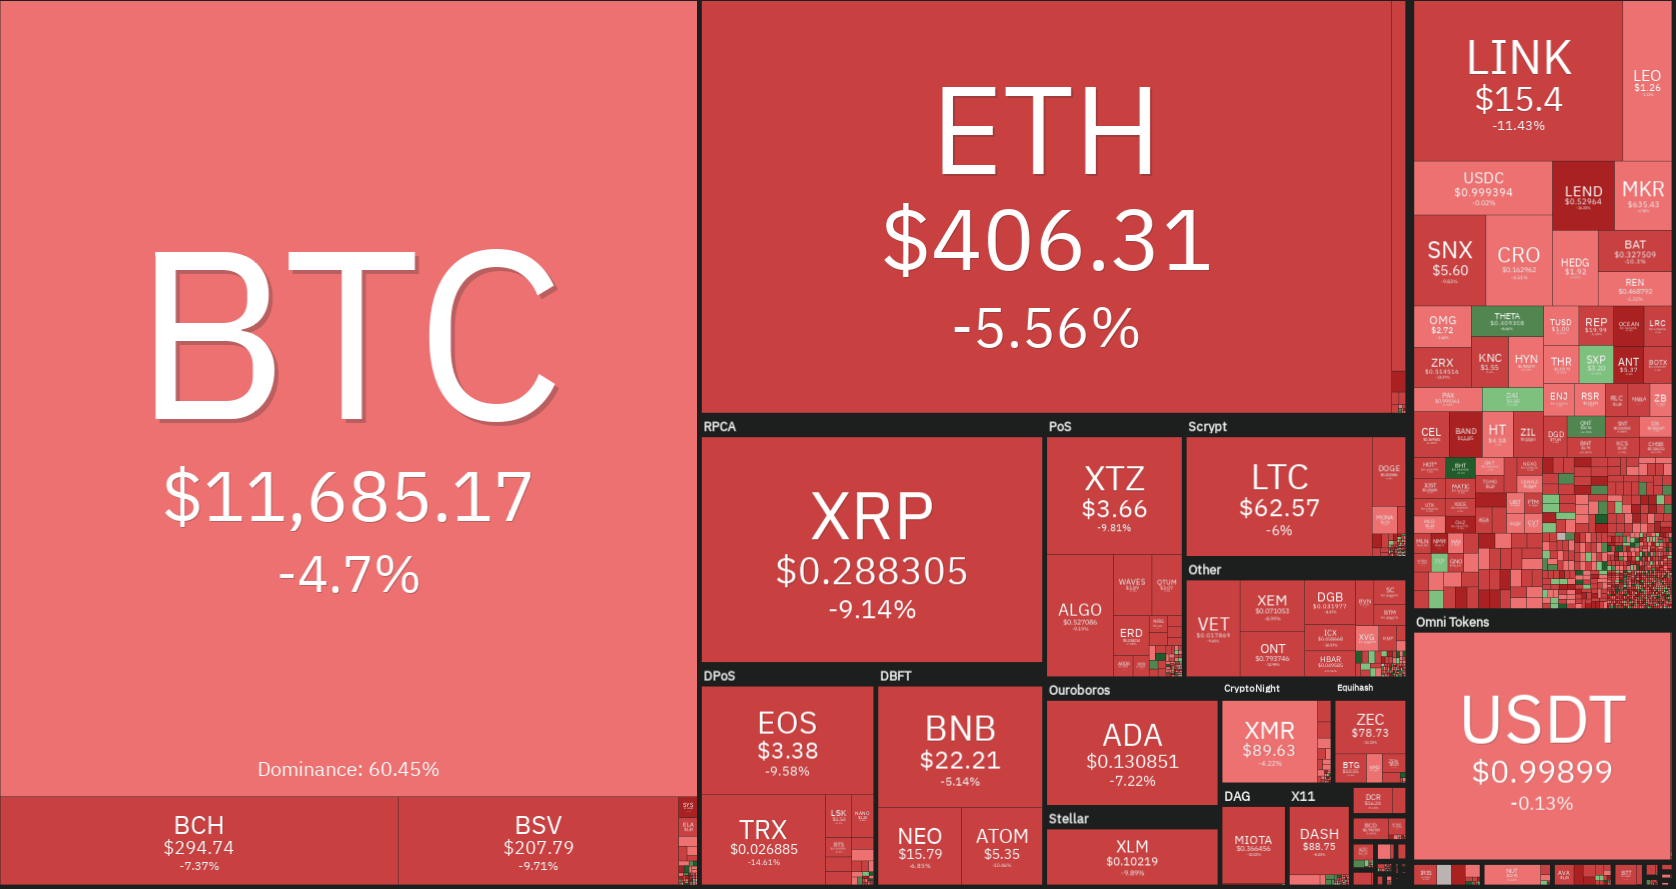
Daily Crypto Sector Heat Map
When talking about top100 cryptocurrencies, yearn.finance gained 19.51% on the day, making it the most prominent daily gainer. THETA (17.62%) and Swipe (17.28%) also did great. On the other hand, Numeraire lost 10.95%, making it the most prominent daily loser. It is followed by BitTorrent’s loss of 10.14% and Fetch.ai’s drop of 9.94%.
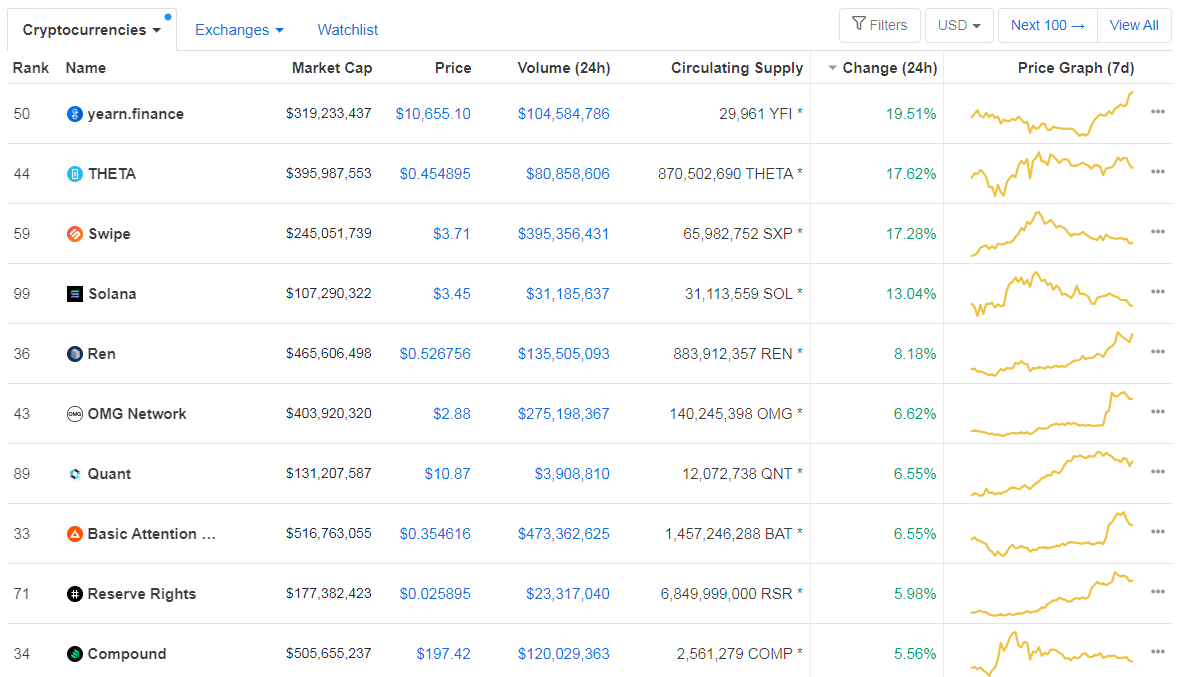
Top 10 24-hour Performers (Click to enlarge)
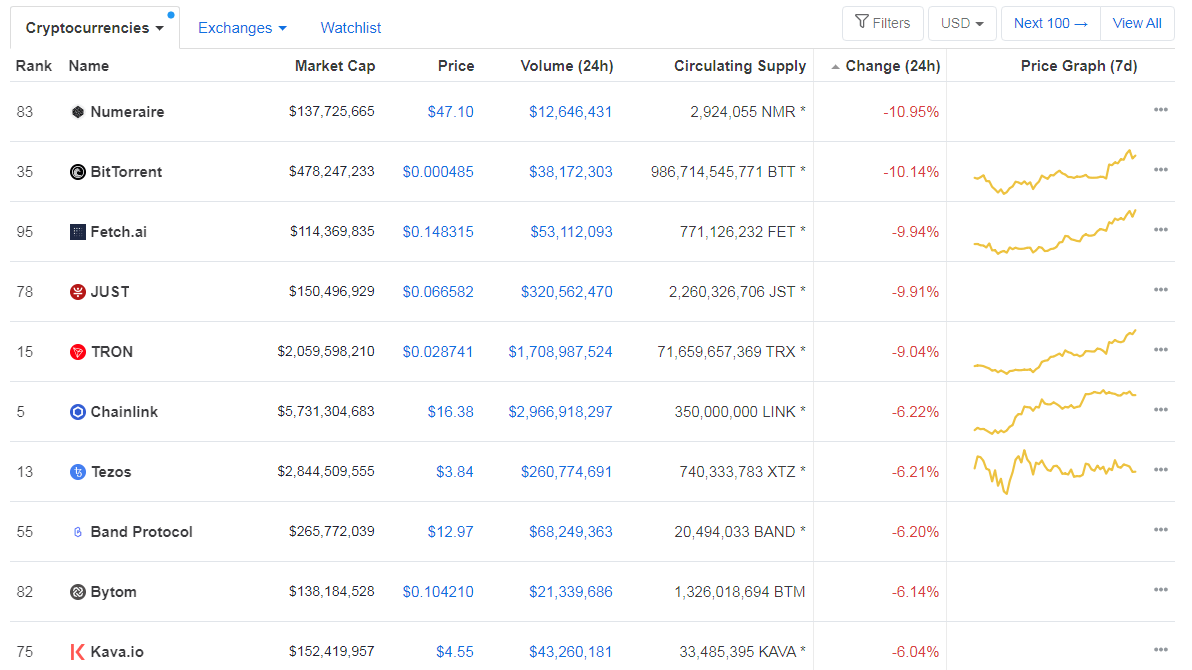
Bottom 10 24-hour Performers (Click to enlarge)
Bitcoin’s dominance level has increased slightly (even though it is still under the 60% mark), with its value currently at 59.77%. This value represents a 0.13% difference to the upside when compared to our last report.
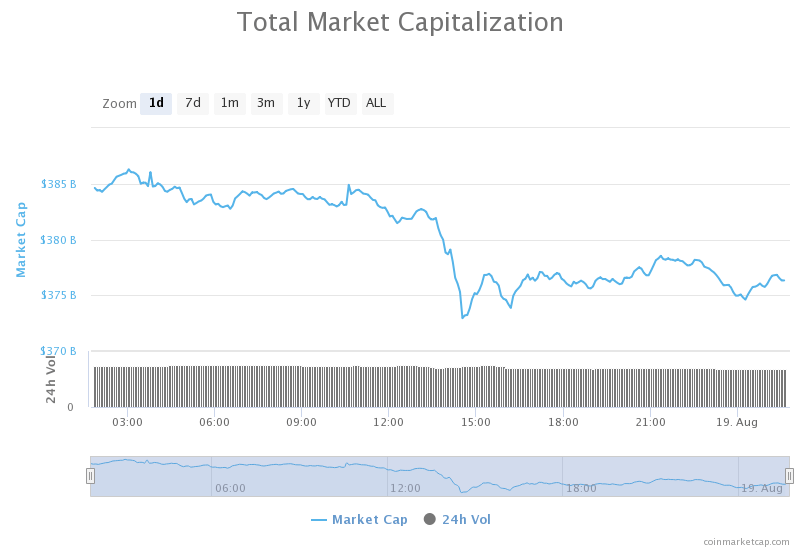
Daily Crypto Market Cap Chart
The cryptocurrency market cap experienced a decrease in value over the course of the day. Its current value is $364.20 billion, which represents a decrease of $20 billion when compared to our previous report.
_______________________________________________________________________
What happened in the past 24 hours?
_______________________________________________________________________
- Bitmain still has ‘slight edge’ over rival MicroBT, says BitMEX (The Block)
- Gemini now offers cryptocurrency trading and storing services to registered investment advisors (The Block)
- A juicy trade is helping push CME’s bitcoin futures to new records, traders say (The Block)
- Transfers of Polkadot’s DOT tokens are now live (The Block)
- U.S. dollar trading at its worst level in more than two years (The Block)
- Blockchain.com to Offer 12% Interest on Crypto Deposits, Outpacing BlockFi (Cryptobriefing)
- YFI Worth More Than Bitcoin? Prices Pass $11k Following Insurance Product Launch (Cryptobriefing)
- Singapore bank says Bitcoin, crypto is “no more” the wild west (Cryptoslate)
- Bitcoin Holding Sentiment Now Strongest in Nearly Two Years (Coindesk)
- Bitcoin Price Prepares for $12,900 After Key Support Level Is Retested (Cointelegraph)
_______________________________________________________________________
Technical analysis
_______________________________________________________________________
Bitcoin
After finally breaking $12,000 with confidence, Bitcoin is now falling hard below it (click on the arrow of the image). The largest cryptocurrency by market cap is dropping below $11,700 at the moment on bearish momentum. If the cryptocurrency manages to break below the 11,600 level, the next target will be 11,087. Right now, it is heavily oversold, so we can also expect a bounce back to near $12,000.
BTC traders should look for a trade after the cryptocurrency decides on whether it will end up above or below $11,600, as this is a strong support level.
BTC/USD 4-hour Chart
Technical factors:
- Price is below its 50-period EMA and below its 21-period EMA
- Price is below its lower band.
- RSI is dropping (34) and approaching the oversold area
- Volume is above average
Key levels to the upside Key levels to the downside
1: $12,015 1: $11,630
2: $12,300 2: $11,460
3: $12,900 3: $11,090
Ethereum
Ethereum’s social sentiment is still on the rise with the increased interest in DeFi. Even though the second-largest cryptocurrency by market cap is losing heavily in the past 24 hours, the $400 support level should hold, and ETH is (for the time being) safe above it. The next move Ethereum makes will most likely be caused by Bitcoin’s move, as the largest cryptocurrency by market cap is preparing an explosive move towards (most likely) the upside. That, though, should wait a bit, since cryptos are still under selling pressure.
Traders should look for a trade when ETH regains a higher and steady volume.
ETH/USD 4-hour Chart
Technical Factors:
- Price is currently below its 21-period and its 50-period EMA
- Price is below its lower B.B.
- RSI is descending (36) approaching oversold levels
- Volume is average
Key levels to the upside Key levels to the downside
1: $445 1: $415
2: $496 2: $400
3: $361
Ripple
XRP’s bold move towards the upside, which came after announcing that its company (Ripple) will focus its business model on the XRP token rather than using it as a side solution, got nullified. The third-largest cryptocurrency by market cap dropped below the $0.31 level and as low as $0.29 (which is where it is at now).
Traders can look for a trade after XRP moves above or below its immediate support/resistance levels, or within the current trading level.
XRP/USD 4-hour Chart
Technical factors:
- Price is currently below the 21-period and 50-period EMA
- Price is below the lower B.B.
- RSI is dropping (38.6)
- Volume increased in the last hours
Key levels to the upside Key levels to the downside
1: $0.32 1: $0.31
2: $0.332 2: $0.285
3:$0.266
Related posts
 Daily Crypto Review, May 15 – Bitcoin Rejected from $10,000 – What’s Next?
 Daily Crypto Review, Jun 03 – Large BTC Miner Capitulation Causing The Price Drop? BTC Under $10,000 Again
 Daily Crypto Review, Sept 15 – BTC Heading Towards $11,000; ETH Facing a 35% Drop?
 Daily Crypto Review, Oct 2 – Trump Tests Positive for COVID-19; Crypto and Stocks Negatively Affected
One reply on “Daily Crypto Review, August 19 – Cryptos Heavily in the Red, YFI Token Breaks $11,000 and Approaches BTC’s Price Level”
Breaking 11k is so such a big move!