
The cryptocurrency sector has failed to confidently push towards new highs, which triggered a pullback. On top of that, the current macroeconomic situation has pushed both cryptocurrencies and stocks towards the downside. Bitcoin is currently trading for $10,476, representing a decrease of 2.82% on the day. Meanwhile, Ethereum lost 5.09% on the day, while XRP lost 3.7%.
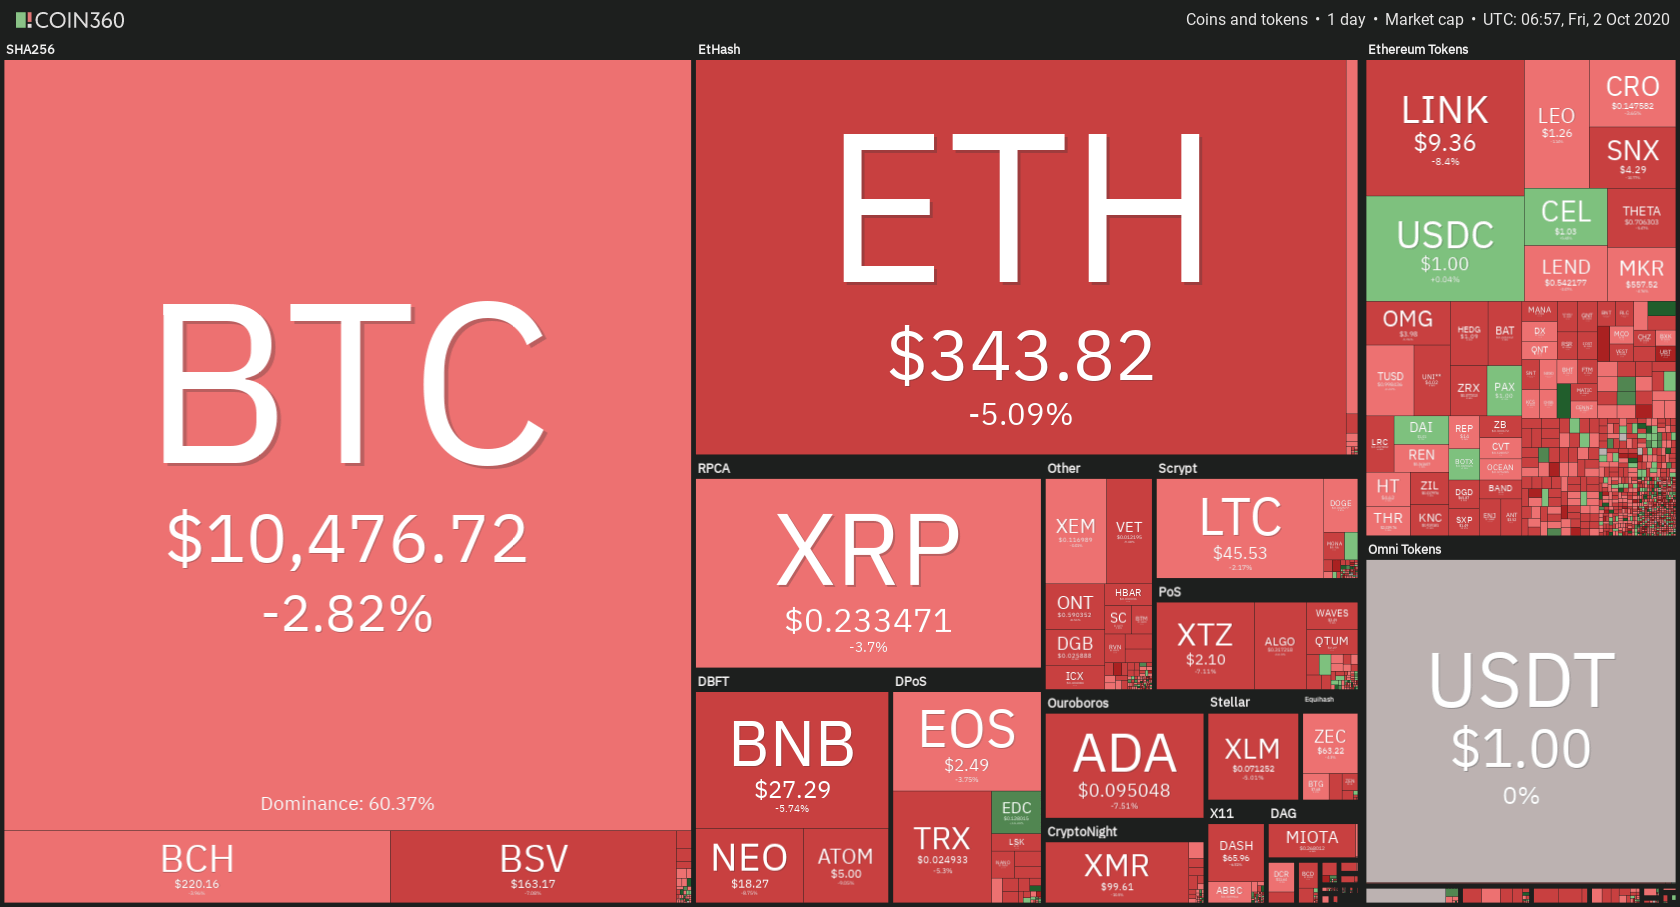
Daily Crypto Sector Heat Map
If we look at the top100 cryptocurrencies as well as their gains and losses, Bitcoin Gold gained 4.88% on the day, making it the most prominent daily gainer. Balancer (3.92%) and Celsius (3.43%) also did great. On the other hand, Energy Web Token lost 16.88%, making it the most prominent daily loser. It is followed by Arweave’s loss of 16.61% and yearn. finance’s loss of 14.45%.
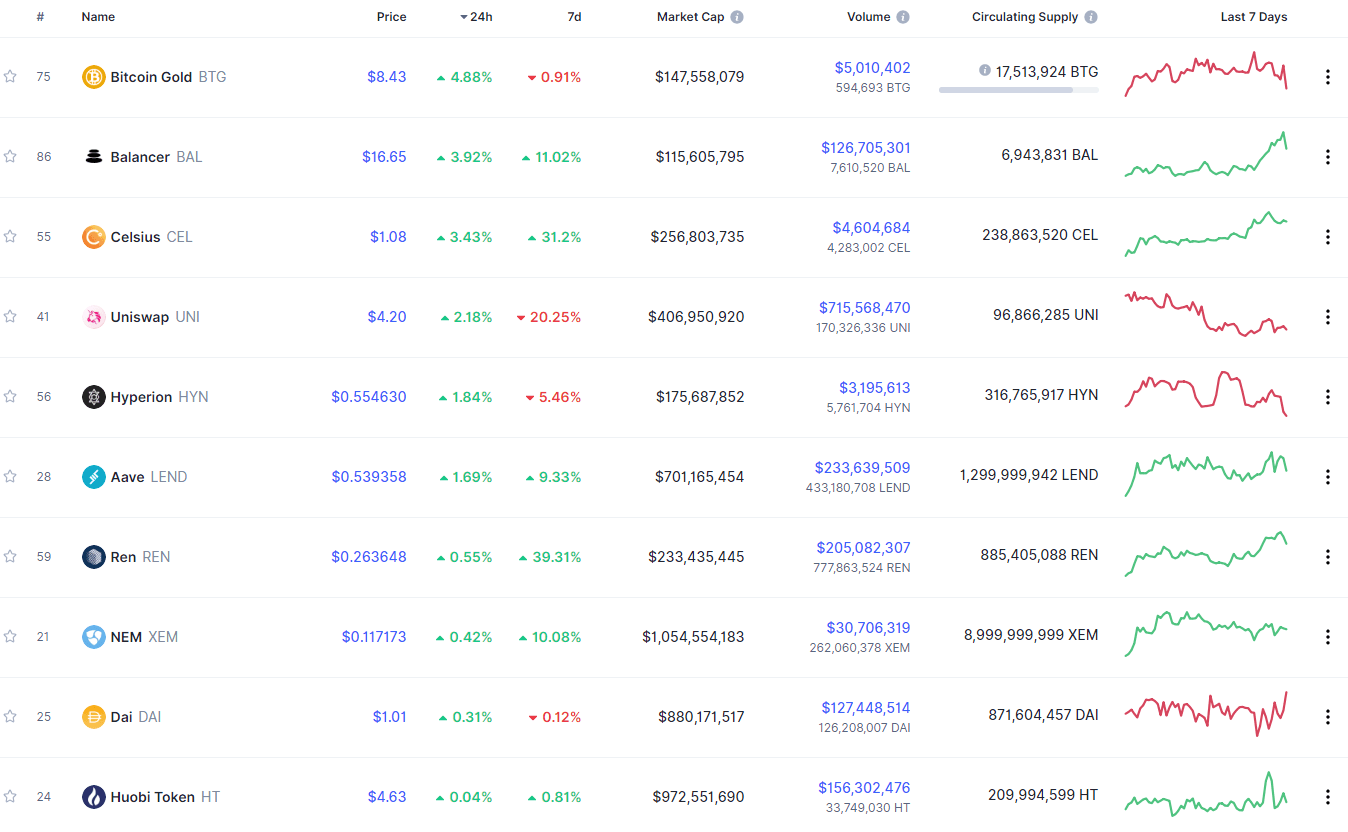
Top 10 24-hour Performers (Click to enlarge)
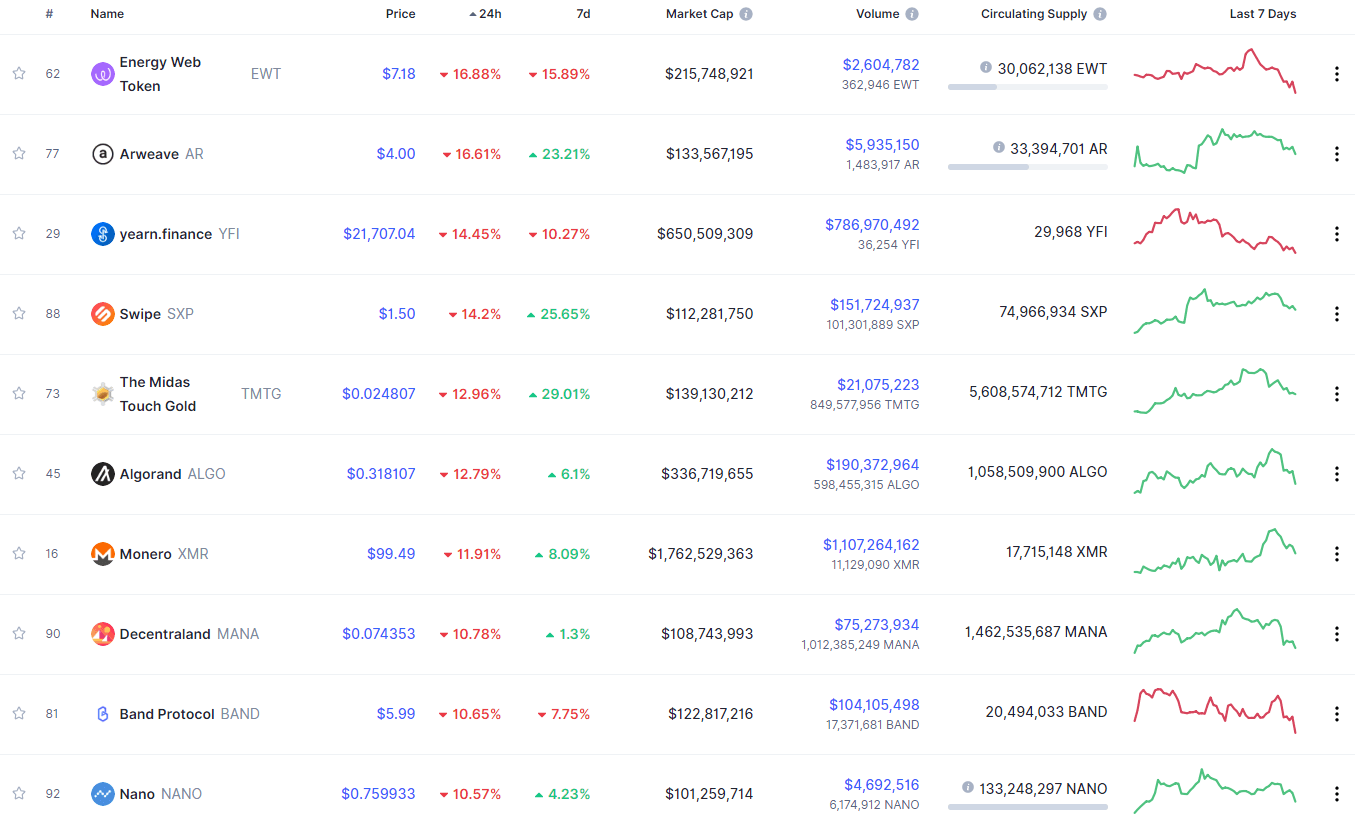
Bottom 10 24-hour Performers (Click to enlarge)
Bitcoin’s level of market dominance stayed at the same spot since our last report, with its value currently being at 60.37%. This value represents a 0.11% difference to the downside when compared to when we last reported.
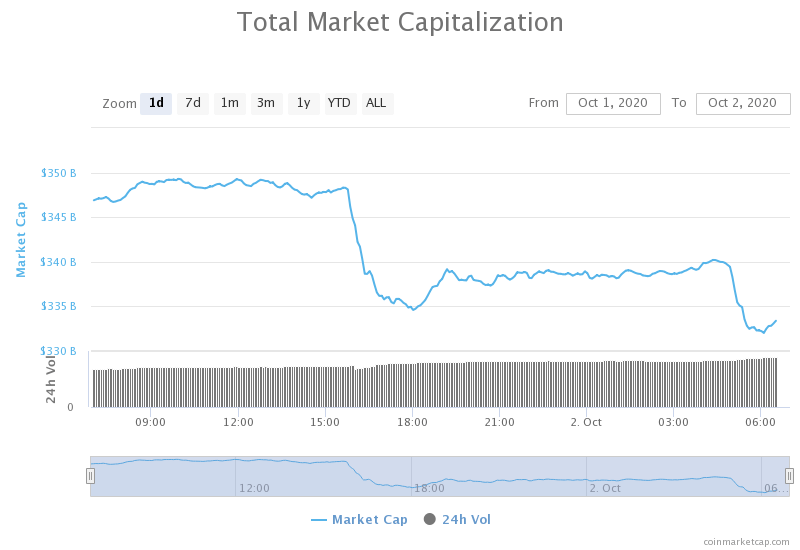
Daily Crypto Market Cap Chart
The crypto sector capitalization has lost value over the course of the past 24 hours. Its current value is $336.45 billion, which represents a decrease of $7.99billion when compared to our previous report.
_______________________________________________________________________
What happened in the past 24 hours?
_______________________________________________________________________
- Bitcoin plunges below $10,500 as the US government peruses BitMEX owners (Cryptoslate)
- Why are many people in Eastern Europe using crypto? (Cryptoslate)
- How CoinGecko went from CoinMarketCap challenger to DeFi investor (The Block)
- A Goldman Sachs partner will join Galaxy Digital to help bridge the gap between Wall Street and crypto (The Block)
- Litecoin Privacy Upgrade Launches Testnet, Mainnet Slated for 2021 (Cryptobriefing)
- Bitcoin and Stocks Fall as Trump Tests Positive for COVID-19 (Coindesk)
- More than 50% of all crypto exchanges have weak or even no ID verification (Cointelegraph)
- Yield farming platform APY Finance locks $67 million in first hour (Cointelegraph)
- $1B in Wrapped Bitcoin is now being audited using Chainlink’s ‘Proof of Reserve’ (Cointelegraph)
- Fiat inflation has cost Bitcoin hodlers 20% over the past decade (Cointelegraph)
_______________________________________________________________________
Technical analysis
_______________________________________________________________________
Bitcoin
The largest cryptocurrency by market cap failed to break the 38.2% Fib retracement level, causing a pullback, which (as we mentioned in our previous article) brought its price to the $10,360 range. The pullback happened over the course of a few hours, and first tested the ascending (pink) resistance level, which got confirmed, triggering another push towards the downside.
Even though Bitcoin’s price went down slightly, the good news is that the $10,360 range has not been breached. If Bitcoin, on the other hand, breaks this level to the downside, we may expect a strong push towards the downside.
BTC/USD 4-hour Chart
Bitcoin’s short-term technicals remained tilted towards the sell-side ever since Bitcoin confirmed its position below the 38.2% Fib retracement. Its daily overview has become a bit more bearish as well, while its weekly and monthly overviews are extremely bullish.
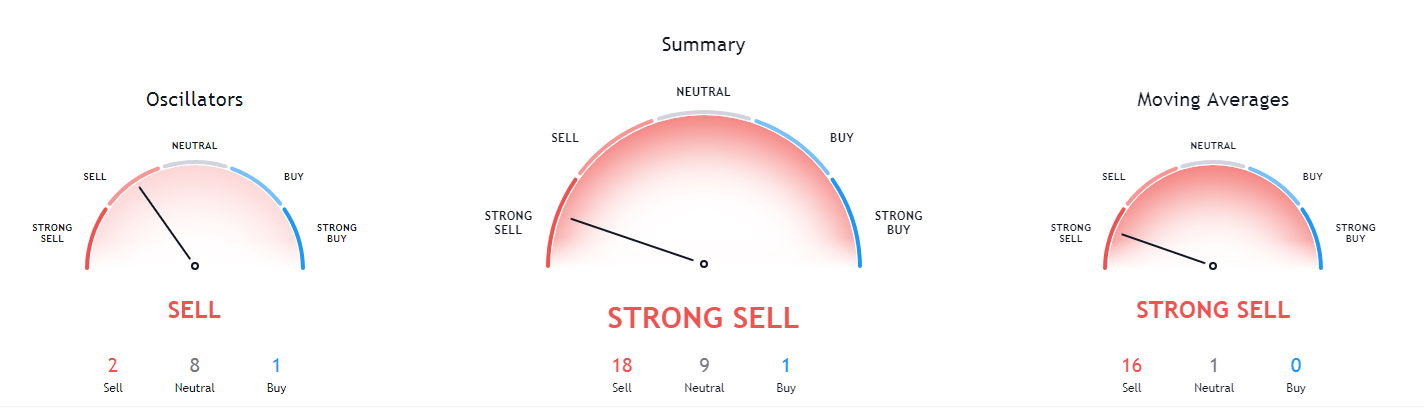
BTC/USD 4-hour Technicals
Technical factors (4-hour Chart):
- Price is below its 50-period EMA and its 21-period EMA
- Price is below its lower Bollinger band
- RSI is pushing towards oversold(37.02)
- Volume is average (with a couple of spike candles)
Key levels to the upside Key levels to the downside
1: $10,630 1: $10,500
2: $10,850 2: $10,360
3: $11,000 3: $10,015
Ethereum
Ethereum’s price movement has lost its structure ever since it broke the higher high/higher low pattern it has created. The second-largest cryptocurrency by market cap pushed towards the $371 resistance level, but failed to break it, causing a strong pullback which first tested $360, and then went all the way down to $340 as $360 failed to hold.
ETH/USD 4-hour Chart
While Ethereum’s 4-hour and 1-day technicals are now tilted towards the sell-side, its long-term overview seems extremely bullish. Its weekly or monthly technicals are both heavily tilted towards the buy-side.

ETH/USD 4-hour Technicals
Technical Factors (4-hour Chart):
- The price right below its 50-period and its 21-period EMA
- The price is below its lower Bollinger band
- RSI is heading towards the oversold territory (36.74)
- Volume is average with a couple of spike candles
Key levels to the upside Key levels to the downside
1: $360 1: $340
2: $371 2: $300
3: $400 3: $289
Ripple
XRP’s trading in the upper part of the range-bound by $0.235 and $0.2454 got interrupted by the market tumbling, pushing its price down towards $0.235 as well. While the $0.235 level was passed in the most recent push towards the downside, it is still unsure whether the price will stabilize above or below it. Traders should be very careful and should either try “riding the wave” if XRP starts to drop, or they should wait until the picture becomes a bit more clear.
XRP/USD 4-hour Chart
XRP technicals are now quite uniformed, with both short-term and long-term technicals being bearish. However, its weekly outlook shows a slight tint of bullishness.

XRP/USD 4-hour Technicals
Technical factors (4-hour Chart):
- The price is below both its 50-period EMA and its 21-period EMA
- Price is slightly below its lower Bollinger band
- RSI is heading towards the oversold territory (37.47)
- Volume is average (with a couple of spike candles)
Key levels to the upside Key levels to the downside
1: $0.2454 1: $0.235
2: $0.266 2: $0.227
3: $0.27 3: $0.221
Related posts
 Daily Crypto Review, Mar 12 – The US creating AmeriCoin? Altcoins plunging while Bitcoin increases its dominance
 Daily Crypto Review, July 20 – Twitter Hacker Possibly a BitMEX Trader; Hack Will End Up Being Good for Bitcoin?
 Daily Crypto Review, July 31 – Binance Debit Cards Now in Europe; XRP Whales Started Buying?
 Daily Crypto Review, Dec 17 – BTC Reaches a New ATH at $22k; XRP Skyrockets as it Breaks its Descending Channel
One reply on “Daily Crypto Review, Oct 2 – Trump Tests Positive for COVID-19; Crypto and Stocks Negatively Affected”
crypto has got knocked around so much recently