
Overview
The NZDUSD pair advances in a sideways corrective formation suggesting the progress in an incomplete short-term flat pattern. The completion of its move could give way to a new bearish movement of the upper degree; however, this incomplete correction could be temporary.
Market Sentiment Overview
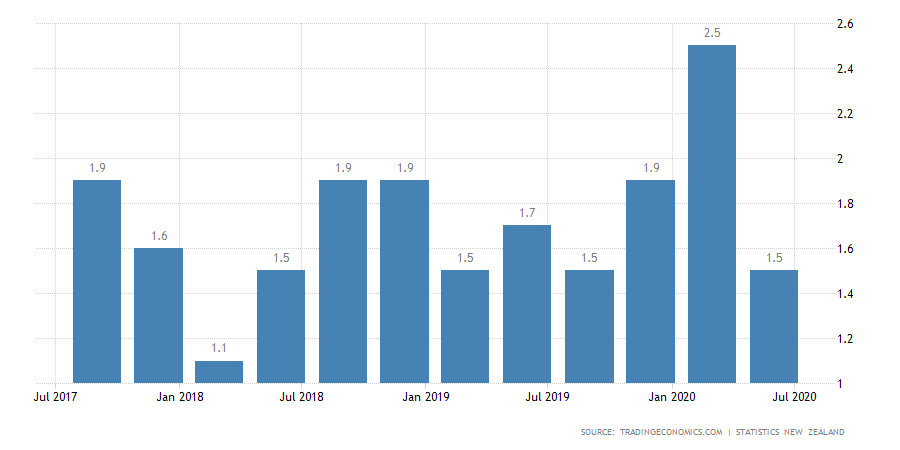
The New Zealand Dollar moves slightly bullish this Thursday, 22nd advancing 0.13%, expecting the inflation data released by New Zealand’s Statistics, Stats NZ, in the upcoming overnight session. The data corresponds to the third quarter of 2020, and surveyed analysts expect an increase that could rise to 1.7% (YoY), being 0.2% more than the previous reading published in July.
The New Zealand Dollar futures market sentiment, presented in the following daily chart, unveils the price moving in the extreme bullish sentiment zone. In the chart, we can distinguish 0.6463 as support the level and 0.6797 as the resistance level. A level that corresponds to the 52-week high.
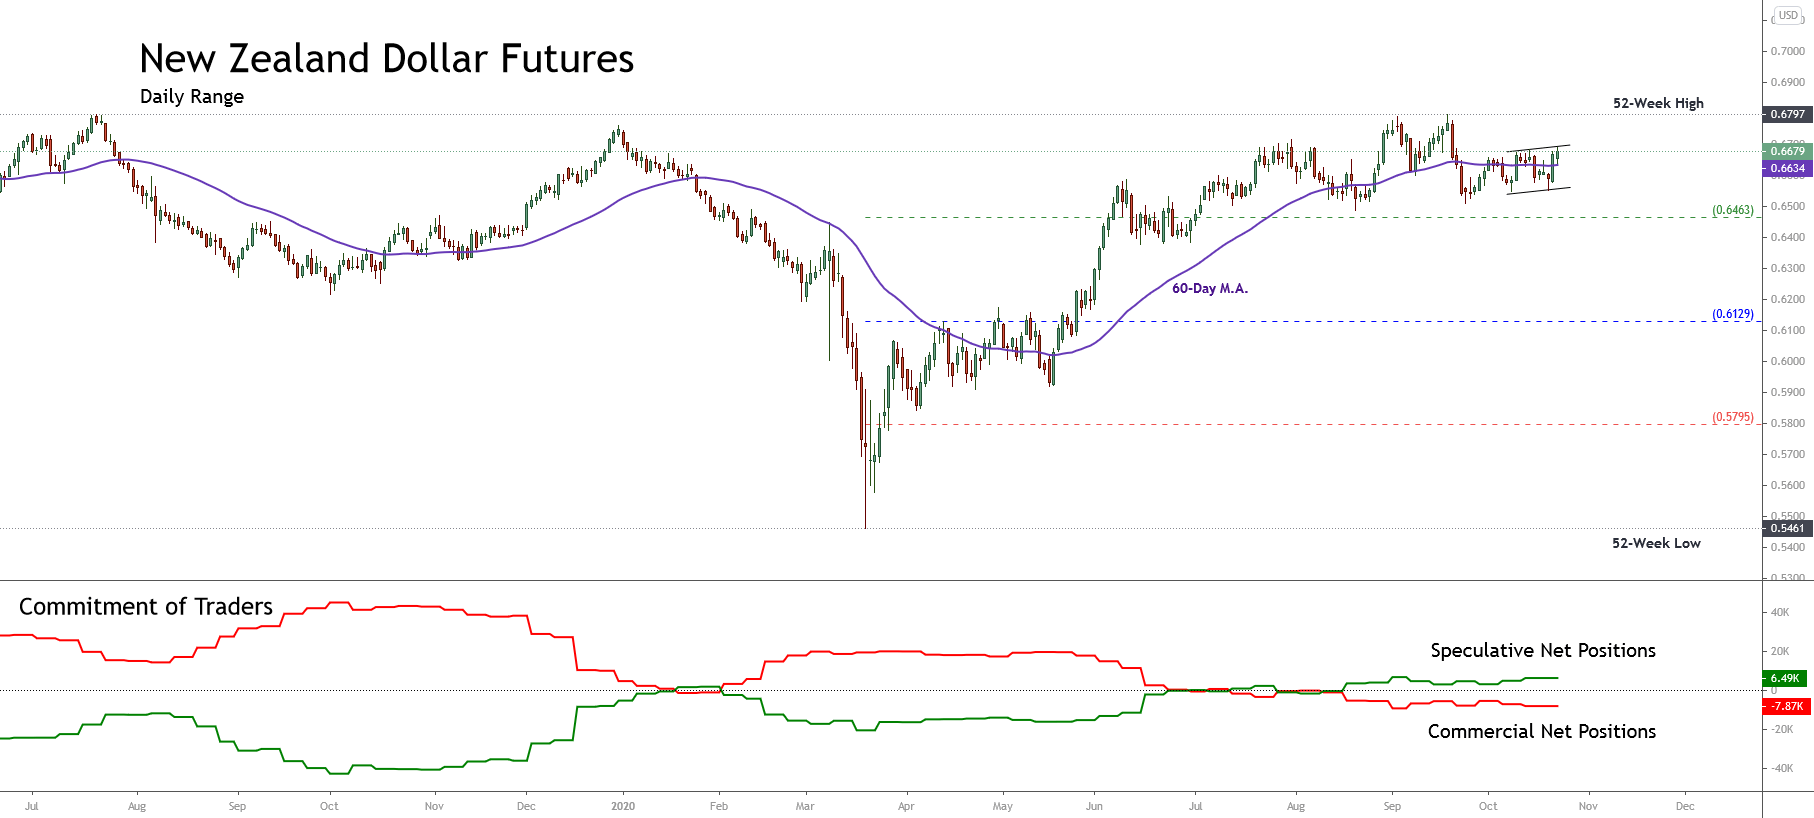
On the other hand, the chart highlights the price action is moving mainly sideways, consolidating around the weighted moving average of 60 days. This context of price action suggests we can expect a corrective move before continuing its bullish trend.
Concerning the evolution of the Commitment of Traders Report, the previous chart exposes the institutional positioning on the bullish side. In consequence, although the current consolidation calls for a corrective move, the primary trend is bullish.
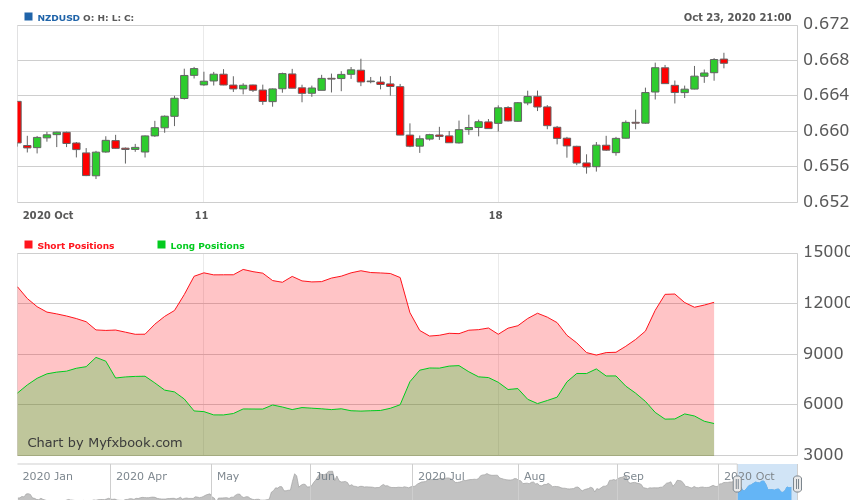
The next figure unveils that 73% of retail traders currently hold their positions on the bearish side, confirming a contrarian long-term upward bias to this pair.
Elliott Wave Outlook
The NZDUSD short-term outlook under the Elliott Wave perspective unveiled in its 3-hour chart exposes the kiwi’s sideways advance since the oceanic currency topped at 0.67978 on September 18th, where the pair started to develop a corrective structure that remains in progress.
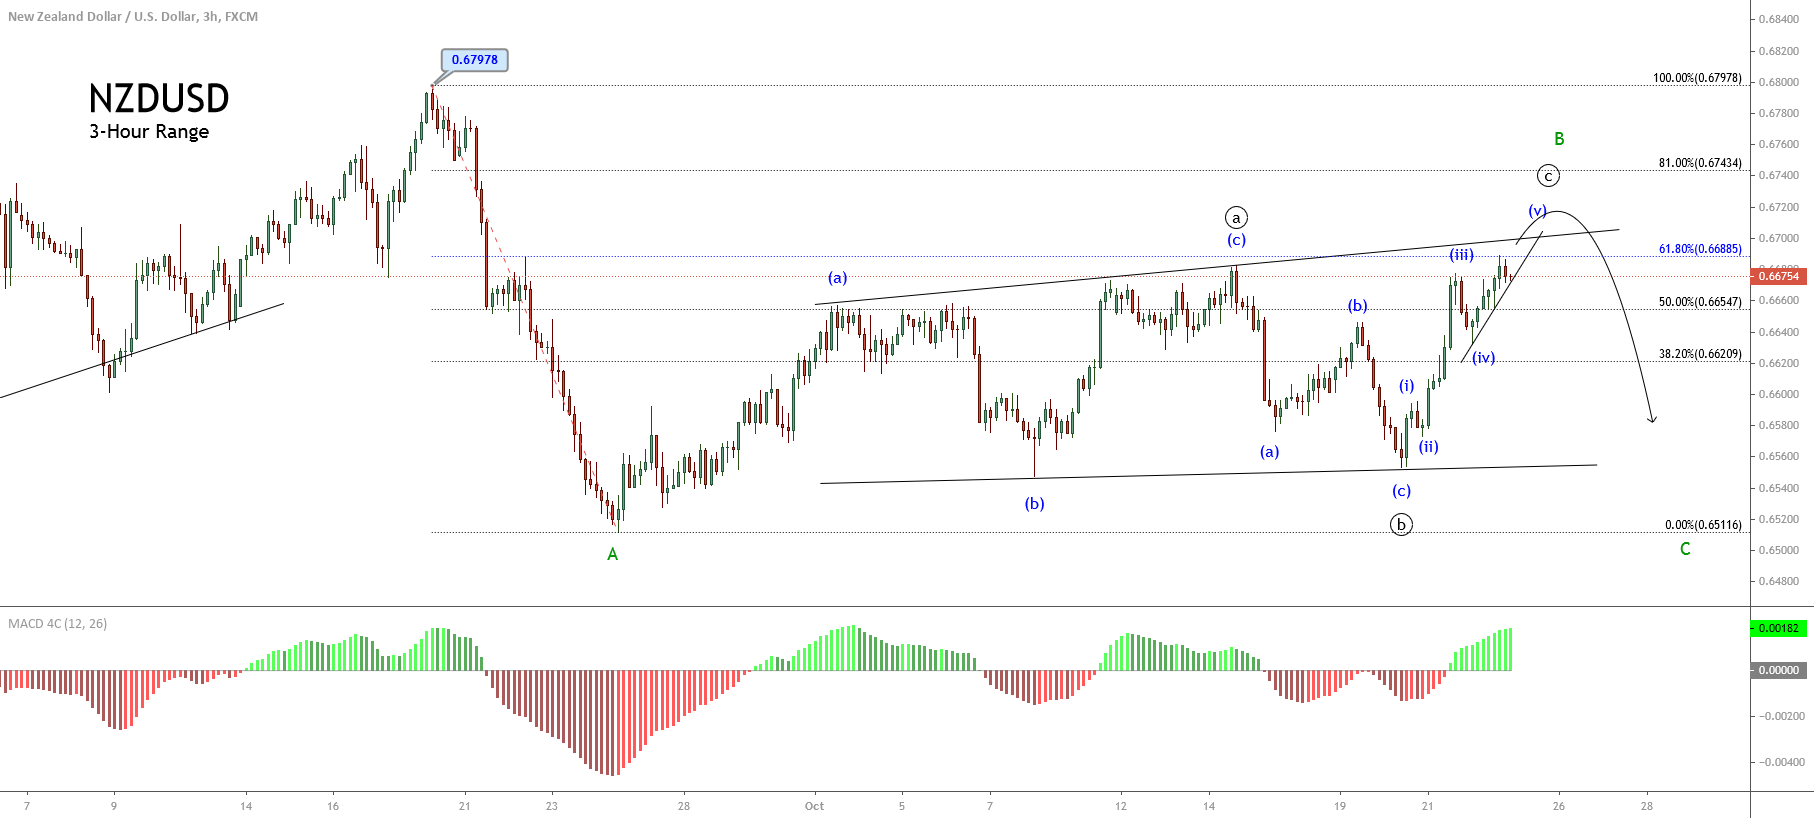
Considering that a corrective structure is subdivided into a three-wave sequence, we can notice in the previous figure that the NZDUAD action progresses in its second wave, identified as wave B of Minor degree, and labeled in green. This segment corresponds to a flat pattern (3-3-5), which currently develops its wave ((c)) of Minute degree identified in black.
At the same time, the internal structure of the wave ((c)) reveals that the price action could be advancing in its wave (v) of the Minuette degree labeled in blue. This market context suggests the possibility of a limited upside before start developing a downward sequence, corresponding to wave C of Minor degree.
In summary, the short-term outlook for the NZDUSD pair, under the Elliott Wave perspective, foresees a downward move, which corresponds to a wave C of Minor degree. This potential next move may subdivide into a five-wave sequence. Once this corrective formation completes, the Kiwi should begin to develop a new upward impulsive sequence of upper degree coinciding with the long-term institutional bias.