Categories
Forex Elliott Wave Forex Market Analysis

Is NZDJPY ready for a New Upward Move?

The Elliott Wave perspective of the NZDJPY pair reveals it is moving in an incomplete impulsive sequence that began on March 18th when the price found fresh buyers at 59.49.

Elliott Wave Landscape

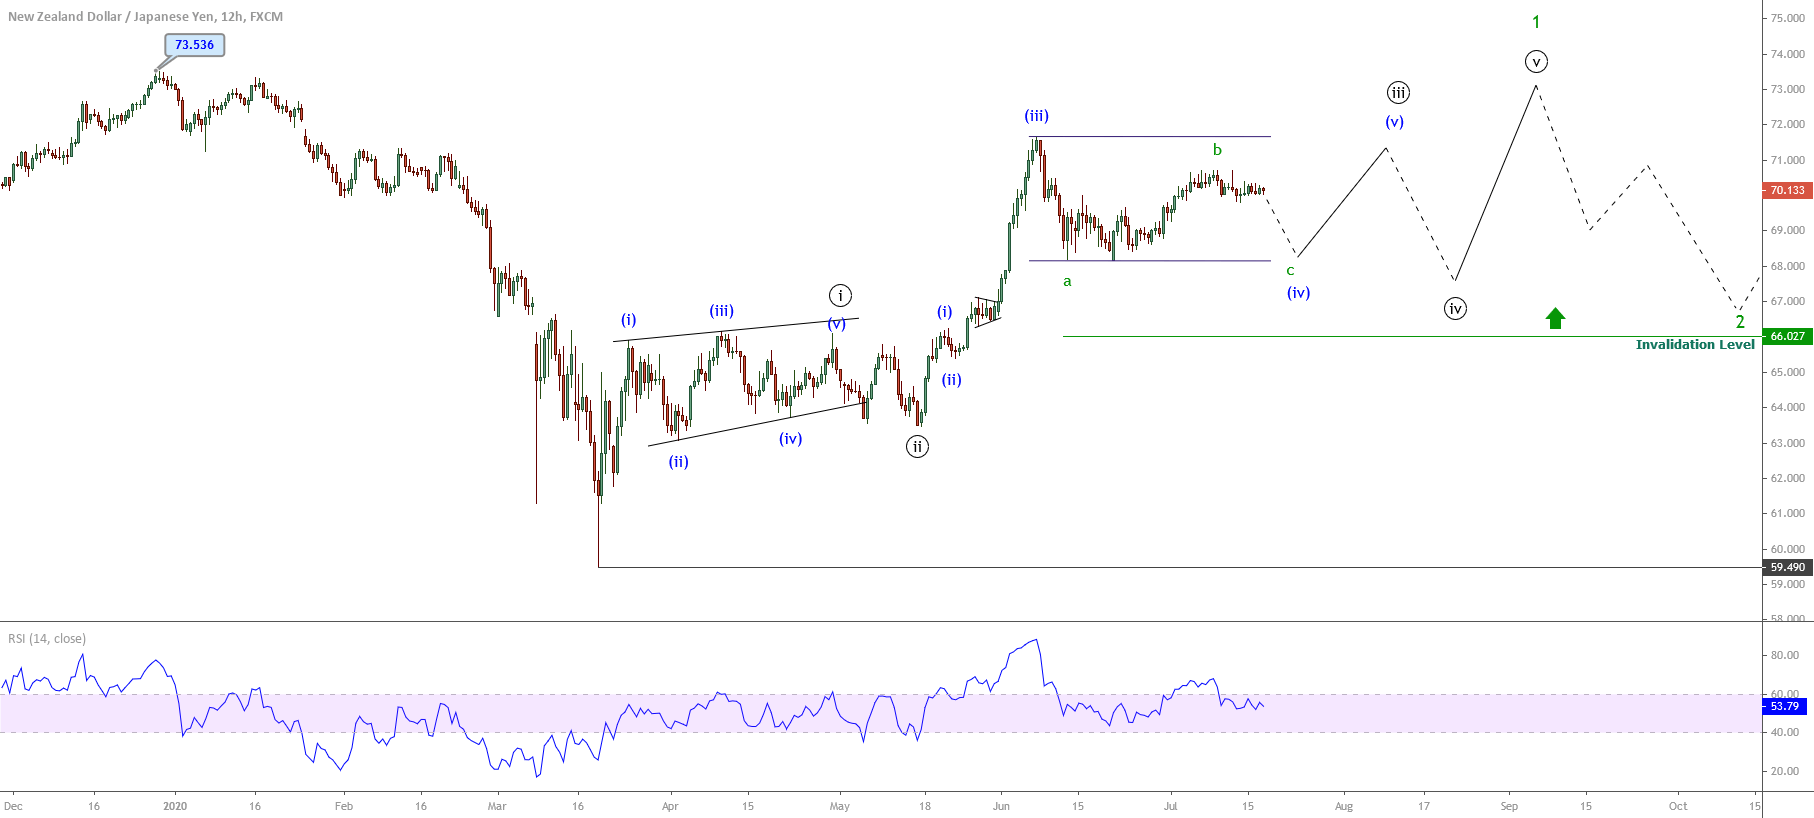
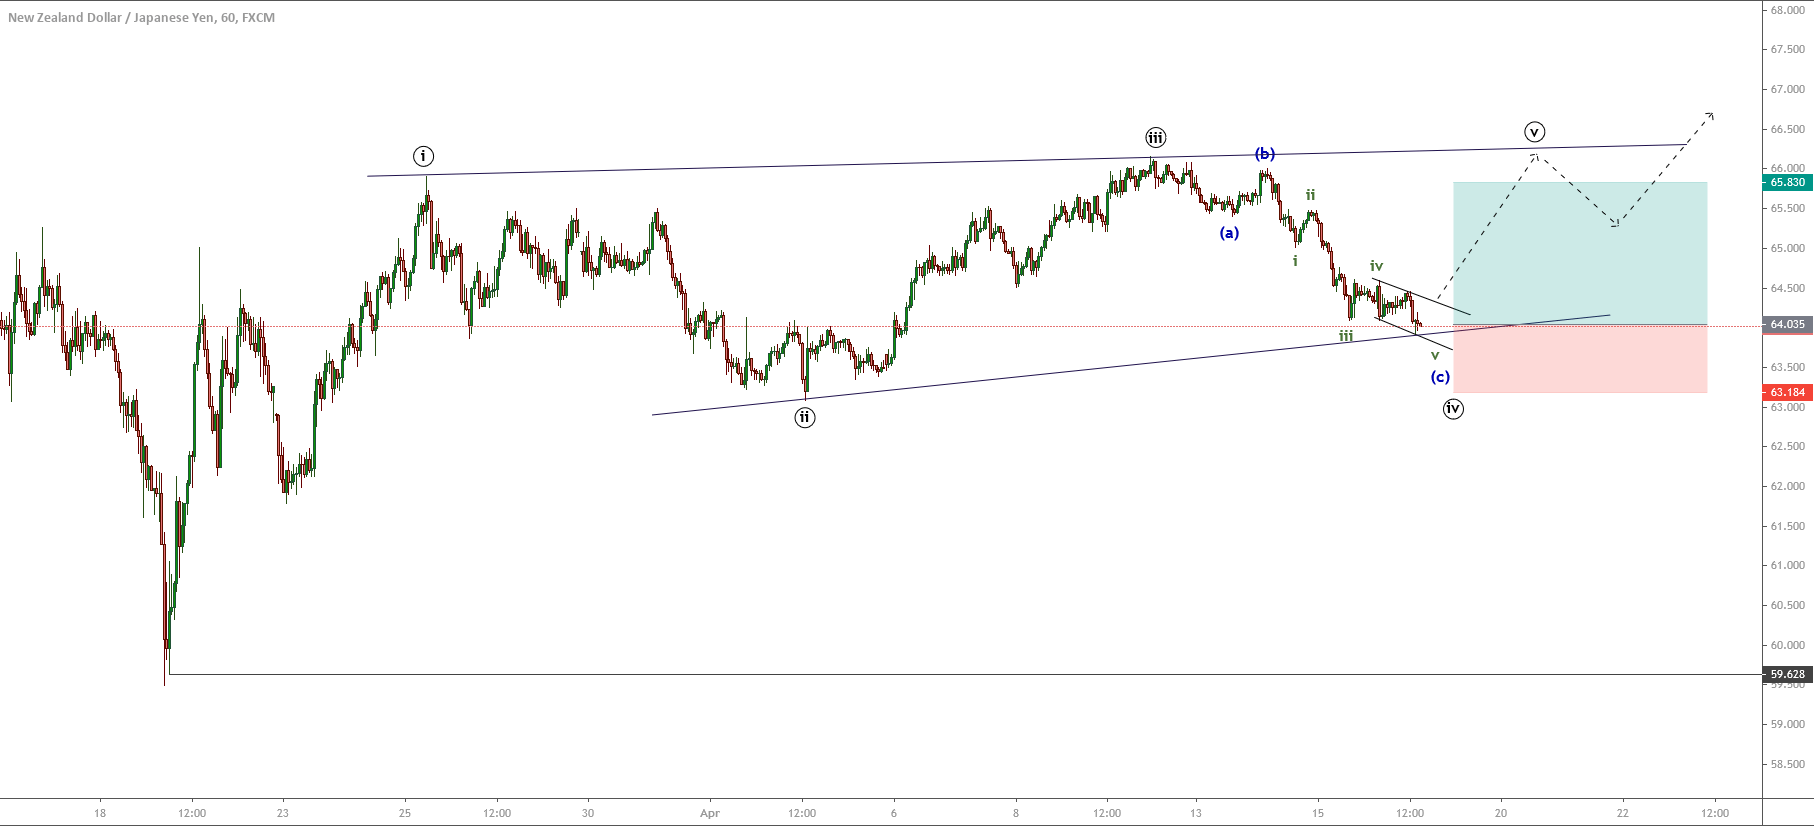
In its 12-hour chart, NZDJPY is seen progressing in its fifth wave of Minute degree labeled in black. Its internal structure reveals a sideways action corresponding to the fourth wave of Minuette degree identified in blue. Looking at this context, the cross would likely develop a new upward movement, which should correspond to the fifth wave of Minuette degree of the fifth wave of Minute degree,  following the Elliott Wave theory.

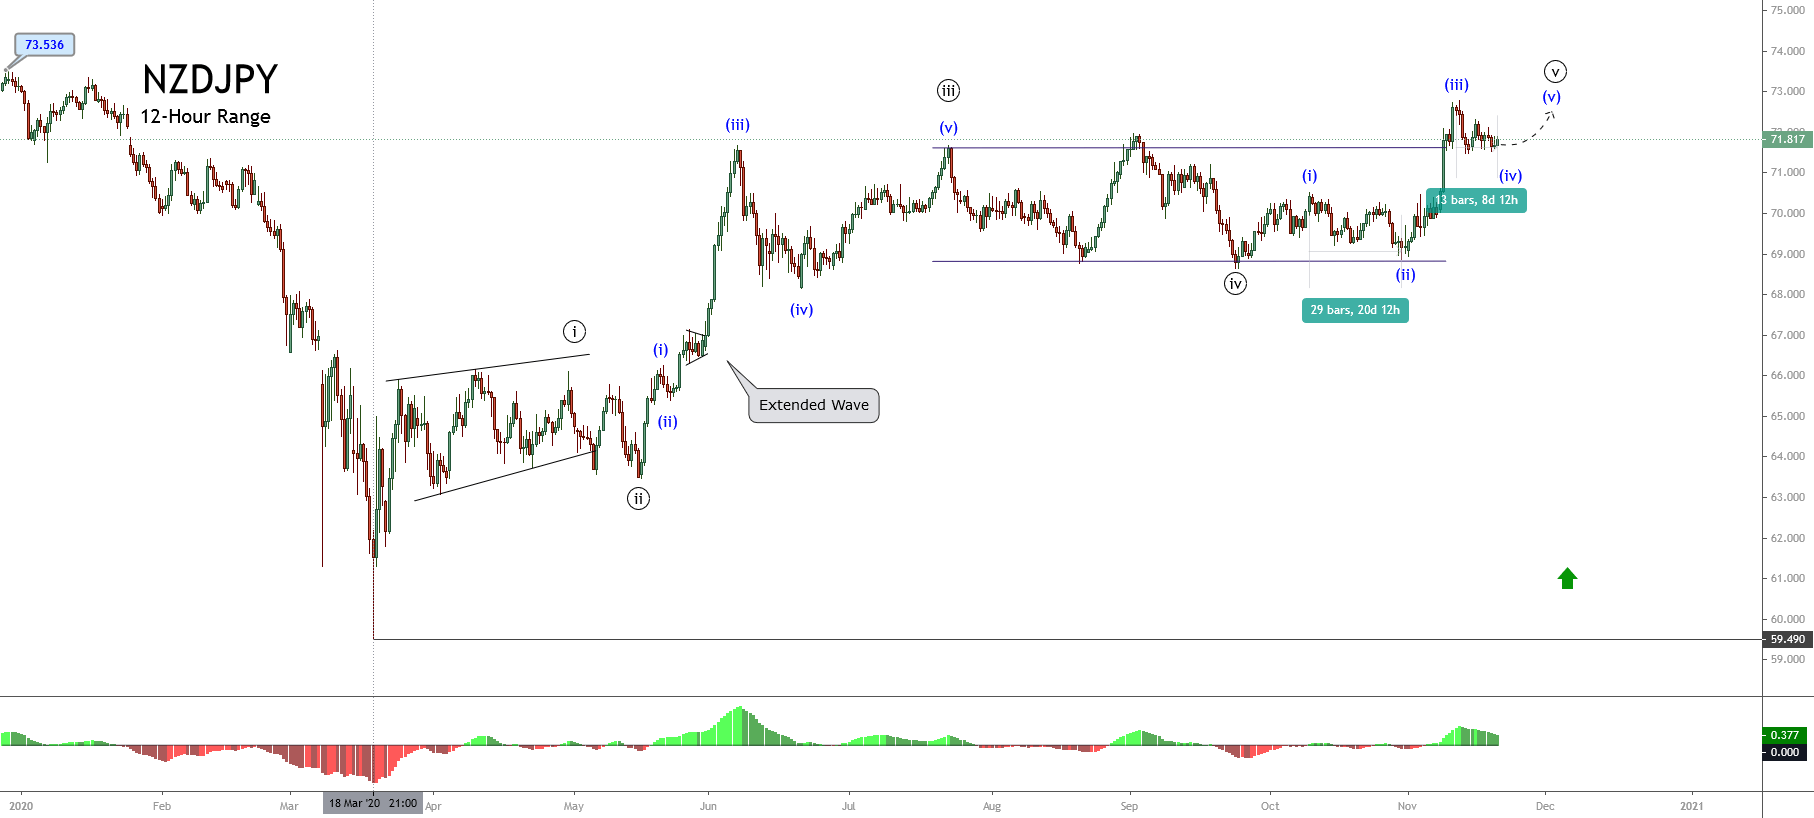
In this regard, the next movement corresponding to the fifth wave in blue of the fifth wave in black should be a terminal move. However, this potential sequence will not necessarily be an ending diagonal pattern.

On the other hand, as exposed in the previous chart, the third wave of Minute degree corresponds to the extended movement of the complete impulsive sequence of Minute degree. Therefore, under the EW rules, the fifth wave cannot be an extended move.

Finally, considering that the fifth wave doesn’t reveal a reversal formation, the current uptrend is likely to continue mostly bullish.

Short-term Technical Outlook

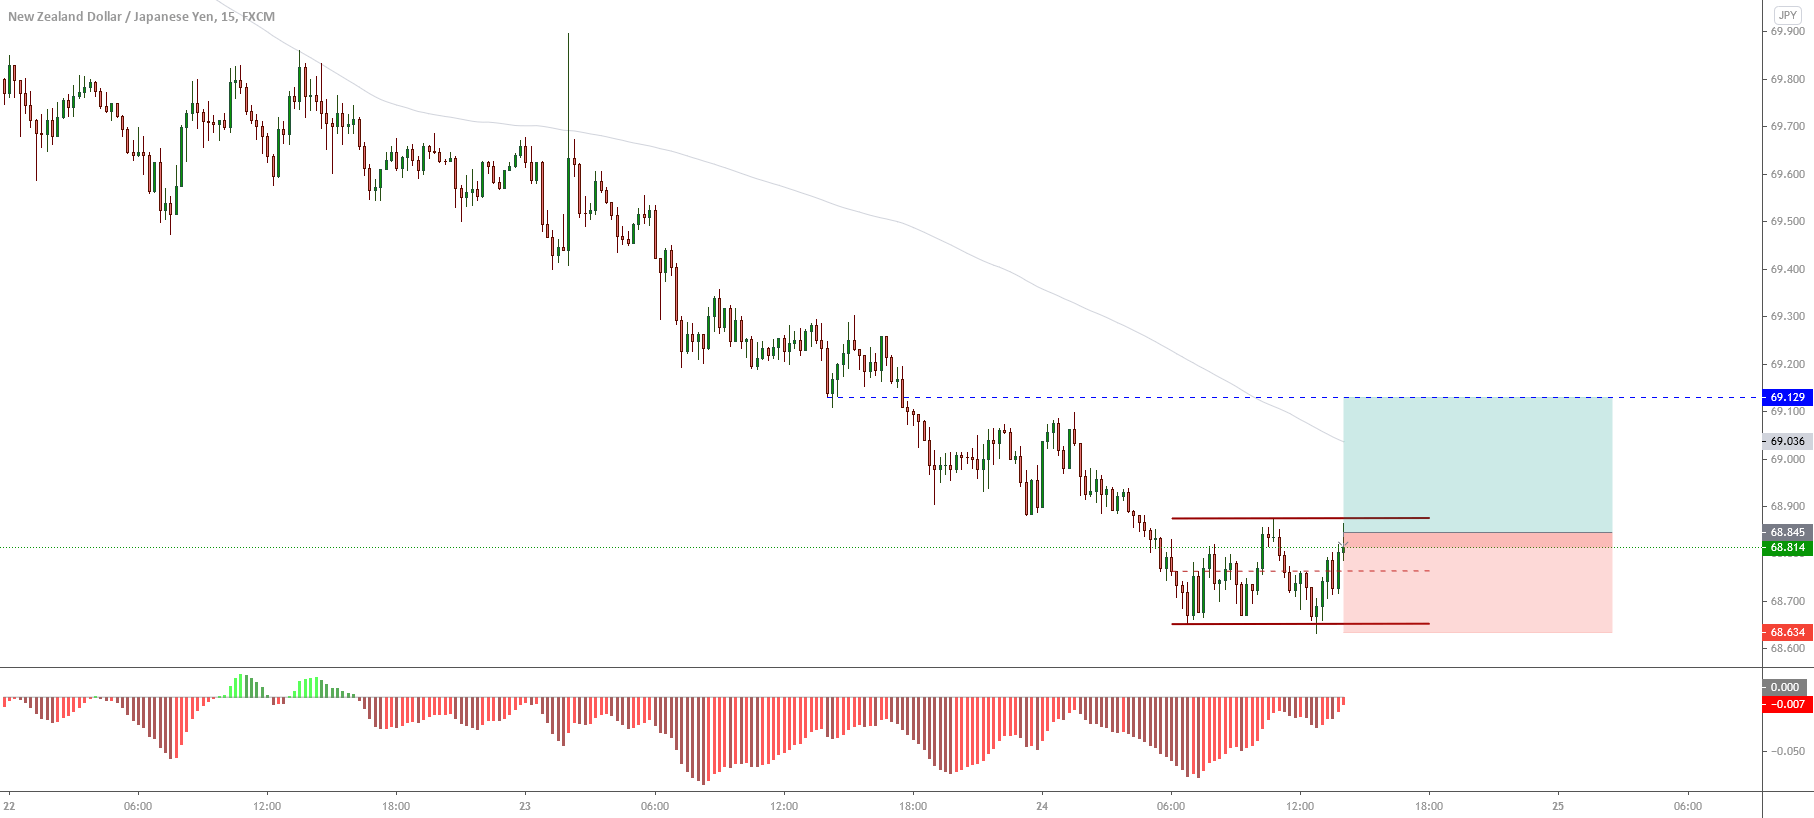
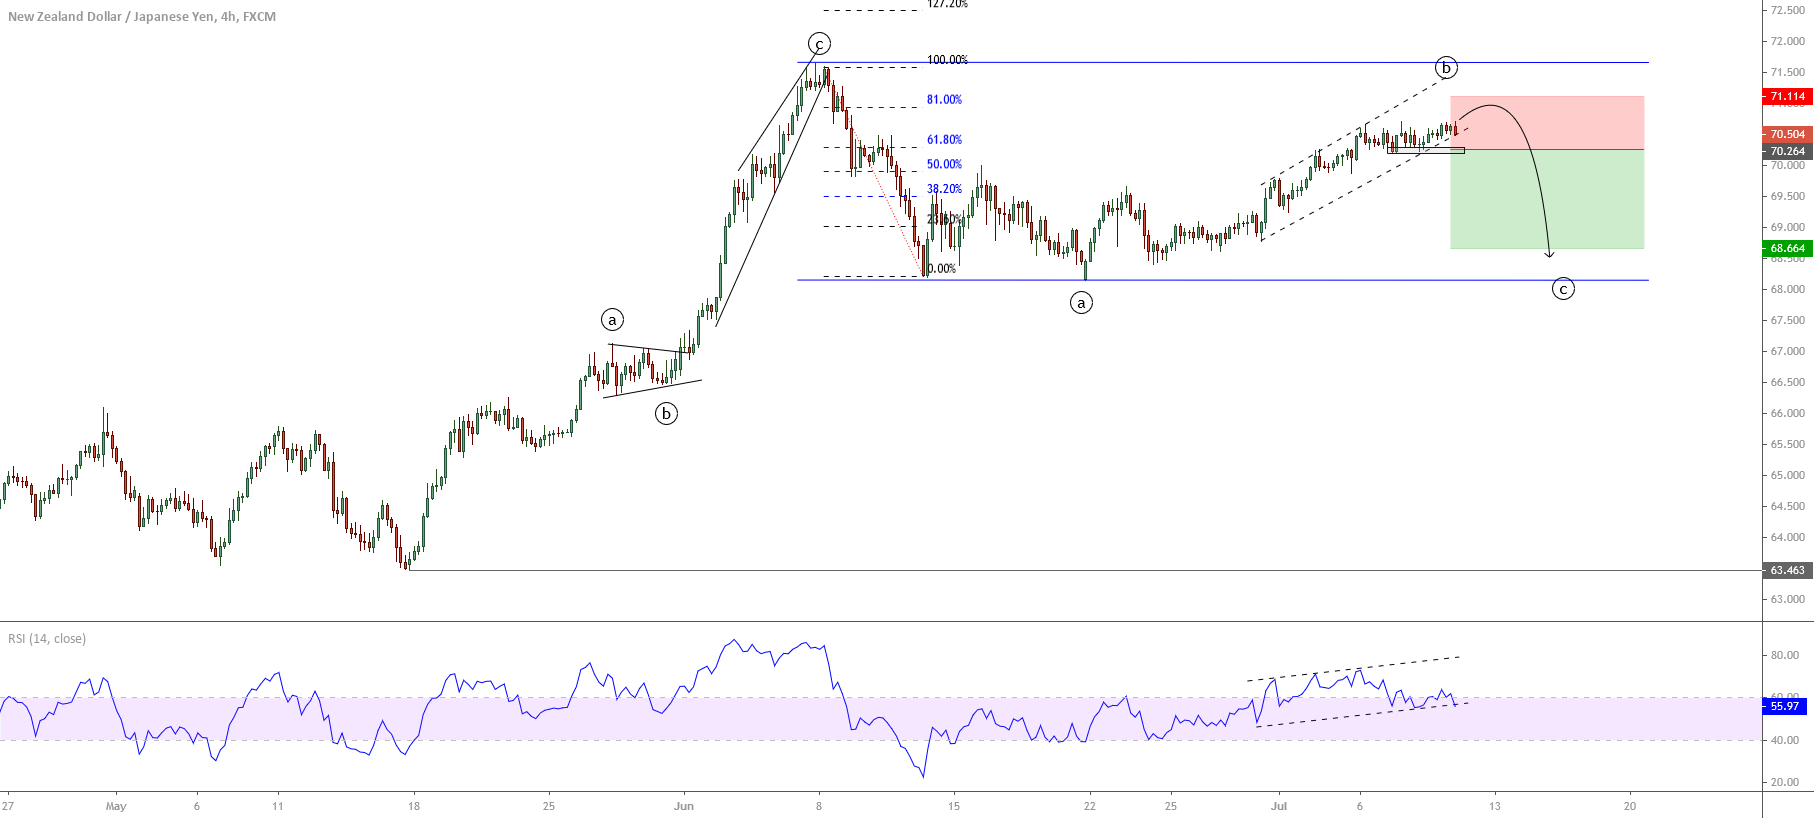
The short-term Elliott wave outlook for the NZDJPY cross displayed in the following 4-hour chart reveals the incomplete internal sequence that currently appears advancing in its fourth wave of Minuette degree identified in blue. At the same time, the corrective wave in progress is running in wave b of Subminuette degree labeled in green.

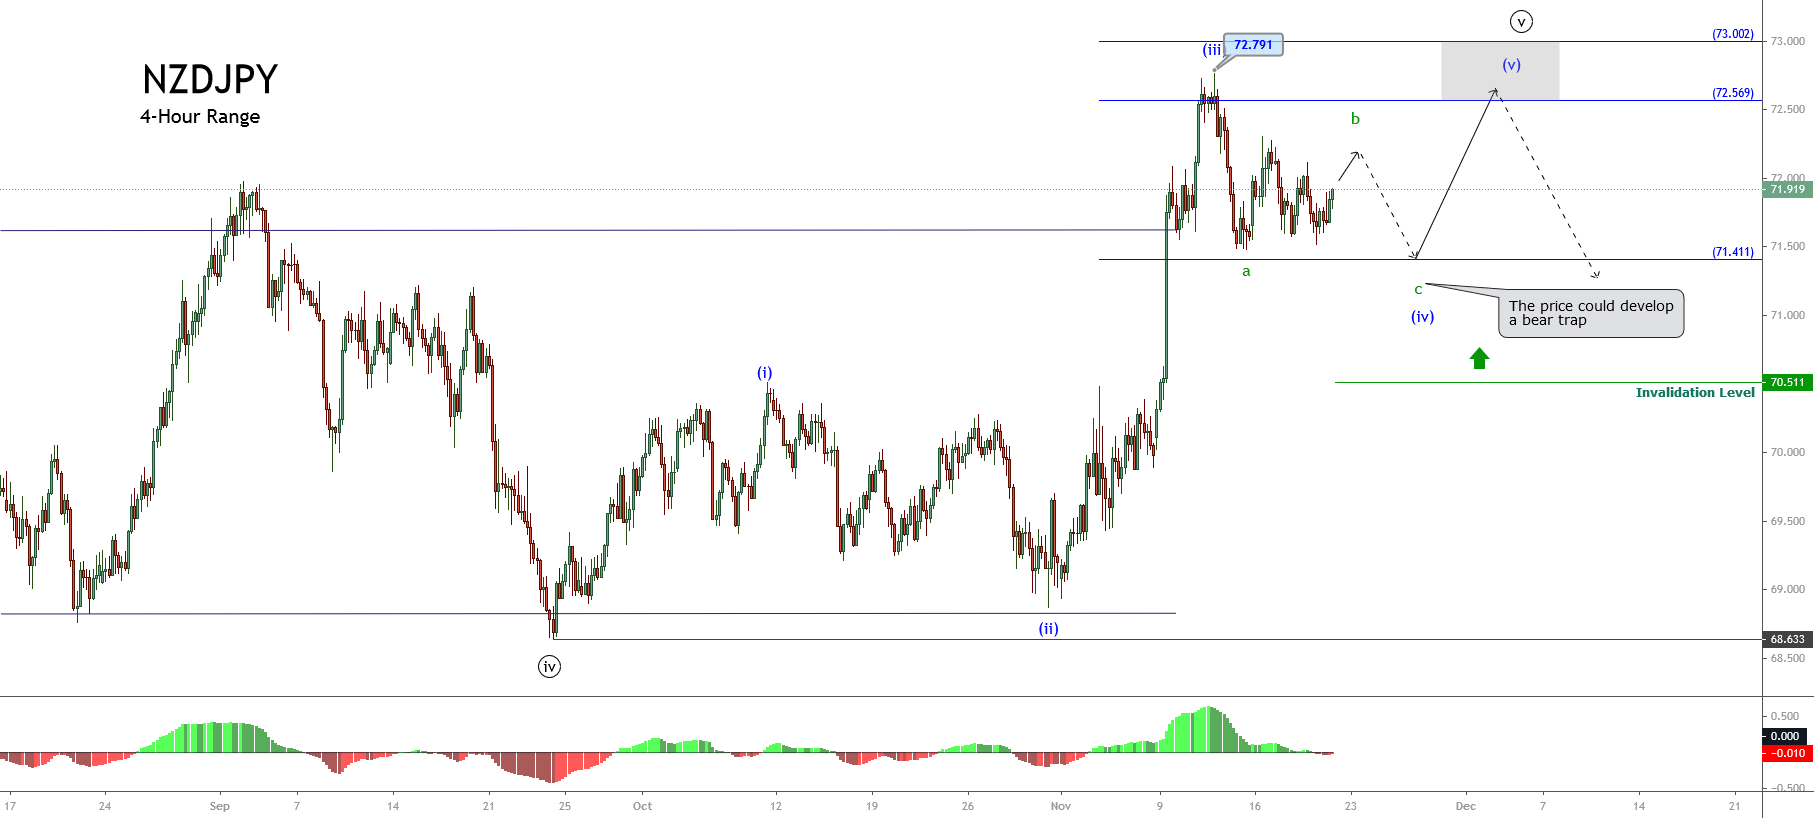
Once NZDUSD completes its wave b (labeled in green), it could develop a new decline corresponding to wave c. This intraday downward movement, subdivided into five internal segments, could fail below the latest lows, with its potential support on 71.411, where the NZDJPY cross could find fresh buyers expecting to boost its price toward the potential target zone located between 72.569, even till the psychological barrier at 73.002. This likely decline could be a “bear trap,” the big market participant could use to incorporate their long positions.

On the other hand, looking back in our first 12H chart, considering that the third wave is the extended wave,we can perceive two potential scenarios for the wave (v), in blue.

  • Scenario 1: Wave (v) doesn’t surpass the end of wave (iii) located at 72.791 and starts to decline, unveiling the bearish pressure for the cross. In this case, the price likely would pierce and close below level 71.411.
  • Scenario 2:  Wave (v) exceeds the end of wave (iii). In this case, the bullish pressure continues; therefore, the cross retracement could find support above the recent low located at 71.51.

Finally, the invalidation level corresponding to the intraday bullish scenario is 70.511, corresponding to the end of wave (i) identified in blue.

Categories
Forex Signals

NZDJPY Advances Boosted by Risk-On Sentiment

Description

The NZDJPY cross advances on Thursday trading session driven by the risk-on sentiment confirmed during the U.S. session opening, where the tech sector boosted the leading stocks indices. This bullish sentiment increases the possibility of a bounce in the commodity currencies.

The price of NZDJPY, exposed in its 15-minute chart, reveals the rejection of the bearish continuation once the price rebounded mainly bullish once it attempted to penetrate under the previous low of the current trading session located at 68,652.

On the other hand, from the sideways channel, we distinguish the possibility of activation of a double bottom pattern, leading to the price to strike the psychological barrier of 69.00, where the NZDJPY cross could start to find resistance.

Our bullish scenario foresees an escalation toward the level of 69.14, where the price could find intraday resistance. On the other hand, our upward scenario’s invalidation level locates below the baseline of the sideways channel at 68.59.

Chart

Trading Plan Summary


Check out the latest trading signals on the Forex Academy App for your mobile phone from the Android and iOS App Store.

Categories
Forex Market Analysis

NZDJPY Shows Long-Term Bullish Signals

The NZDJPY cross continues its recovery after the massive sell-off that made it lose over 18.6% in the first quarter of the year when it plummeted until 59.49. From this yearly low, NZDJPY raised near to 17.9% to date.

Market Sentiment Overview

The market sentiment of NZDJPY exposed in its weekly chart reveals the market action showing bullish reversal signals after surpass and consolidate above the 26-week moving average. 

At the same time, we observe that, last week, the price closed in the upper zone of its 52-week range. This context leads us to conclude that the market participants might continue pushing the price higher.

The following figure shows the net positioning of the New Zealand Dollar and Japanese Yen futures. In the chart, we observe that institutional participants maintain a bullish pressure on the kiwi. At the same time, big participants on the Japanese currency continue having a net positioning to the long-side under 50% of the 52-week high and low range.

Consequently, considering the market sentiment on both the NZ Dollar and Japanese Yen futures, we could expect more upsides for the NZDJPY cross.

The Elliott Wave Outlook

The long-term Elliott wave perspective of the NZDJPY cross illustrated in the following chart shows a bullish structural series in progress. The upward sequence began on March 18th when the cross found fresh buyers at 59.49, where the price action developed a V-turn bounce movement.

Once the NZDJPY cross started its bounce movement, the price began to develop an impulsive sequence subdivided into five internal segments of the Minuette degree identified in blue. According to the Elliott wave theory, the structural series drawn by the NZDJPY cross corresponds to a leading diagonal formation, which tends to appear in the first wave of an impulsive sequence or corrective structure. This pattern usually follows an internal structure subdivided into 3-3-3-3-3 or 5-3-5-3-5.

After the leading diagonal completion on April 30th, high at 66.103, when the cross ended its wave ((i)) of Minute degree identified in black, the price made a higher low at 63.46 on May 17th corresponding to its wave ((ii)). Once this second wave ended, the NZDJPY cross began to rally on the wave ((iii)), which remains incomplete.

Currently, the NZDJPY cross advances in its wave (iv) of Minuette degree in blue of the incomplete third wave of Minute degree.

Our outlook for the NZDJPY cross, based on the Elliott Wave perspective, anticipates a limited decline into five waves, which could complete the wave (iv) of the Minuette degree in blue. Once this sequence ends, the market action should find fresh buyers expecting to continue pushing the cross higher. This way, the NZDJPY cross should complete the wave ((iii)) of Minute degree.

Considering that the next movement will correspond to wave ((iv)) of Minute degree, we could expect the price moving mostly sideways before starts climbing on its fifth wave of Minute degree.

Finally, considering that the market sentiment reveals an increasing bullish momentum for the New Zealand Dollar, and the Japanese Yen exposes a neutral bias that seems to start turning bearish, long-term, NZDJPY could experience more rallies.

In consequence, our preferred positioning for the NZDJPY cross still remains on the bullish side. Any time the price drops could be an opportunity to join the long side.

Categories
Forex Signals

NZDJPY Could Resume its Declines

Description

The NZDJPY cross in its 4-hour chart exposes the advance in a sideways structural series that corresponds to a potential regular flat pattern, which shows signals of finalization of its wave ((b)) giving way to its wave ((c)) of Minute degree labeled in black.

The mid-term picture illustrates the last upward sequence that began on May 15th at 63.463. This ascending movement, which seems to be an impulsive sequence, corresponds to an aggressive corrective formation, which ended on June 07th at 71.667. 

Once the price completed its wave ((c)), the price action started a massive sell-off win three moves until 68.156 reached June 21st from where NZDJPY cross began to advance in its wave ((b)) developing a narrow range. The lower volatility revealed on the wave ((b)) progress shows us the alternation principle, which calls for a further decline corresponding to wave ((c)).

On the other hand, the RSI oscillator illustrates the decreasing momentum of the wave ((b)). In this context, the breakdown below the previous lows at 70.36 could allow us to incorporate us to the next wave ((c)), which could drop until the zone of 68.66.

The invalidation level of our bearish scenario locates at 71.114.

Chart

Trading Plan Summary

Check out the latest trading signals on the Forex Academy App for your mobile phone for Android and iOS.

Categories
Forex Signals

NZDJPY Progress in a Potential Leading Diagonal Pattern

Description

The NZDJPY cross in its hourly chart illustrates the progress in a potential leading diagonal pattern. This Elliott wave formation calls for further upsides in the coming sessions.

According to Elliott wave theory, the leading diagonal is a five-wave formation subdivided in a 3-3-3-3-3 internal sequence, in where its five segments overlapped one each other tends to appear in a first wave.

Our bullish scenario considers the upside corresponding to its fifth wave of Minute degree identified in black, from the level 64.035, with a potential profit target at 65.830. The invalidation level locates at 63.184, which corresponds to the end of the second wave in black.

Chart

Trading Plan Summary

  • Entry Level: 64.035
  • Protective Stop: 63.184
  • Profit Target: 65.83
  • Risk/Reward Ratio: 2.39
  • Position Size: 0.01 lot per $1,000 in account.
Categories
Forex Assets

What Should You Know Before Trading The NZD/JPY Currency Pair

Introduction

NZDJPY, or the NZD/JPY or the New Zealand dollar against the Japanese yen, is a cross-currency pair in the Forex market. The left currency (NZD) represents the base currency, and the one the right (JPY) represents the quote currency.

Understanding NZD/JPY

The market value of NZDJPY is a value of JPY that is required to buy one NZD. It is quoted as 1 NZD per X JPY. For example, if the CMP (current market price) of NZDJPY is 72.657, then it takes 72.657 yen to buy one New Zealand dollar.

NZD/JPY Specification

Spread

Spread is the difference between the bid price and the ask price controlled by the broker. It varies across brokers and their type of execution.

ECN: 0.8 | STP: 1.7

Fees

On every trade a trader takes, there are few pips of fee on it. And this is only on ECN accounts because the fee on STP accounts is nil.

Slippage

Slippage, which happens on market orders, is the difference between the price asked by the client and the price he actually received. There are two primary reasons for it, namely, the broker’s execution speed and the change in volatility of the market.

Trading Range in NZD/JPY

The average, minimum, and maximum pip movement is determined in the trading range table. This comprehensive table helps traders assess the profit they can generate and loss they can incur in a given timeframe. Moreover, this table is helpful in analyzing the cost variation in a trade, which shall be discussed in the next section.

Procedure to assess Pip Ranges

  1. Add the ATR indicator to your chart
  2. Set the period to 1
  3. Add a 200-period SMA to this indicator
  4. Shrink the chart so you can assess a large time period
  5. Select your desired timeframe
  6. Measure the floor level and set this value as the min
  7. Measure the level of the 200-period SMA and set this as the average
  8. Measure the peak levels and set this as Max.

NZD/JPY Cost as a Percent of the Trading Range

The cost of a trade is not the same throughout the trading day. It varies based on the volatility of the market. Hence, it is necessary to know during what times the cost is high and what times it is low. This could be found out from the table illustrated below.

ECN Model Account 

Spread = 0.8 | Slippage = 2 |Trading fee = 1

Total cost = Slippage + Spread + Trading Fee = 2 + 0.8 + 1 = 3.8

STP Model Account

Spread = 1.7 | Slippage = 2 | Trading fee = 0

Total cost = Slippage + Spread + Trading Fee = 2 + 1.7 + 0 = 3.7

The Ideal way to trade the NZD/JPY

The magnitude of the cost percentage is directly proportional to the cost of a trade. So, the higher the value of the percentage, the higher is the cost of a trade. From the table, it can be observed that the cost is highest in the min column compared to the other two columns. This means that the costs are highest when the volatility of the market is low and vice versa, irrespective of the timeframe you’re trading. It is neither ideal to trade when the volatility of the market is high, nor when the costs are high. The average column is on the one we focus on. Trading when the volatility is at the average value is when you can expect moderate volatility and decent costs.

Also, you may reduce your costs by trading using limit or pending orders instead of market orders. This will bring the slippage to ground zero. This, in turn, will reduce the total cost of the trade as well. An example of the same is illustrated below.

Spread = 1.7 | Slippage = 0 | Trading fee = 0

Total cost = Slippage + Spread + Trading Fee = 0 + 1.7 + 0 = 1.7

Hence, it is seen that the costs have reduced by around 50% of the previous value.

Categories
Forex Market Analysis

Daily: busy day of ECB, BoE, and US CPI


NEWS COMMENTARY


It’s a busy day with two central banks meetings along with the US consumer price index

But as always, starting with the trade war the major issue that moves the markets, China accepted an invitation by the United States to hold a new round of trade talks, raising hopes for a deal easing the tariff war between the world’s two biggest economies.

Chinese Foreign Ministry spokesman Geng Shuang said earlier that Beijing had received the invitation and welcomed it, adding that the two countries were in discussion about the details.

The Trump administration had invited Chinese officials to restart trade negotiations

This comes after President Donald Trump warned last week that there could more trade tariffs against Beijing totaling $267 billion, on top the already $200 billion in tariffs previously announced.


US consumer price is expected to have risen 0.3% last month and 2.8% over the prior year, according to estimates.

The U.S. central bank is widely expected to raise interest rates at its September meeting, but odds for another move in December have decreased in recent days.


The European Central Bank is all but certain to keep interest rates at their current record low levels, making only nuanced changes to its guidance to stay on course to end bond purchases this year and raise interest rates next autumn.

With Thursday’s decision, the ECB’s deposit rate, currently its primary interest rate tool, will remain at -0.40% while the main refinancing rate, which determines the cost of credit in the economy, will remain at 0.0%.


The Bank of England is also expected to hold fire after raising interest rates last month. If all goes as expected, the British central bank will keep rates at 0.75%

Investors will look closely at the breakdown of votes on the nine-member Monetary Policy Committee for further indications on the timing of the next rate increase.

Comments regarding the ongoing Brexit negotiations will also be in focus.

Expectations of another BoE rate hike are only seen in the second half of next year, given Britain’s plans to leave the European Union in March.


Positive data came from the Australian employment change which hiked up to 44.0K higher than expected 16.5K


CHART ANALYSIS


DAX

On the daily chart, we can see that the price had a bearish rally for the past six weeks until it reached the key support zone of 11900.8-11742.4

It’s also the lower side of the descending channel along with 88.6% Fibonacci

The price is technically expected to have its way up back again to the key resistance level 12582.46 which is the top of descending channel and the broken ascending trend


OIL

On the daily chart, the price is moving sideways between the support area 66.2-64.15 and the resistance area 74.45-72.45

After breaking the ascending trend, the price turned back to this support zone with bounce from an ascending trend as shown

The price now is retesting this zone with price action “pin bar”, to have a bullish movement again

So, it’s expected to go up to the resistance zone of 72.45-74.45


NZDJPY

On the daily chart, the pair is facing a punch of support levels

Firstly the key support zone 72.65-72.35, secondly the down side of the descending channel, third the AB=CD harmonic pattern, forth the double bottom reversal pattern, and finally the divergence on RSI

So, the price is supposed to get back up again to the resistance 74.01


CADCHF

On the daily chart, the pair is facing a punch of support levels

Firstly the key support level of 0.732, secondly the ascending trend from the low of 2016, third the Gartley harmonic pattern, forth the wedge reversal pattern, and finally the oversold on RSI

So, the price is supposed to get back up again to the resistance 0.762


Categories
Forex Market Analysis

Daily: Trade Tensions Continue, Non-Farm Payrolls, UK Growth


NEWS COMMENTARY


The U.S. dollar was lower against other currencies on Monday, as trade tensions put expectations for a Federal Reserve rate hike in September under pressure.

trade tensions with China continued, as U.S. President Donald Trump warned he would impose tariffs on $267 billion worth of Chinese imports, on top of an earlier promise of tariffs on $200 billion worth of Chinese goods.

China’s foreign ministry said on Monday that it would “respond to any news steps on trade”.

“If the U.S. side obstinately clings to its course and takes any new tariff measures against China, then the Chinese side will inevitably take countermeasures to resolutely protect our legitimate rights,” Foreign Ministry spokesman Geng Shuang said.

The US index was down despite Friday’s upbeat jobs report increasing expectations of a fed rate hike in at its next meeting September 25-26.

US non farm payrolls were close to expectations but the market is entirely focused on wages and the report showed hourly wages up 0.4% higher than 0.2% expected.

It was a different story in Canada where employment fell  to 51.6K jobs compared to +5.0K expected. Hourly wages there also fell to 2.6% compared to 3.0% previously and 3.5% two months ago

The British economy posted the fastest expansion in nearly a year as the services sector remained powerful  in the three months through July. Growth beat economist estimates to come at 0.6 & with construction output and retail also providing an enhancement. Separate figures showed the trade deficit in goods narrowed to a five-month low of 9.97 billion pounds ($13 billion) in July.


chart analysis


DAX

On the daily chart, we can see that the price had a bearish rally for the past six weeks until it reached the key support zone of 11900.8-11742.4

It’s also the lower side of the descending channel along with 88.6% Fibonacci

The price is technically expected to have its way up back again to the key resistance level 12582.46 which is the top of descending channel and the broken ascending trend


OIL

On the daily chart, the price is moving sideways between the support area 66.2-64.15 and the resistance area 74.45-72.45

After breaking the ascending trend, the price turned back to this support zone with bounce from an ascending trend as shown

The price now is retesting this zone with price action “pin bar”, to have a bullish movement again

So, it’s expected to go up to the resistance zone of 72.45-74.45


CHFJPY

On the daily chart, the pair is facing a punch of resistance levels

Firstly the key resistance 116, secondly the weekly descending line from the high of 2015, third the up side of the ascending channel which is considered as a flag, and finally the overbought on RSI

So, the piece is expected to turn back down to the support 112.8


NZDJPY

On the daily chart, the pair is facing a punch of support levels

Firstly the key support zone 72.65-72.35, secondly the down side of the descending channel, third the AB=CD harmonic pattern, forth the double bottom reversal pattern, and finally the divergence on RSI

So, the price is supposed to get back up again to the resistance 74.01