
Macroeconomic Outlook
Three references for the markets this week
1) Trade relation between China and USA
- Last Friday it was agreed what it could be the beginning of talks that will take time
- Rather a constructive agreement than a bad one
2) Inflation
- American inflation is the key variable this week
- It is expected to increase to 2.5% from previous 2.4%
- Currently is above the 2% target and this creates certain anxiety and can have some effect on bonds
- Might consider the option of a lower than expected inflation (<2.4%)
- Payrolls data, which was published on Friday, was 2.6% instead of 2.7% moving away from the 3% barrier
- The option of a lower inflation rate provides a less stressful outlook
3) Quarterly Results
- Really good so far in the USA
- Partly because of the tax reform
- EPS had increased to an average of 24,8% when at the beginning it was expected to be around 17%
- Good so far too in Europe
- More European companies will publish results this week
Hence, bearing in mind a decent agreement between USA and China, the possibility of lower inflation and good corporate results, the markets should bounce and rise a little this week.
Furthermore, if the inflation turns out to be lower, it could be good for bonds and could contribute to a weaker US Dollar wich has increased significantly recently.
Technical Analysis
US Dollar Index
Daily Chart
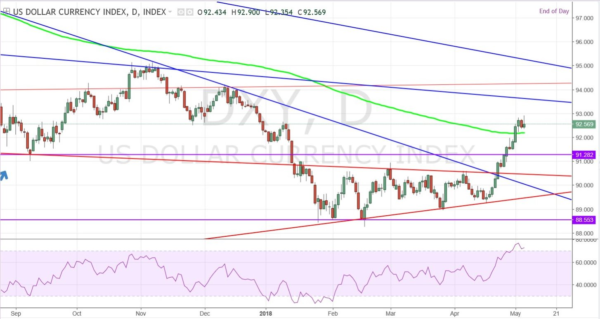
It is possible to appreciate how the US Dollar Index, after tumbling for a couple of weeks, broke all the resistances and increased significantly. The most important resistances generated from its monthly bearish trend have been broken in one strong movement upward. Including, also, its 200-day EMA which is retesting right now. The only significant resistance that is facing now is at the 93.5 which will be the next target leaving some space for a longer run.
EURUSD
Daily Chart

After testing for the third time the bearish trend line on the top it dropped, strongly breaking its two supports below it. Not only it fell after testing its resistance and breaking the upcoming supports but also, on Wednesday it broke below the third support which is currently retesting. This can be either a fake breakout or another shorting opportunity.
GBPUSD
Daily Chart
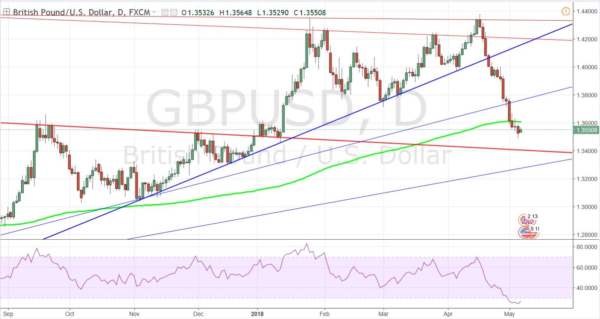
After breaking the support, which has been holding price during its bullish trend line, it is eyeing the next solid resistance which is at a level of 1.34 more or less. After breaking the 200-day EMA, it is taking a rest. It may either retest the recent support broken which is hard as the bullish trend was really steep or test the next resistance which is closer and extending the bearish move.
USDJPY
Daily Chart
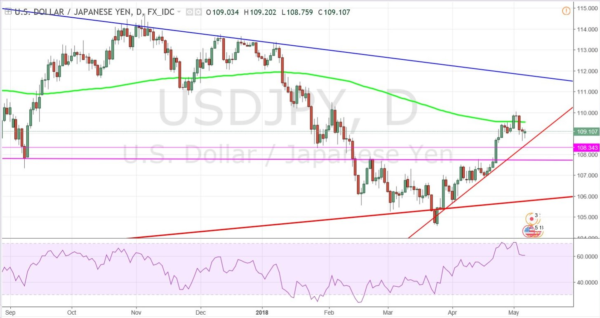
The dollar broke both resistances after doing a fake breakout and bouncing back from the monthly support. It has created a small bullish trend in the short term where it can be holding on until it reaches its next target which is the monthly bearish trend, currently situated at a level of 111.5. Either that or starts going sideways for the next days until it breaks one of the monthly trends.
Crude Oil
Daily Chart
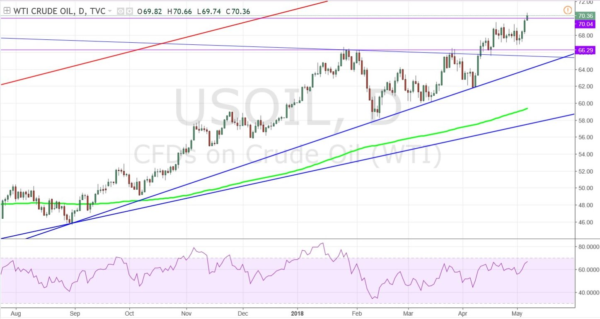
Recent geopolitical events and tensions in Syria have created volatility in the markets, and consequently, the price of oil has been on the rise. After holding to the bullish trend line and breaking above $65 it did a retest of the recent resistances it just broke above. Without more resistances ahead, it has just reached the expected target of $70 per barrel. There are not any significant resistance above which leaves the door open for a longer bullish run.
DAX
Daily Chart

It bounced back from the monthly bearish trend which was the strongest one and consequently in the recent run it has just broken both two bearish weekly resistances. Last Friday it closed above the last resistance which leaves the door open for a continuation, possibly at less slow pace, of the recent bullish trend formed from testing the resistances and breaking the supports.
©Forex.Academy
