Categories
Forex Videos

Is War Developing Between China, Taiwan & The USA! How To Trade In Times Of War!


Is a war developing between China, Taiwan, and the USA? 

Thank you for joining this Forex academy educational video.

Is a war developing between China, Taiwan, and the USA?

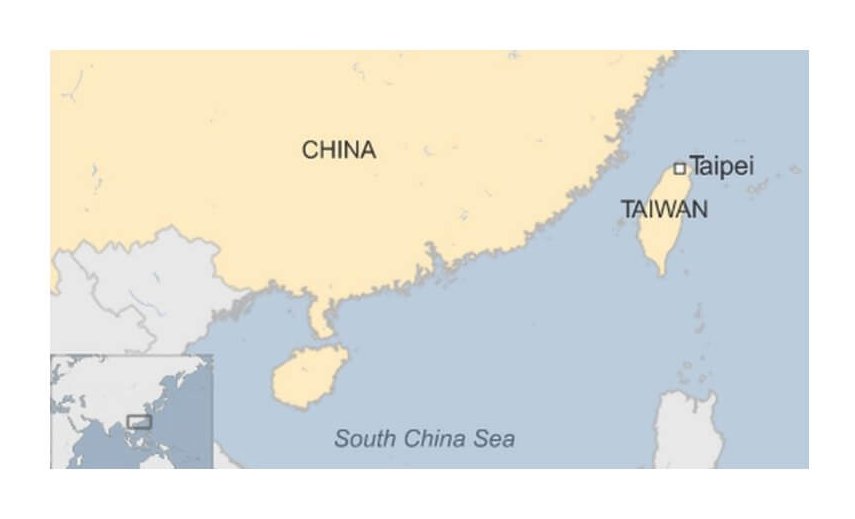
Taiwan was a Dutch colony between 1624 and 1661, having been administered by China’s Qing dynasty from 1683 to 1895. But today, China regards Taiwan as a breakaway province and says it is determined to retake it. However, Taiwan’s leaders argue that it is a sovereign state, with its constitution, democratically-elected leaders, and about 300,000 active troops in its armed forces.

China has been piling the pressure on Taiwan’s President, Tsai Ing-wen, to acknowledge the “One-China” policy since before she took over the role in 2016. 


And with the 2019-20 crisis in Hong Kong, as a result of the China / Hong Kong  National Security Law, some protesters, fearing extradition to mainland China, and facing criminal charges, have been escaping to Taiwan, many with their passports confiscated, elect to take the perilous 370-mile sea voyage to Taiwan which has promised assistance to the people of Hong Kong, thus antagonising China. 

After decades of hostility between China and Taiwan, things started improving in the 1980s, and China took advantage by putting forward a formula, known as “one country, two systems” – such as implemented in Hong Kong – and under which Taiwan would be given significant autonomy if it accepted Chinese reunification.

Also, throughout 2018, China put pressure on international companies by forcing them to list Taiwan as a part of China on their websites. Those who declined were threatened to be banned from doing business in China.

In the meantime, the US has been supporting Taiwan, much to the annoyance of the Chinese Communist Party, with Washington sending its highest-ranking politician to hold meetings on the island because what it said was an “increasing threat posed by Beijing to peace and stability in the region.” The US approved an $8 billion sale of F-16 fighter jets to Taiwan last year, taking its fleet to over 200, also angering the Chinese government.  

In a more recent development, Chinese fighter jets have been entering Taiwan’s airspace. SU-30 fighters and Y-8 transport planes have been spotted over Taiwan during September 2020, fuelling tensions in the region.     

Japan, worried about the number of US and Chinese military exercises in the region over the South China sea, see the possibility of an escalated conflict perhaps as the result of an accident.

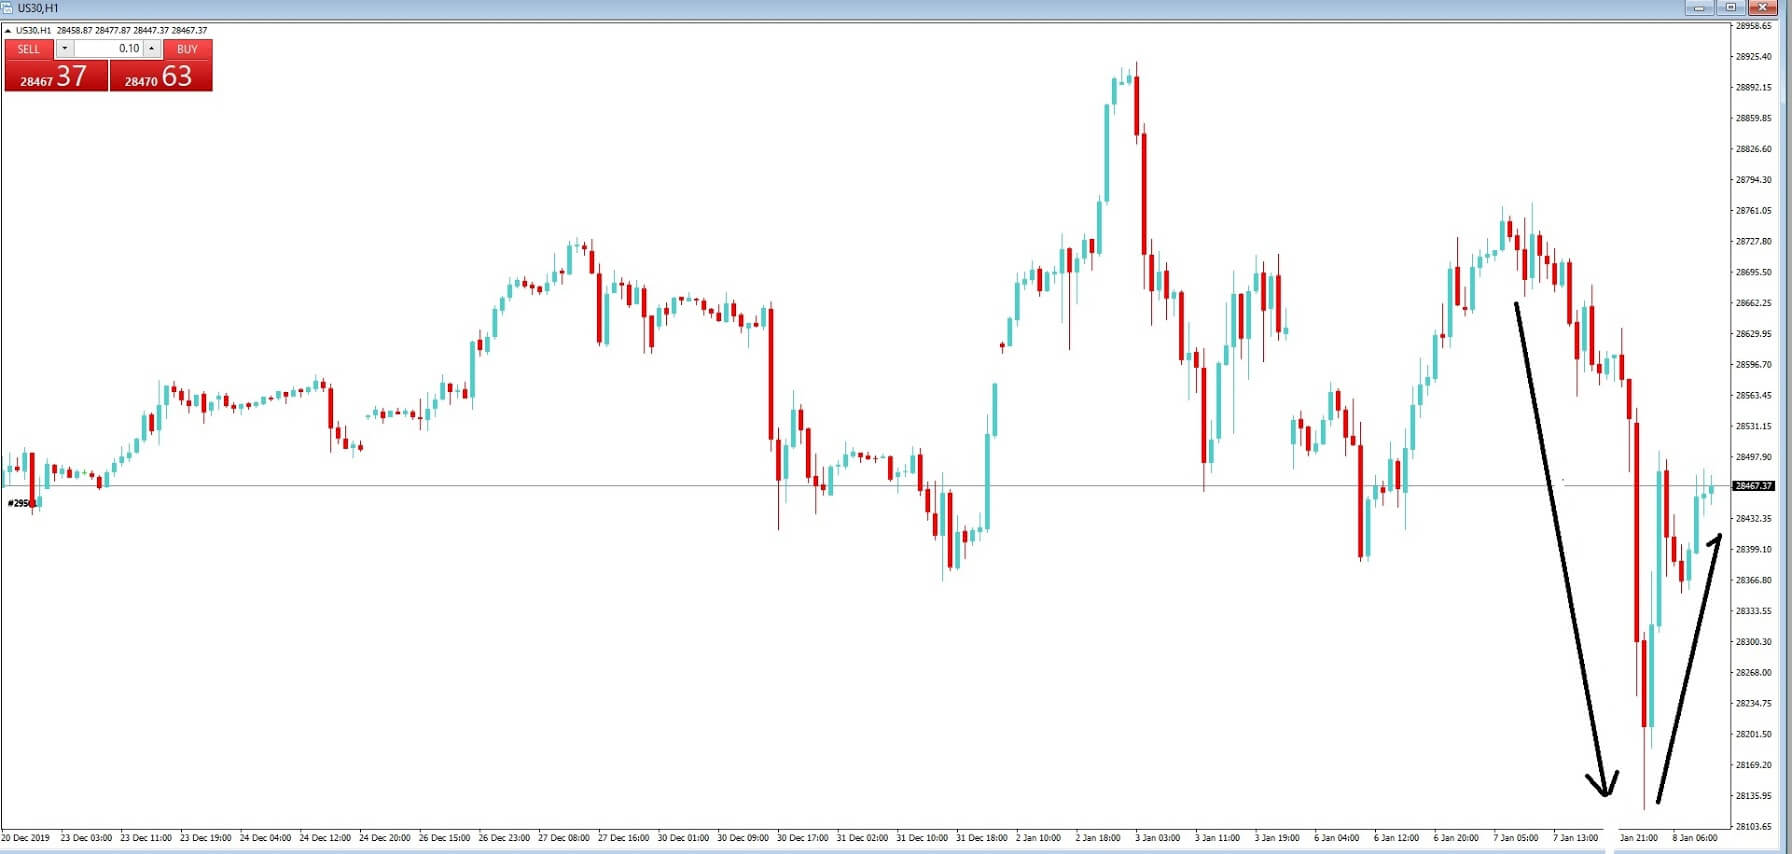
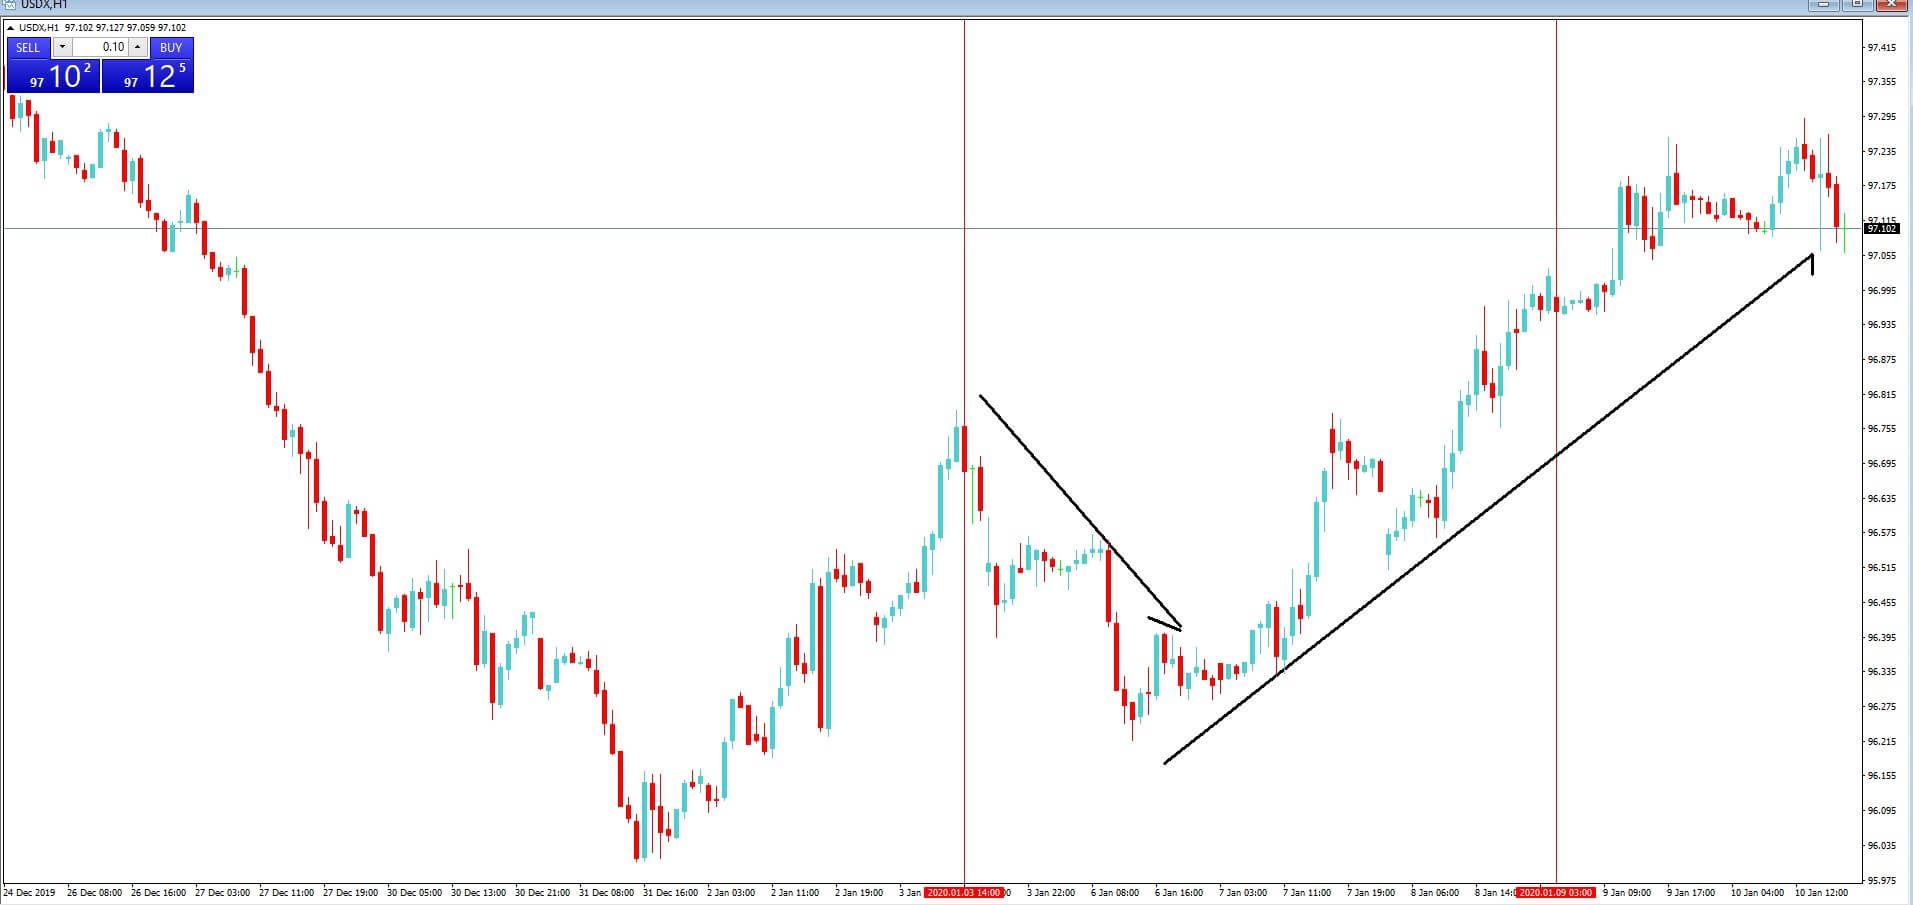
Should such a conflict between China and America occur, what might we expect from the financial markets?  Mayhem, confusion, and extreme market volatility, stock indices around the globe would fall, but especially within the United States, and we might see the Japanese yen and Swiss franc being bought as safe-haven assets.

China seems determined to retake Taiwan, as much as Taiwan appears to want to break away officially.  The Chinese government would very likely not back down, and I’ll poke a finger in the west by provoking them into military exercises while flying over Taiwan’s airspace, which China sees as its own.


This is a crisis that he’s not going to go away anytime soon.  It will undoubtedly escalate.  Traders are advised to keep an eye on the escalating conflict because it will likely lead to spikes in many asset classes.


Categories
Forex Videos

How To Trade Forex In Times Of War – Iran VS America

The brief USA and Iran conflict and how it played out in the market from the 3rd to the 9th of January 2020

It was the conflict that wasn’t. Thank God. So far, anyway. In normal times, the biggest market movers are interest rates. However, when it comes to war and conflicts, and especially where a leading country in the west is involved, nothing moves the markets more. Conflicts cause immense uncertainty in global economics. And that means one thing for investors: they will release cash by liquidating from investments such as stocks and put their money into safe-haven assets such as the Japanese yen or Swiss franc. Although these two currencies return less to the Investor due to their low-interest rates, they are seen as a safe and steady long term investments. Other safe-haven investments at such times are gold and even bitcoin in more recent times.

Indeed during this very short spat between the United States and Iran from the 3rd of January, when President Trump ordered the air-strike, which killed Iranian general Qasem Soleimani to the 7th January 2020. After Iran fired missiles at air bases in Iraq housing US soldiers, we saw a downside move in the major stock indices across the globe, and especially because President Donald Trump had threatened to target 52 sites of interest within Iran, should there be any reprisals. While the world waited with baited breath, extreme market jitters ran throughout the global markets. The US dollar also declined initially.

The oil market was affected during the initial phase because of the vast amount of oil passing through the Middle East region, en route to the rest of the globe, which would have been heavily affected by war in the region, thus sending the price of a barrel of oil to fresh highs. This move adversely affected the Canadian dollar, which moved lower against the USD and other major currencies.

Example A


Example A is of the Dow Jones 30 index, and we can see that the market initially collapsed when Iran fired the missiles to 2 US bases in Iraq, threatening an escalation of the war with the United States and Iran. However, because there was no collateral damage to American forces or their equipment, the Dow Jones quickly erased losses and indeed has subsequently rallied to record highs. This lift has been followed by global indices generally.

Example B

Example B shows a 1-hour chart of the EURUSD pair during the conflict, which, although declined during this period, heavy losses for the euro were pretty much contained in a very narrow sideways range and where the overall trend in the pair was lower prior to the event..

Example C


Example C is the US dollar index, where we can see that, after an initial slide when the Iranian general was killed, and the retaliation by Iran was not effective, and, also, the subsequent de-escalation of the tensions between Iran and the United States, investors have favored the US dollar which is broadly up against the other major currencies. The Yen also retraced its gains, and the USDJPY pair moved higher.
This event goes to show that geopolitics is as important as fundamental analysis when it comes to trading currencies. New traders are strongly advised to learn how all the markets are interwoven and how they react when major events such as wars take place.

Categories
Forex Market Analysis

U.S. Core PPI (YoY) reaching its highest level since 2012

Hot Topics:

  • S. Core PPI (YoY) reaches the highest level since 2012.
  • Volatility moves towards Europe.
  • The pound rally continues due to the weakness of the dollar.
  • Jinping reduces risks of a Trade War.
  • Oil Brent reaches the highest level since 2014.

U.S. Core PPI (YoY) reaches its highest level since 2012.

Signs of strength in the United States economic growth continue showing up. The Underlying Producer Price Index (YoY) reached 2.7% growth in March, the highest level since June 2012. The Core PPI (MoM) index, on the other hand, went up 0.3% fulfilling analysts expectations who projected 0.2%. According to the Bureau of Labor Statistics, 70% of the increase in final demand is attributed to a rise of 0.3% in the prices of final demand services, in the same way, transport and storage services for final demand increased by 0.6 %. The producers’ inflation rise is expected to have an impact on the Consumer Price Index, which will be published this Thursday.

Despite these positive macroeconomic data, the greenback index continues its strong depreciation, losing 2.83% for the year. Today the greenback is closing with a loss of -0.25%. We are paying attention to the zone between 89.15% and 61.8%  Fibonacci retracements, where the Index has found support.

Volatility moves towards Europe.

The risks of a Trade War between the United States and China are disappearing more and more, with the bilateral attempts to resolve the conflict in a friendly way. However, in Europe, the scenario that seemed full of geopolitical stability is changing. This Sunday 08th, Viktor Orban won the elections in Hungary for the fourth time in a row. With an utterly autocratic speech, the nationalist Prime Minister proposes an anti-immigrant policy and open attacks towards the European Union. Hungary refuses to comply with the agreed European migration policy, that is, to accept Syrian refugees quotas in the same way the United Kingdom did as one of its arguments for Brexit. It should be added that Mr. Orban is not alone in this political tendency; he has found allies in power in Poland, the Czech Republic, Slovakia, and Italy. All of them are willing to reject the obligation to accept refugees and respect the right of free movement.

The euro has closed with gains for the third consecutive session with an advance of 0.29%. The pair shows a bullish move in the middle of a sideways formation. In the last trading session, the price has found resistance at 61.8% of Fibonacci retracement.

The pound rally continues due to the weakness of the dollar.

The pound continues for its third consecutive session in a bullish rally advancing 0.64% for the week and gaining 0.35% in the last trading session. All this occurs in a context of a weakness of the dollar, despite the excellent macroeconomic data of the United States. The level of support to be checked is 1.4145; the key resistance level is 1.42 as a psychological level.

Jinping reduces risks of a Trade War.

Chinese President Xi Jinping has promised to reduce import tariffs by alleviating the fear generated by the escalation of bilateral tensions between the United States and China. In a speech held at the Boao Forum, President Jinping promised to open further the Chinese economy and protect the intellectual property of foreign companies. These words filled the market with optimism, leading the indexes to move positively, the Dow Jones Index advanced 1.48%, while the yen reduced its attractiveness as a refuge, leading the USD-JPY to close with 0.41% of earnings.

The USD-JPY pair is forming an ascending diagonal pattern, which still has space to rally. Its closest resistance levels are 107.49 and 108, and the main support level to watch out is 106.64.


The Dow Jones index moves within a descending channel, its price looks to control a support level at 24,037.3 and is developing a possible upward diagonal formation whose closest resistance is at 24,630, a level that coincides with the Upper part of the bearish channel. Bullish positions are valued as long as price does not break the 23,749.3 level.


Oil Brent reaches the highest level since 2014.

The euphoria produced by the reduction of the economic tensions between the United States and China due to Jinping’s latest public speeches, not only has motivated a good mood on the indices but also on oils. The Brent Crude has reached its highest level since 2014: $ 71.03. Wes Texas Crude Oil, on the other hand, approached its two-week highs at $ 65.76. The oil rally and the Dollar weakness also benefited the USD-CAD pair (by inverse correlation), which closed at its lowest levels since February, and testing the psychological level 1.26,  approaching the 61.8% Fibonacci retracement level at 1.2583.


Our central view for this highly correlated group has been bullish; but we currently prefer to maintain a neutral position considering that once oils reach specific long-term levels on their structures, they should make a significant corrective movement that will allow us to join the trend. As long as Brent does not reach the area between $ 71.26 and $ 72.91, and Crude Oil does not come close to $ 69 and $ 70, we do not expect a significative correction to begin.

In the case of the USD-CAD pair, once it reaches the base of the channel,   we expect the beginning of a bullish move.


Categories
Forex Market Analysis

The Trade War could benefit South American Producers

DAILY UPDATE

Released: 5th April 2018.

Hot Topics:

  • The trade war could benefit South American producers.
  • The unemployment rate of European Union falls to 8.5%.
  • Climatic factor impacts on March PMI Construction.
  • The Bounce of the Stock Markets Boosts the Yen’s Crosses.
  • Indices rebound driven by possible bilateral talks between the United States and China.
  • The Canadian Dollar is showing an example of the alternation rule of the Elliott Wave theory.
  • Crude Oil Production falls to its lowest level in over a year.

The Trade War Could Benefit South American Producers.

Uncertainty due to the trade war between the United States and China continues. This time China has reacted by incorporating a 25% tariff on soybeans of US origin. It should be noted that China is the primary consumer of soybeans in the world. As a result of this increase in tariffs on American soy, it is estimated that China could turn to South American producers to meet the demand for the grain. Despite this pessimism in the economic context, the Dollar Index in the hourly chart is developing an inverted Head and Shoulder pattern as a bullish continuity configuration. The next control zone is in the range of 90.20 and 90.36, in case if we do not overcome the resistance of 90.36, we could see a potential retracement to the 89.15 area.

The Unemployment Rate of European Union Falls to 8.5%

The signs of recovery in the European economy continue. The unemployment rate of the European Union has fallen to 8.5% in February, down from 8.6% in January. According to the information provided by Eurostat, the labour market in the Eurozone has reached the lowest level since December 2008. This level of optimism has not been enough to push the Euro towards new highs. The single currency is within a range between 1.225 and 1.23, from where it could create a bottom around the levels 1.2213 and 1.224. A new bullish rally could start from here.

Climatic Factor Impacts on March PMI Construction.

The PMI of the Construction sector (MoM) plummeted sharply to 47 pts, compared to the 50.9 forecast, despite the weak data. It is the lowest level since July 2016, when it reached 45.9 pts in the context of the Brexit elections (June 23, 2016). The critical factor in the decrease in activity has been the climatic factor, remember that in March the worst snowfalls in recent years were recorded. Technically the pound is developing a pattern of Head-Shoulder, which could be contained in a more extensive setup of Head-Shoulders. This could lead to sterling up to 1.3922 in the first instance, and up to 1.3737 in the second instance. All this structure could correspond to a major degree lateral structure that takes us from the 1.373 area to reach new highs around 1.45.

The Bounce of the Stock Markets Boosts the Yen’s Crosses.

Yesterday, although tensions in the dispute of tariffs between the United States and China, the Bank of Japan (BoJ) disbursed 833 billion yen (about US $ 7.8 billion) in the purchase of Exchange-Traded Funds (ETFs). This level of expenditure is the highest level since September 2017, the month in which the BoJ spent 830 billion yen. This action earned the yen to start a turn in its trend; this can be seen both in the chart of the USD-JPY and EUR-JPY which have begun to show bullish patterns. For the USD-JPY pair, the closest key resistance level is 108; in the case of the EUR-JPY cross, the control level is 131.71, a level that if exceeded could lead to the price to exceed 133.5 with a maximum extension of 134.5 in the short term.

Indices Rebound Driven by Possible Bilateral Talks Between The United States and China.

Through his Twitter account, President Trump stressed that the United States is not in a trade war with China. The Trump administration indicated that it is willing to negotiate with China on the escalation of tensions between the two countries. The most significant problem as mentioned by the American President in his account on the social network is that the deficit in the American trade balance is $500 billion, which according to his words “When you’re already $500bn DOWN, you cannot lose.” With the fears of a commercial war between the Trump administration and the administration of Jinping, the indices began to recover confidence. They realised a V-turn pattern is taking the Dow Jones to close above the 24,000 pts in a day. It started lower in the global indexes. The level of resistance to control is between 24,800 pts and 24,982 pts, an area from where in case of breaking up, could take us to levels close to 26,000 pts. The key support levels are 24,034 and 23,330 pts, which coincide with the base of a bearish channel.

The Canadian Dollar is Showing an Example of the Alternation Rule of the Elliott Wave Theory.

The Loonie has made a false rut beginning a downward cycle. It is developing a long-term bullish channel as a long-term bearish formation and is reaching a zone of 1.31 and coinciding with the upper guideline of the channel. Once started, this bearish cycle has been developing five clear movements. In this case, we will highlight the corrective formations or consolidation. According to the Elliott Wave theory, the alternating rule states that after a simple corrective structure, a complex structure should be presented and vice versa. By looking at the time chart of the USD-CAD, we can see this application. The conclusion that this case leads us to is to suspect that a recession is approaching, and that could take the price to levels around the area of the complex corrective structure and then return to develop new minimums in the long term.

Crude Oil Production Falls to Its Lowest Level in Over a Year.

The production of crude oil from the countries belonging to OPEC has fallen to the lowest level in a year and a half. This is mainly due to the problems plagued by the policy of Venezuela, where production decreased by 100,000 barrels per day since February, reaching 1.51 million barrels per day according to the survey conducted by Bloomberg News. The overall level of the output of the 14 OPEC member countries fell by 170,000 barrels to 32.04 million barrels per day in March. OPEC has helped stop production as of January 2017 with the aim of boosting the price of oil, which has been currently consolidating above $60 a barrel. Structurally in the hourly chart, we observed a Head-Shoulder formation that did not reach the technical target bouncing upwards. As long as oil does not lose levels below $60.2, the dominant trend continues to be bullish.

©Forex.Academy

Categories
Forex Market Analysis

Trump Announces He Will Impose Tariffs On Steel And Aluminium Imports

Hot Topics:

  • EURUSD – Trump announces he will impose tariffs on steel and aluminium imports.
  • AUDUSD – Australian mining companies on alert for Trump tariffs.

Main currencies daily performance.

EURUSD – Trump announces he will impose tariffs on steel and aluminium imports.

The US President Trump has announced that he will impose tariffs on steel and aluminium imports as a step to protect the US industries. The duties to apply are 25% on steel and 10% on aluminium.

China reacted immediately and warned that they would reduce the imports of US soybeans, and The European Union has said that is considering taking action too. The New York Federal Reserve President William Dudley said that “raising the trade barriers would increase the risk of a ‘trade war’, which could damage the economic growth prospects around the world.”

On the technical side, when arriving at the second support of the weekly pivot (Weekly S2 1.21550), the Euro made a perfect reverse movement climbing more than 120 pips. We expect a bullish move for the single currency that can take it up to the weekly pivot level 1.23304, where it could begin to lateralise.

AUDUSD – Australian mining companies on alert for Trump tariffs.

After President Trump’s announcement to apply tariffs to imported steel and aluminium, the biggest beneficiaries will be the US production companies, which accused China, Russia and South Korea of unfair competition. On the other hand, one of the largest Australian mining companies, Rio Tinto, which exports mainly aluminium to the United States and Canada, will be affected by this measure unless Canada can dispute an exemption to Washington.

Technically, the AUD-USD pair entered a zone of potential reversal that coincides with a long-term bullish trendline, which concurs with the second level of weekly support. A new low at the weekly S3 level (0.76286), could give more strength to a reversal pattern.


©Forex.Academy