Categories
Crypto Market Analysis

Daily Crypto Review, Dec 26 – Youtube censoring crypto-related videos; content creators have spoken

Bitcoin, along with the rest of the cryptocurrencies, didn’t move much during Christmas. The price tanked a bit due to a lack of volume, but the price drops are sporadic and negligible. Bitcoin’s price went down by 0.59% on the day. It is trading for $7,247 at the time of writing. Meanwhile, Ethereum lost 0.7%, while XRP lost 0.4%.

Tomo Chain gained 21.44% on the day, making it the biggest daily gainer. The biggest loser of the day was Silverway, which lost 7.88% of its value when compared to yesterday.

Bitcoin’s dominance gained half a percent during Christmas time. Its dominance is now at 68.7%, which represents an increase of 0.5% from when we last reported.

The cryptocurrency market capitalization lost around four billion dollars during Christmas. It is currently sitting at $191.32 billion at the time of writing. This represents a decrease of $3.69 billion when compared to the value it had 24 hours ago.

What happened in the past 24 hours

YouTube, the biggest video-sharing social media platform, has unexpectedly started to delete cryptocurrency-related content from the platform. Both big and small content creators are affected.

Countless Twitter and Reddit threads popped up, all about YouTube suddenly deleting a number of crypto-related videos Dec. 23. On top of the video deletion, YouTube sent out an official warning to content creators in the form of a “strike.” When the account gets “struck” 3 times, it gets shut down.

YouTube has yet to respond on why it censored these videos.

_______________________________________________________________________

Technical analysis

_______________________________________________________________________

Bitcoin

Bitcoin spent Christmas losing some value, but the loss is almost insignificant. Its price did fall under the 38.2% Fib retracement line of $7,260. After falling under the support level which now turned resistance, Bitcoin seems to have consolidated near the top of the range.


Bitcoin’s volume was quite low, which can be explained by the holidays. Its RSI was quite stable and around the middle of the value range.

Key levels to the upside                    Key levels to the downside

1: $7,260                                           1: $6,940

2: $7415                                            2: $6,640

3: $7,525                                           3: $6,415


Ethereum

Ethereum also spent Christmas losing some of its value. The price is still contained within the resistance of $128.1 and support of $122.5. The price is now consolidating in the middle of the range.


Ethereum’s RSI level is currently on the rise, with the volume being on the lower end of the spectrum.

Key levels to the upside                    Key levels to the downside

1: $128.1                                             1: $122.07

2: $130                                               2: $117

3: $141.15


Ripple

XRP’s broke a key support during Christmas. Its price dropped below $0.19 and could not make it back above. It is now consolidating just below this level, which currently acts as resistance. XRP has quite a free fall if it decides to drop in price. The next support level is at $0.178.


XRP’s volume is, just like Ethereum’s and Bitcoin’s, pretty low. This is, again, most likely due to fewer traders being involved with the market during the holidays. The key level of $0.19 is now acting as resistance.

Key levels to the upside                    Key levels to the downside

1: $0.19                                              1: $0.178

2: $0.198                                            2: $0.1678

3: $0.2058

Categories
Crypto Market Analysis

Crypto Analysis -Negative Sentiment Persists

Daily Update and Analysis

Bitcoin

Fundamental analysis

Bitcoin has been in a rough situation lately. With Goldman Sachs announcing that they are uncertain about Crypto trading desk, Russia still not being ready to regulate Cryptos and news of mainly neutral or bearish sentiment, we can not expect the price to do the opposite either. On the non-news fundamental side, nothing has changed. However, this is not the only thing to look at. When looking at the sentiment, we are still bearish.

Technical analysis

With the resistance downtrending line moving sharply downwards, Bitcoin only has until 20th of November to make a decision. Everything is still inclined towards the downside, but some bullish news or a sudden spike in volume might change things up. However, that is highly unlikely at this point.

Ethereum

Fundamental analysis

Ethereum is going through a horrible period. Many news are reporting that Ethereum is a bad technology, and that it is highly overpriced. However, it is one of the rare Cryptocurrencies with real use case. Still, with no changed to its code, and bad news floating around (possible forks, negative analysis), we are still inclined to look at Ethereum from a bearish perspective, and would consider a short position in this Cryptocurrency.

Technical analysis

Ethereum has been in a sharp downtrend from the start of May. With only bearish fundamental news, and no changes in the general outlook on Ethereum, we expect more downwards moves. Volume has been steady, and ETH showed no will or courage to test the resistance line.

EOS

Fundamental analysis

EOS has been marketing the product as the Cryptocurrency to solve many modern world issues, such as environmental issues, world poverty etc. EOS has quite a good buzz around it in China as well as it has been pronounced as the highest rated Cryptocurrency based on idea, application, technology and innovation. However, the general market is still bearish so the rise in price did not happen as a result of the bullish news.

Technical analysis

EOS has shown some resilience, even in this market. With many Cryptocurrencies retesting their biggest support lines, EOS is ranging between 3 big support lines. However, it is not immune to the downtrend, and is highly correlated to the Bitcoin’s price.

Final word

The last week has been, apart from the slight downswing, pretty calm. Prices have not changed a lot, nor have fundamental news affected the price of Cryptocurrencies that deserved it (both upwards and downwards).

Categories
Crypto Market Analysis

Daily Crypto Update 11.06.2018 – “Buy The Dip” May Lead To Short-Term Recovery


General Overview


Daily Cryptocurrency Tracker:

Market Cap: $297,297,869,282

24h Vol: $19,935,454,309

BTC Dominance: 38.9%

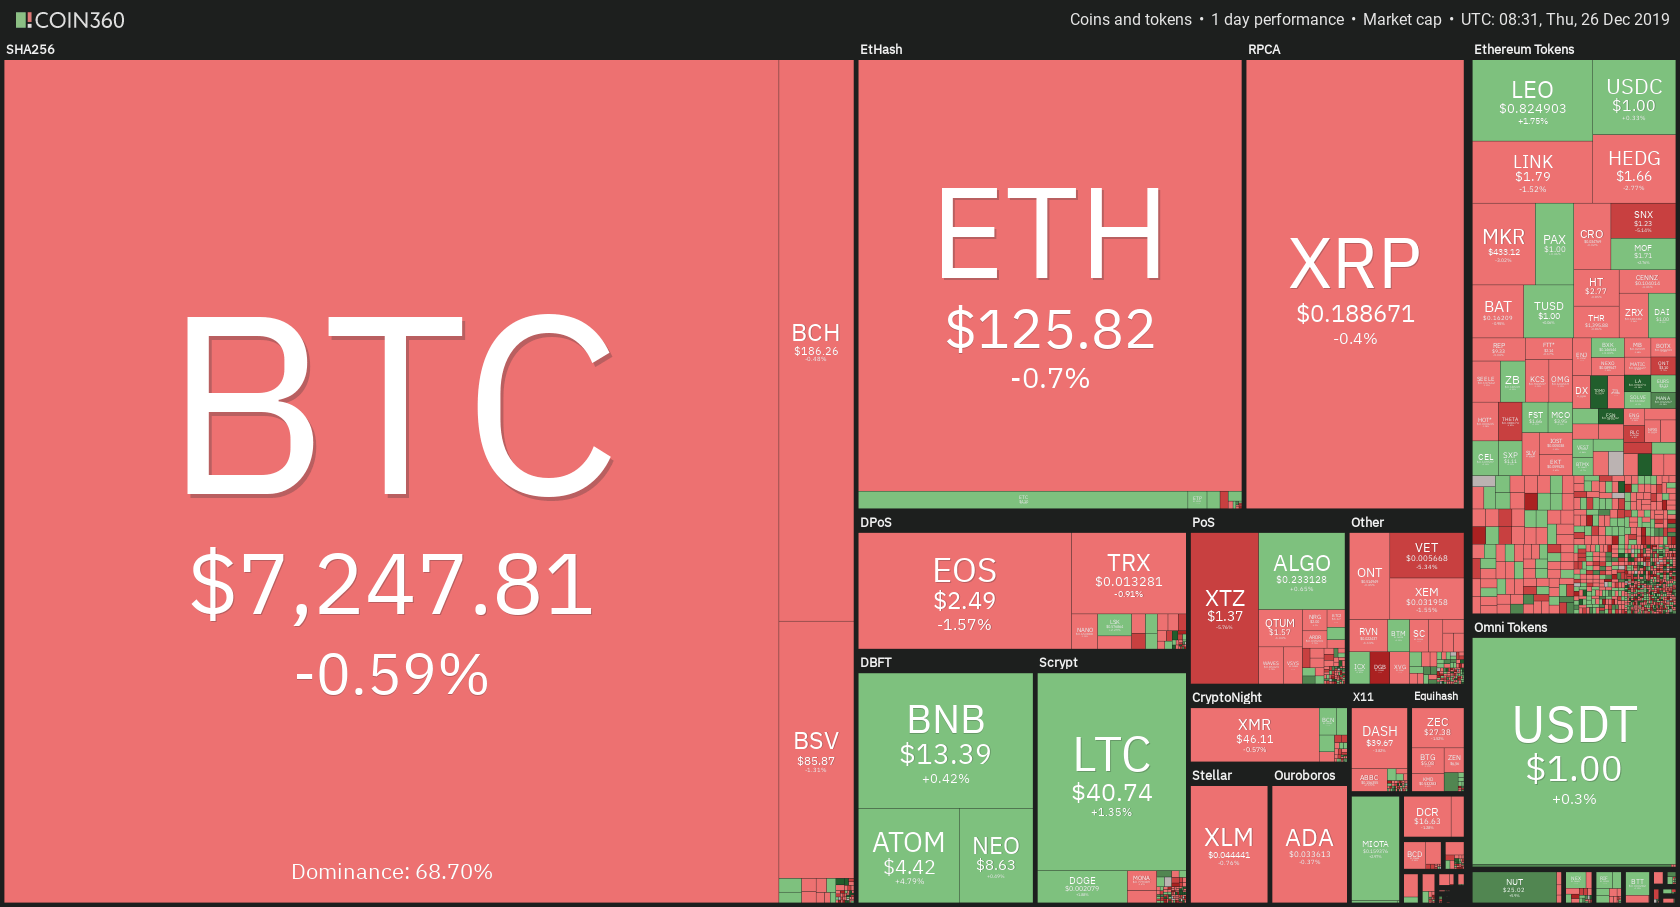
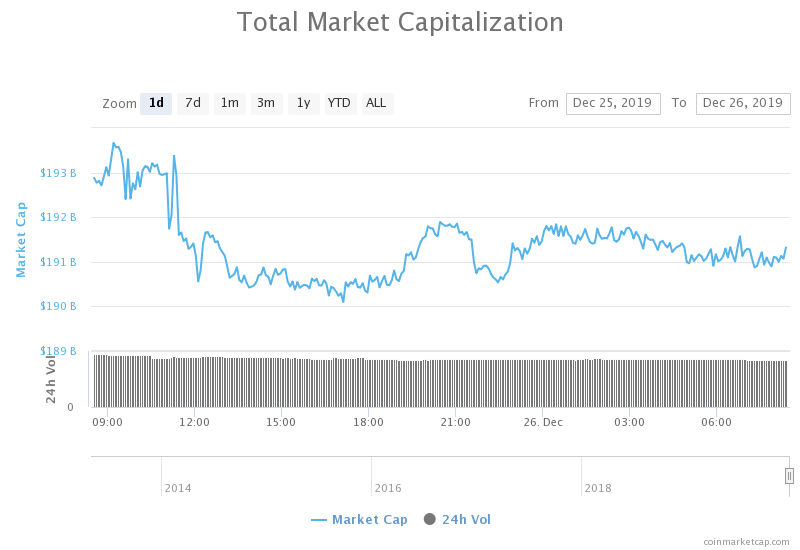
In the last 24 hours, cryptocurrency market capitalisation experienced a significant drop from yesterday’s opening at 340,435,000,000$ to 291,000,000,000$ which was today’s low so far.

Daily Cryptocurrency Tracker:The market is in red as you would presume, with an average decrease of 12% amongst the top 100 coins. Biggest losers are: Skycoin -26%, Cortex -18%, WaykiChain -24.45%, and only Veritaseum is green among top 100 with an increase of 6.19%.


News


Most significant headlines that came out in the last 24 hours are those regarding the reason why the markets are pungling hard.

On Saturday, CoinUpdates reported that a “Huge Bitcoin Whale With 94,000 BTC, Transfers Crypto Onto an Exchange, Rattling Nerves” in which they analysed using blockchain data that 8000 BTC where sent to Huobi exchange in two transactions:

Blockchain data shows that bitcoin address 1KAt6STtisWMMVo5XGdos9P7DBNNsFfjx7 accumulated more than 93,947 BTC — at one point worth more than $700 million — during a two-month period between March 25 and May 27. Since then, the wallet owner has reduced their balance by 8,000 BTC.

The post continues on by speculating to whom this address may belong as it is the “sixth-richest in the bitcoin ecosystem”, after Bitfinex, Binance, Bittrex, Huobi, and Bitstamp addresses.

China-based news outlet BABI Finance found that most of the funds appear to have been garnered from wholesale trading on over-the-counter (OTC) platforms. BABI cites an anonymous source involved with OTC cryptocurrency sales who said that the wallet belongs to a broker in Dubai acting on behalf of an unknown — perhaps institutional — buyer.

Many blamed the current dump on the fact, that another exchange, CoinRail, got hacked. According to coindesk, the crypto exchange has suffered a loss of 40 million dollars, which caused a lot of FUD (fear uncertainty and doubt). However, that can be true as this exchange is not that significant

Data from CoinMarketCap showed the platform was ranked around 90th largest around the time of the hack, with some $2 million 24-hour trading volume on the site.

According to cointelegraph “All of Top 100 Cryptocurrencies See Red Amidst CFTC Price Manipulation Probe“.

The sharp decline in cryptocurrencies’ prices takes place in the wake of the news that the US Commodity Futures Trading Commission (CFTC) has requested trading data from crypto exchanges Bitstamp, Coinbase, itBit and Kraken. These are respectively the 21st, 14th, 45th and 13th largest exchanges in the world by trade volume, according to Coinmarketcap.

This also doesn’t make sense even though those are significant exchanges with large trading volume, unlike CoinRail, but I don’t see how exchanging subpoenas for potential price can manipulate and scare investors, and push them to sell their crypto.

What is more likely is what is reported on a Coinsupdates post titled “What Caused a Flash Crypto Crash?” in which the stated reason is “Bitcoin investors in the United States are selling off their crypto to pay off capital gain tax”.

First-time investors in Bitcoin are faced with large capital gain taxes from the profit they made in 2017. Reports show that they are now selling off quickly before they file their April taxes. If an individual buy and sells Bitcoin within the same year, the person will be taxed on short-term capital gains which can be as high as 39% depending on the tax bracket. However, when a person holds on to Bitcoin for more than a year before selling, it will only be liable for what the IRS refers to as long-term capital gains. The rate for this kind of tax is significantly lower from about 15 to 23.8%.

While fundamental reasons for this sell-off are still unclear, they always tend to come after the fact as a bias justification. So as a predominantly technical analyst, I am always looking for clues that come beforehand, and the chart told me all of this throughout last week that the prices are going lower. So in my mind, there is no other reason than basic price action and human psychology.


Analysis


BTC/USD

In the last 24 hours, the price of Bitcoin has been declining steeply from 7501$ to 6675$ which is an 11% decrease and is currently up a bit, sitting at 6748$.


Looking at the hourly chart we can see the interaction with what was until now unconfirmed baseline support 2, like I had predicted in my last week’s weekly update video. If the price bounces back to the upside I am going to confirm the baseline support 2. The price is currently consolidating in a triangle. We will see what happens next. Maybe we will see another straightforward drop after the consolidation, or we may see a bounce off of the baseline support 2 and a quick recovery.


Market sentiment 

Hourly chart technicals signal a sell.

Oscillators are on neutral, and moving averages signal a strong sell.


Pivot points

S3 5199.1 
S2 6078.8 
S1 6418.4 
P 6958.5 
R1 7298.1 
R2 7838.2 
R3 8717.9

ETH/USD

From yesterday’s open at 579$, the price of Ethereum has dropped by 14% to today’s low at 503$.


As you can see from the hourly chart, the price has bounced back from those levels by 30$, off the 0.236 Fibonacci level leaving a wick below it. The price has fallen steeply to the levels of prior low, as like I’ve expected it.


Market sentiment 

Hourly chart technicals signal a sell.

Oscillators are on sell, and moving averages signal a strong one.


Pivot points

S3 343.83
S2 440.75 
S1 482.15 
P 537.67 
R1 579.07 
R2 634.59 
R3 731.51

XRP/USD

The price of Ripple decreased by almost 16% in the last 24 hours from 0.6571$, which was yesterday’s open to 0.55214$, which was today’s dip.


On the hourly chart, we can see that the price is currently sitting on the support at 0.573 and on the uptrend significant level (dotted purple line) which also served as support. So the price found some temporary support there, but we will see if that support is strong enough to stop the momentum, after which I will confirm it, as the price fell below it leaving a wick.


Market sentiment 

Ripple is in the sell zone.

Oscillators are on buy, and moving averages signal a strong sell.


Pivot points

S3 0.38312
S2 0.48954
S1 0.53503
P 0.59596
R1 0.64145
R2 0.70238
R3 0.80880


Conclusion


Daily Cryptocurrency Tracker: After the steep decline that major cryptos have experienced, today, I am expecting a recovery as there’s a “buy the dip” psychology in the cryptomarkets. Buy the dip is considered to be a good strategy in a bull market, but crypto investors are not that knowledgeable and are acting on what they hear. So after they see that they are holding heavy bags, the sell-off will continue.

Categories
Crypto Market Analysis

Daily crypto update 23.05.2018 – After a big drop, the price is struggling for support.


General overview


Market Cap: $348,018,621,395 
24h Vol: $18,262,368,943 
BTC Dominance: 38.8%

In the last 24 hours, cryptocurrency market capitalization dropped from $383B to $342B, which is a decrease of 41 billion dollars in the evaluation.

cryptocurrency market capitalization dropped from $383B to $342B

The market is currently in red, with an average decrease in the price of 10%. Biggest losers among top 100 are Verge -14,7%, 0x -14,3%, Bitcoin Diamond 15,6%, and the only one crypto that’s in green is Bitcoin Private +7%.


News


Top stories that came out in the last 24 hours are mostly about blockchain tech adoption and acceptance, however, after the big drop in the evaluation, there is much analytical news as well.

These are some of the significant headlines:

Mitsubishi, MUFG Conduct Successful Pilot Payment With Major Thai Bank’s Blockchain

Several major global banks have successfully completed a cross-border payment pilot test using Thai bank Krungsri’s (Bank of Ayudhya) Blockchain Interledger, according to a press release May 22.

Bitcoin Price Is Struggling After Blockchain Week, Possible New Regulatory Pressure

Cryptocurrencies continue to slow down today as all major coins are in the red on Tuesday. Bitcoin (BTC) price is struggling for gains above $8,500 following concerns over increased regulation according to Naeem Aslam, chief market analyst at Think Markets:

“The recent selloff has come from the news out of China that the ICO [initial coin offering] market is still very active and there are fears that China will further increase the strict regulation.”

Russian State Duma Almost Unanimously Approves First Reading of Crypto Industry Bill

Russia’s parliament the State Duma approved the first reading of new laws regulating the crypto industry Tuesday, May 22. The laws define cryptocurrencies and tokens as property, and lay out specifications for interacting with crypto and blockchain-related technologies.  

US: Crypto Could Pose a Problem for Candidates Seeking Security Clearances

The recognition of Bitcoin as a form of foreign currency could potentially have an impact on decisions in recruiting new employees to the US Department of Defence (DoD), Bloomberg reported May 22. The Pentagon’s chief concern is whether investment in cryptocurrencies indicates criminal intent or constitutes an increased predisposition toward risky personal behavior. This could detrimentally affect a job candidate’s profile should the DoD be considering them for a security clearance.

Argentinian Bank Now Using Bitcoin for Cross-Border Transactions

Argentinian Banco Masventas (BMV), has announced a partnership Bitex to enable clients to use Bitcoin for international payments as an alternative to SWIFT, according to a Facebook post May 21. Bitex is a blockchain-based financial services provider based in Latin America.

Nobel Prize Economist Says That Crypto the Latest in a Pattern of Alternative Currencies

In a May 21 article entitled “The Old Allure of New Money,” the 2013 Nobel laureate of Economics Robert Shiller calls crypto the newest iteration of alternative currency ideas.


Analysis


BTC/USD

In the last 24 hours, the price of Bitcoin has dropped by 6,7% coming from 8400$ to 7847$ where it is currently sitting.


Looking at the daily chart, we can see that the price of Bitcoin is back in the wedge pattern, as I predicted in my weekly forecast. The drop in price has to find new support, and the 0.236 Fibo level will serve as support at least temporarily, so watch out what happens at these levels.


Looking at the hourly chart we can see that last 4 candles are dojis, meaning that the price is experiencing a lot of buying and selling pressure and considering the proximity of the 0.236 Fibonacci level we can conclude that price is struggling and looking for support there.


Market sentiment

  • Bitcoin hourly chart technicals signal a sell.
  • Oscillators signal a sell and moving averages a strong one.

Pivot points

S3 6427.8 
S2 7387.3 
S1 7809.2 
P 8346.8 
R1 8768.7 
R2 9306.3
R3 10265.8

ETH/USD

From yesterday’s open the price of Ethereum has dropped by 10%, coming from 693$ to 621$ where it is currently.


On the daily chart, things are looking very bearish. The price is currently at the levels of prior resistance, looking for support, and it’s near the 0.382 Fibonacci retracement level, but we haven’t seen the interaction with it just yet.


On the hourly chart, we can see that the price is struggling for support, as indicated by the wicks we are seeing on the candles. The price is likely going to bounce back quickly after this massive and fast drop occurred, before continuing to go down further.


Market sentiment

  • Hourly chart technicals signal a sell.
  • Oscillators are on neutral, and moving averages on a strong sell.

Pivot points

S3 539.11 
S2 598.95 
S1 619.48 

P 658.79 

R1 679.32 
R2 718.63 
R3 778.47

XRP/USD

In the last 24 hours, the price of Ripple has dropped by 8,86% coming from 0,676$ to 0,617$ where it is now.


On the daily chart, we can see that the price of Ripple has fallen below the 0.236 Fibonacci level. From there on the only significant level, I see stopping this momentum is at the close of the candle before one that broke that level from the upside, which is at 0,54$.


Hourly chart shows us the interaction with the Fibo level, and as you can see it was broken with a strong momentum, and the current situation is similar to that of Bitcoin and Ethereum in a sense that there is a lot of wick on the current candles.


Market sentimet

  • Ripple is in a sell zone.
  • Oscillators are on sell, and moving averages a strong one.

Pivot points

S3 0.56621
S2 0.60802
S1 0.62285

P 0.64983

R1 0.66466
R2 0.69164
R3 0.73345

Conclusion


The price is struggling to find support after a massive and quick drop in price. I expect the prices to quickly bounce to the 0.5 levels of prior highs before another drop in price. We are going to see a lot of sideways price action today, as indecision is taking over, and reactions from participants are unclear. 

Categories
Crypto Market Analysis

Weekly Crypto Update 20.05.2018 – More Correction Coming


General Overview


Weekly Cryptocurrency Update:

Market Cap: $383,203,468,592 
24h Vol: $15,118,655,008 
BTC Dominance: 37.2%

At the start of the week on Monday 14th May, the cryptocurrency market cap evaluation was $407,285,000,000 and it soon dropped to $386,345,000,000 before it spiked up to $412,903,000,000 which was the week’s high. From Monday to Friday, the market cap has been steadily dropping and it hit $361,113,000,000 which was the week’s lowest point.

Weekly Cryptocurrency Market Cap Update

From yesterday, the evaluation has been increasing but it looks like it entered the bearish territory, judging by the spike to $383,159,000,000, and a quick drop. However, this may be a new support level, as the evaluation appears to be stabilising around these levels.


Analysis


BTC/USD

At the start of the week, the price of Bitcoin was $8700 and the only time it went higher was on the same day when it hit $8815 after a drop to $8365. It is now sitting at $8370 which is a 4.8% decrease.


Looking at the daily chart we can see that Monday’s candle was a pin bar doji which indicated stronger buying pressure than the pressure from the sellers, but the position of the candle, however, indicated more downside.

Yesterday’s candle closed as a red doji and as you can see from the wick, the price hit the 0.382 Fibonacci level and retraced since so judging by the wick there’s still a lot of selling pressure.

Today’s candle is green, which is very unusual for Sunday, as on weekends there’s a lot of selling going on. 


Market sentiment

Daily chart technical signals a strong sell.

Oscillators are on a sell and moving averages are indicating a strong sell with 13 MA’s on sell


Pivot points

S3 5360.5 
S2 7120.1 
S1 7795.5 

P 8879.7

R1 9555.1 
R2 10639.3
R3 12398.9

ETH/USD

From Monday until today, the price of Ethereum has decreased by 2.8% going from $733 to $712 where it is now sitting. The price fell even lower to $660 on Friday which is the week’s low.


On the daily chart, we can see that the candle on Monday was a pin bar doji like in the case of Bitcoin and since then, the price fell to the 0.5 Fibonacci levels, where it found support. Yesterday’s candle was a doji also like in the case of Bitcoin, and the current one is green but not higher than yesterday’s which is still a bearish sign. 


Market sentiment

Ethereum’s daily chart technicals signal a buy.

8 oscillators are on neutral and moving averages are signalling a strong buy. 


Pivot points

S3 499.01 
S2 596.73 
S1 646.17 

P 694.45 

R1 743.89 
R2 792.17 
R3 889.89

XRP/USD

From Monday’s open until today, the price of Ripple has declined by 5.82% going from $0.73 to $0.688 where it is currently sitting. The price went down further on Friday to $0.645, but since then, it has been steadily rising to the levels on where it is currently.


Looking at the daily chart we can see that Monday’s candle was a pin bar doji like in the case of Bitcoin and Ethereum, but the correlation doesn’t end there as we can see that yesterday’s candle was a doji also, like it was on the BTC and ETH daily charts. 


Market sentiment

Ripple is still in the sell zone, as daily chart technicals signal a sell.

Oscillators are;- 3 on sell and 8 on neutral, but moving averages signal a strong sell with 12 on sell.


Pivot points

S3 0.48085
S2 0.58545
S1 0.63011

P 0.69005

R1 0.73471
R2 0.79465
R3 0.89925

LTC/USD

Overall this week, Litecoin has decreased by 3.38% from $144 on Monday’s opening to $139.2 where it is today. The price went higher than it was on the opening to $151 on Monday, and it was lower than today’s (Friday), to $129 which was the week’s low.


Looking at the daily chart we can see that the price of Litecoin is currently interacting with the 0.236 Fibonacci retracement level which serves as resistance. On Monday there was great indecision which can be seen on Monday’s candle wicks. On Wednesday we had a pin bar doji that closed above the Fibonacci level which indicated buying pressure, but as you can see the buyers failed to push the price higher, and the sellers were stronger so the price fell below the Fibo level on the next day. 


Market sentiment

Daily chart technicals signal a sell.

Oscillators signal a sell, and moving averages a strong one.


Pivot points

S3 90.493 
S2 114.733 
S1 124.937

P 138.973

R1 149.177
R2 163.213
R3 187.453

Conclusion


Weekly Cryptocurrency Update: I don’t believe that the corrective move is over. The prices of four major cryptocurrencies failed to exceed prior highs even though we are experiencing a move to the upside in the last couple of days. I think we are in for another low.

Weekly Cryptocurrency Update

This will correspond with a retest of prior resistance for support which is around $333B.

For more information about what’s likely coming in the following week make sure you watch the substitutionary video in which I provide a forecast and reasons why I believe there’s another low coming.


Categories
Forex Market Analysis

EUR Moving Sideways, UK PMI Services Rebound, and DAX Bearish

Hot Topics:

  • UK PMI Services rebound from the lowest level for 21 months.
  • DAX is moving bearish as commented previously.
  • The Euro stagnates while waiting for employment data release of the United States.
  • EURCAD: Follow-up of the bearish cycle continuation.

UK PMI Services rebound from the lowest level for 21 months.

Business activity in the United Kingdom increased modestly in April reaching 52.8, bouncing from 51.7, the lowest level recorded 21 months ago. Chris Williamson, Chief Business Economist at IHS Markit, noted that “The economic growth rate remained decelerated moderately at the start of the second quarter.” Finally, he added that “the performance of the economy has continued to deteriorate”.

The FTSE 100 index has reacted downwards from our potential reversal zone, breaking down the rising wedge pattern, where we are already positioned short (Suggested in advance to our premium members).

The pound continues with the bearish bias consolidating below 1.36. We still expect sterling to make a new low in the area from 1.35 to 1.3481. The level of invalidation of the bearish bias is above 1.365.

DAX is moving bearish as commented previously.

The DAX 30 follows the bearish bias in a similar way the FTSE 100 did. This corrective move was also commented to our subscribers in our previous updates. We expect the German index to move down to the 12.622 pivot level, which by traditional technical analysis, should switch from resistance to support.

The Euro stagnates while waiting for employment data release of the United States.

The single currency is moving in a range between 1.195 and 1.20 pending the employment data that will be published tomorrow by the U.S. Bureau of Labour Statistics. The EURUSD pair could make a new lower low, likely near to 1.190, from where it could bounce up to 1.207.

The USDCHF is forming a double top pattern, which would be activated if it breaks below 0.995. By inverse correlation with the EURUSD pair, and considering that it still has space to make a new lower low, the Swiss currency could make a higher move as a buyer trap or 2B Pattern.

EURCAD: Follow-up of the bearish cycle continuation.

On April 20th we commented to our subscribers that the cross EURCAD had a new lower low to develop, whose target could be in the area from 1.54 to 1.5310. Today, we see that the cross has reached our forecasted area. Now we should start to take profits and wait for the price action to show a new trading opportunity.

EURCAD updated:

©Forex.Academy

Categories
Forex Market Analysis

Weekly Update:markets on a positive evolution

Weekly Update / April 23rd – 27th

Macroeconomic Outlook

Last week closed positively since both indexes closed positively due mainly to:

  • Strong Quarterly Results from companies
  • Less relevance in regards to the risk factors that have been influencing the markets lately
Geopolitical tension has been reduced from:
  • That punctual attach from the USA over Syria
  • New tariff barriers have not been announced from both USA & China
  • The Technology sector has recovered following Netflix results

The increase in commodity prices which has induced a drop in bond prices

  • 7/8 basis points increased in both American and German bonds

We expect that markets to continue with a positive evolution from the past two weeks

  • Mainly because of a smaller relevance of geopolitical risks and more focus on the macroeconomics and business results
Macroeconomic Data
  • We do not expect them to be outstanding but solid enough to favour the financial markets
  • Relevant Macro Data

o   Consumer Confidence in USA

o   Business & Consumer Confidence + PMIs in the Eurozone

  • Will follow the trend from recent weeks

o   Won’t touch the highs attained during this year, but data will remain within fairy good levels which will confirm the expansive economic cycle that both USA and the Eurozone are enjoying.

o   USA GDP / Previous – 2.9% – Forecast – 2.2%

  • Normal to be weaker in the first trimester in USA and then recovers in the second one
  • Not a brilliant macro but good enough not to damage the markets

o   ECB Meeting on Thursday

  • Draghi will keep its expansive monetary policy due to
  • Protectionism
  • Strengthening from the Euro against the US Dollar
  • Triple P Strategy in a monetary policy that is giving good results
  • Persistent
  • Patient
  • Prudent
  • Hence, the macro environment can be a support for the upswing in financial markets along with the positive quarterly results reported from companies

o   Companies that have reported results from the S&P 500 so far have announced an increase in the profit per share of 18 %, higher than the 17% expected

o   Solid outlook from the biggest American banks last week

o   We expect this positive climate to hold this week

  • In USA big technologies company such as Alphabet, Google, Amazon or Facebook among others report results this week
  • Good results are expected

In summary, geopolitical risks (protectionism, trade wards…) cannot be forgotten. However, they hold less importance and focus this week on the good business results.  That will confirm the validity of the current cycle of economic expansion and will offer support for prices so that markets may remain in the bullish trend of the last weeks.


Technical Outlook

USD Index

Daily Chart

It is possible to appreciate how the USD Index is not only below the 200 EMA but also broke below the weekly support that has been retesting in the recent weeks and which has not been successful so far. In the short term is facing a bearish trend line caused by its recent devaluation.

It did not break the support which has been holding on for weeks, and now it is facing the key moment between a strong support and a strong resistance. We don’t mind where it breaks this week.  We’ll wait for a retest for confirmation.

USDJPY

Daily Chart

Moving into the USDJPY, it has just bounced from a monthly bullish trend after doing a fake breakout and consequently bouncing back. A bullish trend could be considered since there are not big resistances ahead except its 200 EMA and the recent bearish monthly trend. In the short term, there are two resistances not very strong but that may cause a small retracement. However, the monthly support is stronger than the resistance it is locked up between.

This week it opened on the edge right below the resistance, so a close on Monday above it may confirm the bullish trend line.


GBPUSD

Daily Chart

GBPUSD has taken a strong change of direction. From breaking up the resistance and having a clear path upwards to heavily break the support that once was a resistance, and opening the chance for a bearish trend. We´ll wait for a retest as confirmation of the downturn.

Crude Oil

Daily Chart

Recent political events, like the recent missile attack to Syria, have created volatility in the markets and consequently, the price of oil has been on the rise. After holding to the trend line and breaking above $65 it is possible to see a retest of the recent resistances it just broke above. Without more resistances ahead, our analysis hint for the next target at $70 per barrel.

So, as expected, on Tuesday it retested both supports it previously broke. Firstly, with the daily low it retested the down trend support and with the closing price second one. Here, it confirms the retest and instantly goes up leaving the door open to $70.

DAX

Daily Chart

Regarding technical, it just broke the resistance it was holding it from weeks. Now, after a clear retest, a bullish position can be taken.


© Forex.Academy


Categories
Crypto Market Analysis

Pressure From Both Sides

General overview

Market Cap: $359,246,046,514

24h Vol: $22,391,963,491

BTC Dominance: 39.1%

In the last 24 hours cryptocurrency market capitalization increased by around 20B.

cryptocurrency market capitalization - forex academy

News

There is no significant news to justify this increase in market cap. Dominant headlines are regarding exchanges

South Korean Crypto Exchange Bithumb To Issue its Own Token In Singapore

Bithumb, South Korea’s leading cryptocurrency exchange, has recently revealed plans to issue its own token, Bithumb Coin, in an Initial Coin Offering (ICO), local news outlet TokenPost reports Thursday, April 19.

Source: Helen Partz, April 19. cointelegraph.com

Decentralized Exchanges, Off-Chain Atomic Swaps, And A Brief Look Into The Future

For an economy that emphasizes decentralization, cryptocurrency has ironically relied primarily on centralized platforms of exchange. This is problematic as they often hold funds in giant “honeypot” addresses that attract sophisticated attackers. This has resulted in several cases where exchange funds have been drained. In fact, there were two in the past 3 months alone! Bitgrail reported on Feb.12 that over $170 mln in XRB was stolen from their wallets. Coincheck suffered one of the largest losses ever with over $400 mln in NEM being stolen.

Source: guest author, April 19. cointelegraph.com

Crypto Exchange CEO Runs For Mayor Of Taipei To Make It Asia’s ‘Pioneer Blockchain City’

CEO of major over-the-counter (OTC) crypto exchange OTCBTC and Facebook hackathon winner Yi-Ting Cheng (better known as xdite) has announced that she is running for mayor of the Taiwanese capital city Taipei this year, according to Cheng’s Facebook post on April 14.

Source: Molly Jane Zuckerman, April 19. cointelegraph.com

Chilean Banks vs. Crypto Exchanges: Will Citizens Have Access to Technology?

Earlier this week, a group of cryptocurrency exchanges in Chile applied to the courts to fight the decision of banks to shut down their bank accounts. The exchanges, including Buda, Orionx, and CryptoMarket (CryptoMKT), state that the banking system in Chile is taking matters into their own hands and that they are “killing the entire industry.”

Source: Darryn Pollock, April 20. cointelegraph.com

Analysis

BTC/USD

BTC/USD - pressure from both sides

In the last 24 hours, the price of Bitcoin went from 8146$ to 8366$ and has retraced since, to 8280 where is now sitting. Looking at the daily chart, we can see that the price is held by 50-day EMA. The  created a doji candle for now.

Bitcoin is positiveThe current market sentiment for Bitcoin is positive, meaning 70% out of 85 mentions in total are positive.
Source: sentimen.io

short-term support line BTCUSD

Zooming into the hourly chart, we can see the pressure from both sides. The price is above the short-term support line, but it has been repealed again at the same levels.

Overall, hourly chart signals a buy

hourly chart signals a buy Pivot points:

S3 4361.0
S2 5990.0
S1 6997.9
P 7619.0
R1 8626.9
R2 9248.0
R3 10877.0

ETH/USD

ETHUSD

In the last 24 hours price of Ether was increased by 8,57%, rising from 521$ to 566$ where it is now. On the daily chart, you can see that, similar to Bitcoin, the 50 day EMA is in combination with 1,414 Fibo level are repealing the price. But there is buying pressure also, which is creating a doji candle.

Ethereum is positive, meaning 78% out of total 97 mentionsThe current market sentiment for Ethereum is positive, meaning 78% out of total 97 mentions are positive.

Source: sentimen.io

ETHUSD chart

Looking at the hourly chart, we can see that the price was broken down from this upward channel with strong momentum, but has now bounced back off at the Fibo levels.

Overall hourly chart signals a buy.

XRP/USD

 Pivot points:

S3 183.46
S2 327.57
S1 415.01
P 471.68
R1 559.12
R2 615.79
R3 759.90

XRP/USD

XRPUSD-D-4

Ripple has been rising with strong momentum in the last 24 hours and has increased by 16,5%, coming from 0,7$ to 0,83$. Looking at the daily chart, we can see that momentum is slowing down by the 100% Fibonacci level, which is the top of the prior range.

The current market sentiment for Ripple is slightly positive, meaning 69% of 42 mentions in total are positiveThe current market sentiment for Ripple is slightly positive, meaning 69% of 42 mentions in total are positive.
Source: sentiment.io

interaction between the Fibo level

Looking at the hourly chart, we can observe the interaction between the Fibo level and how the price quickly bounced.

Overall, hourly chart signals a buy.

hourly chart signals Pivot points:

S3 0.13715
S2 0.37215
S1 0.50608
P 0.60715
R1 0.74108
R2 0.84215
R3 1.07715


Conclusion

After a powerful bull run market experienced in the past couple of days, the first firm resistance is found. Three coins that we are covering in this report are all currently held at Fibonacci significant levels, and their price has been pushed from both sides. Who will win, bulls or the bears, we will see by the end of the day.

Categories
Forex Market Analysis

Tit-for-tat weighs heavy on the markets

A difficult week

It has been another difficult week in the markets, and this has been primarily down to the difficulty in assessing what the trade standoff between the US and China mean for the markets. The week started off with the market taking fright as additional tariff threats were voiced by the US, leading to a sharp sell-off in equity markets. However, much of that rhetoric was rowed back on leading to a significant bounce back actually making pre-fright highs before the SP500 started to sell off again.  This simply means that there is no overriding directional bias in either direction making this market very choppy and difficult to trade.


Gold

As a result, the Gold market responded by initially strengthening due to the fear related to the equity story but then reversed those initial gains and now trades right in the middle of significant support and resistance levels which can be clearly seen from the chart below, these significant levels are $1,357 and $1,310, so all eyes will be on these levels over the coming days and weeks to see what is next for the yellow metal.

Oil

The Crude-Oil market responded to these major global developments by initially selling off but then after seeing a bit of erratic price action we continued to see a continuation to the down side, closing the week below the $62 level.  However, from a technical perspective, the situation regarding the crude oil market is an interesting one.  We can see from the chart below that we have been in a consistent up trend since mid-June 2017, reaching a high of $66 towards the end of Jan 2018.  Since this time, this market has clearly struggled to break the $66, creating a double top end of March.  So over the last two weeks, this market has bounced back to its lower trend line.  The next few days will be interesting to see whether the support level holds and we see another attack at the $66 level or will this support level break, and we see prices pushing down to a potential structural failure below the $60 level which would put major pressure on this market to the downside.  At this crucial point, it’s hard to see whether buyers or sellers will win out.


So just to recap, over the course of the last 5 trading days, US officials made very strong statements about the need for trade tariffs to be introduced only for US officials to then row back on some of its rhetoric, as a result, market nerves were calmed, and Monday’s fear related move was subsequently reversed. The S&P rallied and then retraced, and the gold and crude oil markets came off.

US Dollar

The USD, however, has been impacted by recent events but to a lesser degree. As you can see, from the chart below, the dollar index has been in a period of consolidation since mid-Jan.  These, unfortunately, for the time being, are the market conditions in which we are trading the USD. The two major prices to keep an eye out for over the coming days and weeks is the 99.880 to the up side and 88.416 to the down side.  A move in either direction would be significant for this market.


EURUSD

EURUSD continues to trade within a range. Today’s weaker NFP numbers perhaps suggest that the pair might move higher next week given the fact too that from a technical perspective, the pair is trading closer to the lower end of its range as can be seen from the chart below.


USDJPY

USDJPY has been firmer this week, however, watch the key pivotal resistance area next week around 108.20. This was the breach that confirmed a bearish range breakout back in February.


The US Dollar paired earlier gains during Friday’s London session after data showed the US economy adding new jobs at less than half the pace economists had expected for the March month. The important Non-Farm Payrolls figure grew by just 103,000 during the recent month, which is down from 313,000 in February and far below the economist consensus for a reading of 188,000.

Separately, the unemployment rate held steady at 4.1% for the month when markets had been looking for a 10-basis point fall to 4.0%. Household incomes grew by 0.3% during the recent month, which is up from the 0.1% seen in February and in line with the consensus forecast of economists.


Price action largely noted limited volume in the week leading up the non-farm payroll figure but saw initial volatile swings before the USD began to weaken over the course of Friday afternoon and evening.

Trade of the week – Long GBP/USD

With the US caught up with trade issues with China causing confusion among other countries and added uncertainty across the US Dollar Forex Pairs, perhaps the best technical trade may look GBP support with better than forecast UK economic data.

With the GBP showing strength over the USD in April for the last 13 consecutive years running, speculators are now looking at this trend for the best potential buying opportunity. With good news for the pound with UK PMI slightly higher than expectations, Friday trading is seeing the pound trade up with a touch and bounce from the greater bullish trendline of 2017. The discussion now seems to favour the pound is seemingly defying the expectations of Brexit doom.


Categories
Crypto Market Analysis

BTC Testing a Dynamic Inflection Point

BTC

The price of Bitcoin reports an increase of 3.80% in the last 24 hours, moving above 7000 USD. The price of Bitcoin still couldn’t overcome a resistance around the 7110 level and is moving within a bearish channel in the 4-hour chart. However, the price bounced off the centerline of the channel and could be due to an imminent setback. The price crossed up the downtrend line in the short term to indicate a rebound in the upward pressure.

100-period Moving Average

The 100 period Simple Moving average is below the 200 Simple Moving average; it indicates that the path of least resistance is Bearish and also that sales can be resumed more easily than purchases.

BTC price is currently testing the dynamic inflection point of its 100 SMA, and if it remains as resistance, the BitCoin could make another visit to its nearest support or move to the bottom of this descending channel. Its 200-SMA line is quite close to the top of the channel, around $ 7,500, and is gaining strength as a hard resistance for the price.

Stochastics

The stochastic is bouncing off its 20 level even without showing buying pressure and quite hesitant at this time, which also indicates that the price of bitcoin could go down. The oscillator has grounds to move down before reaching oversold levels, which suggests that sellers could maintain control for a longer time.

Bitcoin ended the previous quarter with a significant decline in its price, thanks to a series of negative news at the end of the month. These include Google’s plans to ban cryptocurrency ads from its search engine and Twitter’s decision to ban ICO ads as well.

Meanwhile, the Dollar managed to stay supported by the risk flows derived from the concerns of the commercial war and the increase in interest rates of the Federal Reserve. The main catalyst for the Dollar this week is the NFP on Friday and pessimistic results could further reduce the adjustment expectations.

With that, investors could continue to wait for positive reports from the cryptocurrency industry to see if Bitcoin price could be able to stop its fall

Headlines have not been so upbeat, with countries like Chile and Kazakhstan taking adverse decisions against cryptocurrencies, and help keeping regulatory fears in play.

ETH

The Ethereum price reports an increase of 3.15% but it has not been enough for the price to reach the resistance near the level of USD 390.

The price of ETH reached a new low in the day in $ 360 to find then a buyer impulse that led the currency to touch the resistance again in the 390 The pair is trying to cross the bearish trend line near the $386, if the cross is confirmed, it could move above the resistance zone of $ 390-for an upward correction in the short term.

However, there are many upside barriers close to the mentioned resistance level at $ 390. The price is not too strong for now and could be going back looking for the minimums. Still, we must be alert to a close above the 100-period EMA in the 1-hour chart that can lead the coin up to $407 and then to $418 in the short term.

Its Stochastics is moving below the 80 level and looks quite weak and indecisive; the 200 and 100-period EMAS are quite separated which indicates weakness and indecision in the pair.

BCH

The price of Bitcoin Cash had an increase of 2.69%, moving the price to $ 680.

The pair is under a lot of pressure and trades below the $ 700 level against the US dollar. The pair crossed the bearish trend line near $660 that is now an important support. Apparently, it has been gaining strength in the last few hours and is looking for the 100-period EMA in the 1 H chart, very close to 700 USD. If it crosses this level, we will be possibly seeing a new rising wave in the short term.If the price can’t cross this resistance in the 700 USD, we could possibly see a rebound towards $662 and below in the $624 (minimum of April 1st).


Categories
Forex Market Analysis

Trump Announces He Will Impose Tariffs On Steel And Aluminium Imports

Hot Topics:

  • EURUSD – Trump announces he will impose tariffs on steel and aluminium imports.
  • AUDUSD – Australian mining companies on alert for Trump tariffs.

Main currencies daily performance.

EURUSD – Trump announces he will impose tariffs on steel and aluminium imports.

The US President Trump has announced that he will impose tariffs on steel and aluminium imports as a step to protect the US industries. The duties to apply are 25% on steel and 10% on aluminium.

China reacted immediately and warned that they would reduce the imports of US soybeans, and The European Union has said that is considering taking action too. The New York Federal Reserve President William Dudley said that “raising the trade barriers would increase the risk of a ‘trade war’, which could damage the economic growth prospects around the world.”

On the technical side, when arriving at the second support of the weekly pivot (Weekly S2 1.21550), the Euro made a perfect reverse movement climbing more than 120 pips. We expect a bullish move for the single currency that can take it up to the weekly pivot level 1.23304, where it could begin to lateralise.

AUDUSD – Australian mining companies on alert for Trump tariffs.

After President Trump’s announcement to apply tariffs to imported steel and aluminium, the biggest beneficiaries will be the US production companies, which accused China, Russia and South Korea of unfair competition. On the other hand, one of the largest Australian mining companies, Rio Tinto, which exports mainly aluminium to the United States and Canada, will be affected by this measure unless Canada can dispute an exemption to Washington.

Technically, the AUD-USD pair entered a zone of potential reversal that coincides with a long-term bullish trendline, which concurs with the second level of weekly support. A new low at the weekly S3 level (0.76286), could give more strength to a reversal pattern.


©Forex.Academy