Categories
Crypto Market Analysis

Weekly Crypto Update 07.02.2018 – The Recovery Has Started


General Overview


Crypto Coin Market Cap: $270,492,089,135

24h Vol: $16,547,075,818

BTC Dominance: 42.3%

Last Monday on 25th of June, cryptocurrency market capitalisation was 258,924,000,000$ at it’s highest point. Since then, the market cap fell all the way to 232,613,000,000$ on Friday 29. On Saturday the evaluation rose from those levels back to the levels of Monday’s open, and now we are seeing a breakout as the evaluation exceeds Monday’s around $258B. Because the global chart is lagging behind a bit, I have drawn with a brush were the chart should be at the moment.

Crypto Coin Market Cap Chart

The market is in the green at the moment. Biggest gainers so far among top 100 coins are: Neo 16%, 0x 18.56%, Verge 18.3%, Wanchain 15%. The average percentage increase is around 6% but there are a lot of coins that have gained 10% or more in the lasts 24 hours, which is a sign of recovery.


News


There are a number of significant news items that came out in the last 7 days. Out of those that could impact the market I point out the following:

Facebook will no longer ban crypto ads, but ICOs are still on the blacklist and only verified accounts can post them, according to their announcement. This headline is good, as Facebook ads will help expose the market, however, if they are in control of the type of projects they are going to allow or particular cryptocurrencies, Facebook will have control of the content displayed to the users, and they could, in fact, help manipulate that market, or create a general impression that is aligned with their agenda around a particular coin or project. For example, I don’t believe that they are going to allow promoting Steemit which is a blockchain based social media rival that pays out their users with their native coin. But we are yet to see what happens, as the pressure is applied on to major players but the technological advancements of the blockchain.

Other significant headlines that could impact the market as they bring more exposure and open up the space for new participants are that Binance launches a crypto-fiat exchange in Uganda– Binance Uganda, as reported by cointelegraph. This will bring more cryptocurrency exposure to the retail investors.

On the other hand Blockchain.com – the best-known crypto wallet and blockchain explorer data service has introduced their institutional platform, Blockchain Principle Strategies (BPS). BPS will offer over-the-counter services managed by experts from Goldman Sachs, JP Morgan, and UBS as part of the platform.


Analysis


BTC/USD

From last Monday, the price of Bitcoin has increased by 5.13% coming from 6282$ to the low at 5800$ at its lowest point back to 6443$ and now above the level of last Monday’s open at 6618$.


Looking at the hourly chart, we can see that the price has found support on the unconfirmed triangle support, and broken the downtrends resistance line as it’s heading in an upward trajectory. The first target I am looking at is an unconfirmed baseline support 2 (purple dotted line) at 7054$. I am expecting the first significant resistance from there to 7320$ area, and if the price gets passed through that resistance I am expecting the price to go to around 8000$.


Market sentiment

Daily chart technicals signal a sell.

Oscillators are on neutral and moving averages signal a sell.


Pivot points 

S3 4649.7 
S2 5440.2 
S1 5915.8 
P 6230.7
R1 6706.3 
R2 7021.2
R3 7811.7

ETH/USD

From last Monday’s opening at 451$, the price of Ethereum has increased by 5.34% as its currently sitting around 475$.


On the daily chart, we can see that the correction has ended and it was a WXY correction just like I pointed out it would most likely be in the charting section last week. I have pointed out that this correction might make another low and be complete as a WXYXZ sideways correction but that from those levels around 400$ the price is going up soon. Currently, the price has broken the downtrends resistance line and is heading upward steeply after consolidating in a descending channel.


Market sentiment 

Ethereum is in the sell zone, as indicated by daily chart technicals.

Oscillators are on neutral, and moving averages signal a strong sell.


Pivot points

S3 303.76 
S2 374.27 
S1 414.06 
P 444.78 
R1 484.57 
R2 515.29 
R3 585.80

LTC/USD

In the last 7 days, the price of Litecoin has risen by 5.42% from the opening on last Monday at 81.5$ to 85.8$ where it is currently sitting.


The price of Litecoin has found support at around the 72$ level, which is the level from where the price went on to create the all-time high.  Today the price has broken the downtrends resistance line and is in an upward trajectory. Like in the case of Bitcoin, I am expecting this upward movement to be the final wave Z from the WXYXZ correction from which the price is heading lower afterwards. Some of the significant level to look out for in the following week is from 111$ to 124$ which was considers as a support area, and probably now serves as strong resistance, so I will be closely monitoring what happens at those levels because I am expecting the price to go higher than 124$.


Market sentiment

Litecoin is in the sell zone as indicated by daily chart technicals.

Oscillators are on neutral and moving averages signal a strong sell.


Pivot points

S3 55.377 
S2 67.393 
S1 74.299 
P 79.409 
R1 86.315
R2 91.425 
R3 103.441

NEO/USD

The price of Neo has increased by 15.38% coming from 31.6$ last Monday to 36.42$ where it is currently.


Looking at the Neo daily chart we can spot the similarities between the current candle formation and the last time the price of Neo has recovered from its lowest. As I have measured with the Fibonacci retracement tool, last time the price recovered to the 0.5 Fibonacci level, and I have projected the same recovery this time which fits perfectly with the potential interaction with the uptrend baseline support that was broken. In price terms, I am expecting the price of Neo to rise to around 56.89$.


Market sentiment

Neo is in the sell zone as the daily chart technicals indicate.


Pivot points

S3 16.25 
S2 23.49 
S1 27.20 
P 30.73 
R1 34.44 
R2 37.97 
R3 45.21

DASH/USD

From last Monday’s open at 238.9$, the price of Dash has increased by 5.46% as its currently sitting at 250.8$.


Looking at the daily chart we can see that like in the case of other cryptos that are covered in this report, the price has broken the downtrends resistance line and is heading upward. I have labelled this correction as WXYXZ and as you can see it has ended. I have projected that the price is mostly going to recover to the 384$ as that is the half of the range from the last retracement, much like it did two prior times.


Market sentiment

Dash is in the sell zone, as indicated by daily chart technicals.


Pivot points

S3 155.17
S2 195.52
S1 217.44
P 235.88
R1 257.79
R2 276.23
R3 316.58

ADA/USD

From last Monday’s open at 0.135$, the price of Cardano has increased by 11.42% as its sitting around 0.151$.


As you can see from the daily chart, the 5 wave move down has ended, and the price is now starting to recover in an upward movement after it broke the downtrends resistance. I am expecting the price to go up to 0.23$ where the first major resistance line is and corresponds with the half of the range.


Market sentiment

Cardano is in the sell zone.


Pivot points

S3 0.076333 
S2 0.103199 
S1 0.120628 
P 0.130065 
R1 0.147494 
R2 0.156931 
R3 0.183797

Conclusion


Crypto Coin Market Cap: After the prices have tested the old lows and dipped beyond them a bit we are seeing a trend reversal taking place. As the chart of the cryptocurrencies analysed in this report point out, this is going to be a short-term recovery, before another drop.

This was my projection from 02.06.2018 in which I have drawn the recent low the recovery I am expecting before another potentially final drop to around 178B level.
Crypto Coin Market Cap

This recovery might serve as a great shorting opportunity, but as there is so much manipulation going on, things can get pretty uncertain, so be careful.

Categories
Crypto Market Analysis

Weekly Crypto Update 27.06.2018 – One More Low Expected To The Bottom


General Overview


Market Cap: $245,897,879,486

24h Vol: $10,982,438,642

BTC Dominance: 42.6%

From last Monday, the cryptocurrency market has been in a constant decline as the market fell from 294,184,000,000$ which was last weeks high on Tuesday 19.06.2018. The lowest the crypto market has been was on Sunday when the crypto market capitalization hit 235,331,000,000$.

Those levels were expected to be a lower low after which the cryptos were going to recover, but as the new high failed to exceed the prior one, there aren’t any signs of a trend reversal, and the evaluation is close to the last low levels. This situation implies that a lower low is more likely and that this is the bottom after which the trend reversal is going to start.


News


Out of those stories that marked the past week, the most significant one is the Bithumb hack.

Bithumb, which has fallen from 6th to 10th place for cryptocurrency exchanges worldwide by trading volume, has had about $30 million worth of cryptocurrencies stolen in an apparent hack.

This headline created a lot of FUD (fear, uncertainty, and doubt) in the market and many blamed this event as the fundamental reason of the continuation of the bear market, which was not the case as this exchange is not that large.

In the law and tax category, there are two major headlines. First is that  U.S. federal employees will have to report their cryptocurrencies holdings if they equal more than $1,000 or made more than $200 during the reporting period. The other one is that the Uruguayan Chamber of Fintech has announced the creation of a special committee to develop a framework for crypto regulation and promote innovation to support the country’s financial system.

Both of this news is positive, as the first one implies that cryptocurrency is valuable and should be reported as “other forms of securities.”

In the adoption category, the news items that stands out is the news of Square receiving the New York BitLicense. The announcement means that Cash App users in every state except for Georgia and Hawaii now have the option to buy and sell Bitcoin.


Analysis


BTC/USD

From the opening on Monday, June 18 at 6875$, the price of Bitcoin has decreased by 11.19% as it is now sitting around 6110$. The opening price is the highest Bitcoin has been, and the lowest was at 5770$, from which it quickly recovered closing as a Doji candle with a big a wick from the downside on the daily chart on 24.06.2018.


Looking at the daily chart, we can see that the current wave is near completion, but it looks like another low might happen whos target I’ve projected to be from 5664$ on the supportive significant level (purple dotted line), to 5515$ which is the support line from which Bitcoin created the all-time high. As I think this current wave is the wave X of the WXYXZ sideways correction, I am waiting to see signs of the short-term trend reversal, before the price continues to new lows.


Market sentiment 

Daily chart technicals signal a strong sell.

Oscillators are on sell, and moving average signal a strong one.


Pivot points

S3 4426.3 
S2 5365.2 
S1 5758.6 
P 6304.1 
R1 6697.5
R2 7243.0 
R3 8181.9

LTC/USD

From last Monday, the price of Litecoin has depreciated in value from 100$ to slightly below 80$ which is a 20% decrease in ten days. The opening on Monday was the weeks high, and the lowest Litecoin has been is to the 73.5$ area on Sunday.


Looking at the daily chart, I am seeing another low ahead to the support line at 71.29$ which is significant as from that level the price of Litecoin went on to create the all-time high. If that level holds I would be expecting a short-term trend reversal as I think that the current wave is an X from the WXYXZ sideways correction


Market sentiment

Litecoins daily chart technicals signal a sell.

Oscillators are on sell, and moving averages signal a strong one.


Pivot points

S3 44.663 
S2 66.371 
S1 74.517 
P 88.079 
R1 96.225 
R2 109.787 
R3 131.495

EOS/USD

At the start of last week on Monday, June 18, the opening price of EOS was at 10.95$. Since then the price has decreased substantially to 8$ which is a decrease of 25.81%. The price went even lower on Sunday when it spiked to 6.89$.


Looking at the daily chart, we can clearly see that the corrective move was a WXY correction and that the Y wave is near completion. I am expecting the price to drop to the 6.58$ level were an 8/1 Gann fan level is and another support level from a prior range from whom similarly to the case of Bitcoin and Litecoin, the price created the all-time high. As this would be the last low a trend reversal would be expected, but how long would it live we are yet to see from the formations and patterns ahead.


Market sentiment

Daily chart technicals signal a sell.

Oscillators are indicating a sell, and moving averages signal a strong one.


Pivot points

S3 3.3173 
S2 6.2033 
S1 7.2797 
P 9.0893 
R1 10.1657 
R2 11.9753 
R3 14.8613

XRP/USD

From the opening price at 0.55$ last Monday, the price of Ripple has decreased by 15.48% as it is now sitting at 0.47$.


On the chart, we can see that the support at the prior low level at 0.4541$ held the price again. As the current wave is the last impulse wave I am expecting a trend reversal, but the price may fall a bit lower before that happens. The new potential low would be at the next support level at 0.4144$. However, this level may hold and the trend reversal starts happening from here. The move up would be a corrective move, probably in a form of another three-wave ABC move, which is why I am expecting the price to go down further.


Market sentiment

Ripple’s daily chart technicals indicate a sell.

Oscillators are signalling a sell, and moving averages a strong one.


Pivot points

S3 0.32270 
S2 0.41468 
S1 0.45231 
P 0.50666 
R1 0.54429 
R2 0.59864 
R3 0.69062

XMR/USD

The price of Monero is on the same levels like on Monday last week which is around 128$. The price fell by 17% from Monday to Sunday to the weeks low at 106.78$.


Looking at the 4-hour chart, we can see that the price is currently on the rise, but that would only be a corrective move from where I am expecting the price to go lower to the 100$ level, which would be the support line 2 of the support area.


Market sentiment

Monero is in the buy zone.

Both oscillators and moving averages signal a buy.


Pivot points

S3 97.133 
S2 102.972 
S1 108.811 
P 126.405 
R1 146.510 
R2  190.105 
R3 210.210

Conclusion


If you remember this was my projection from 02.06.2018

As you can see I was expecting to see on the global chart that the prior lows at around 250 billion dollar evaluation get retested, after which another similar pattern would appear.

The lows were retested and the evaluation is hovering around those levels which is why now I am looking for signs of a reversal.

After looking at the charts of major cryptos, and especially Bitcoin as it has the 42% market dominance, I think that another low is going to happen before some short-term recovery. Those lows would be to tests the support levels from where the all-time high was made in all cryptos that we’ve covered in this report.

Categories
Crypto Market Analysis

Weekly Crypto Update 18.06.2018 – Retest of the Lows Expected


General Overview


Market Cap: $276,493,181,374

24h Vol: $10,178,348,969

BTC Dominance: 40.1%

From last Monday, 11th of June, the cryptocurrency market cap has experienced a short-term rise from 294,722,000,000$ to 301,321,000,000$ which was the weeks high, and after that, it has fallen to 265,974,000,000$ which was the weeks low on 13th of June. After the low, the market has recovered slightly and is currently sitting in the middle of the high-low range as you can see from the graph below.


Crypto Weekly Update


News


Top stories that came out in the last week are the following:

German Government Doesn’t Think Bitcoin Threatens Financial Stability

Officials from Germany’s federal government do not believe that Bitcoin poses a threat to the existing financial structure, as the volume of crypto transactions is too low compared to the size of the global financial system to be a great influence. However, the government added that cryptocurrency should be regulated as they continue to monitor the crypto space.

Proposed Bills In Michigan Classify Blockchain Tampering As Crime

Two bills currently proposed in the Michigan state legislature would make altering the public digital record on a blockchain with intent to defraud into a felony punishable by up to 14 years in prison, as well as adding definitions of distributed ledger technology to the Michigan penal code.

CBOE President Says SEC Calling ETH Not A Security Paves Way For ETH Futures

The president of CBOE–which released the first Bitcoin futures last December–said that the SEC’s recent decision that Ethereum will not be regulated as a security has removed a big “stumbling block” from the possibility of offering Ether futures.

Source: cointelegraph


Analysis


EOS/USD

From last Monday, the price of EOS has dropped from 11.3$ to 10.22$ which is 9.28% decrease.


As you can see from the daily chart, last Monday’s opening was the highest price it has been, and that level now serves as resistance. On June 13th, on which we saw the market experienced a low was also the day that EOS was at its lowest, closing as a Doji on that day. The next day price recovered significantly but was stopped out by the resistance of Monday’s open. Currently, the price pattern is looking unstable and I would expect another low from here to around 9.1$ at least which was last weeks low, or even further down to the support at 8.69$.


Market sentiment 

Daily chart technicals signal a sell.

Oscillators are signalling a sell, and moving averages a strong one.


Pivot points

S3 1.1720
S2 6.2113
S1 8.3731
P 11.2506
R1 13.4124
R2 16.2899
R3 21.3292


LTC/USD

From 108.461$ which was the opening price last Monday, the price of Litecoin has decreased by 13.87% and is currently 93.395$ per Litecoin.


As you can see from the daily chart, the opening on 11th of June was the highest price Litecoin has been, and since then it has fallen to 89.277$ on 13th of June and recovered slightly, but today’s candle is on the levels of 13th of June’s close. The price is currently about to break out from the triangle in which it was consolidating, and judging by the market sentiment the breakout from the downside is expected.


Market sentiment

Daily chart technicals signal a sell.

Oscillators signal a sell, and moving averages a strong one.


Pivot points

S3 44.706
S2 72.869
S1 84.755
P 101.032
R1 112.918
R2 129.195
R3 157.358


DASH/USD

The price of Dash has dropped from 281.27$ which was the opening price on Monday 11th of June to 251$ where it is currently sitting, which is a decrease of 10.2%.


As you can see from the daily chart, the price of Dash has followed the same pattern as the other cryptos as markets are strongly correlated – the price was at its highest on last Monday, its lowest on 13th of June and is now looking like its going to break out from the downside of triangle.


Market sentiment

Dashes daily chart technicals signal a sell.

Oscillators are signalling a buy, and moving averages signal a strong sell.


Pivot points

S3 130.32
S2 198.03
S1 231.81
P 265.73
R1 299.51
R2 333.43
R3 401.14

XMR/USD

From last Monday until today, the price of Monero has been dropping from 140.89$ to 103.84$ on 13th of June which was the lowest Monero has gone in the past week. Since that low, the price has recovered and went above the support line at 121.775$, but is now back below it.


On the daily chart, we can see that the support at 121.775$ is a significant level as that was the prior range resistance, from which the price went on a steep upward trajectory to the all-time high. We will see what happens on this level, maybe today’s candle will close above it, however, that’s highly unlikely considering the market correlation and the bearish sentiment.


Market sentiment 

Monero’s daily chart technicals signal a strong sell.

Oscillators are on sell, and moving averages signal strong one.


Pivot points

S3 22.723 
S2 75.123 
S1 100.647 
P 127.523 
R1 153.047 
R2 179.923 
R3 232.323

Conclusion


Crypto Weekly Update: As the prices were mostly consolidating after the low experienced on June 13th, the crypto market was mostly stagnating. The consolidation period is near completion and from my analysis of the four cryptocurrencies that are covered in this report, I conclude that we are in for another low. This week will most likely be the week of the retest of the lowest points cryptos have experienced in this prolonged correction after which I am expecting a short-term trend reversal.

This was my projection published on 02.06.2018 in my weekly update post, and it looks like it all going in accordance with my projection. What I meant by a ‘retest of the lowest points cryptos have been’ is to see the market at around $250B. After that, I would expect a short-term trend reversal to slightly below last high and then a final down move that many would consider ‘capitulation’, but I would consider it a great buy opportunity.


Crypto Weekly Update Chart

Market cap on 02.06.2018 with my drawn projection 


Market cap today 


For more on what I think it’s coming next, make sure to check out the weekly update video in which I will provide my longer-term analysis and the potential scenario of this correction using Elliott Wave principles.

Categories
Crypto Market Analysis

Weekly Crypto Update 12.06.2018 -Indecision (VIDEO)

From last Monday, 4th of June, cryptocurrency market capitalisation has decreased from 350,914,000,000$ to slightly below $300B where it is currently, which is a 51 billion dollar decrease.

After we have seen the prices decrease over the last 7 days, we are likely to see some sideways action in this one, followed by indecision over the weekend. I think that the prices are going to retest prior support levels which now serve as resistance and fall back further to the levels of prior lows, which for Bitcoin would be around the 6000$ area. That may trigger some buying or may create a panic selling. I am considering this week a ‘no-trade week’ as long as I don’t see either retest of the prior lows or a confirmation of a trend reversal.

For the reasons why I think that, make sure to check the video.

Categories
Crypto Market Analysis

Weekly Crypto Update 04.06.2018 – Sideways Movement Expected (Video)

From Monday 28th May, the total cryptocurrency market cap evaluation has been rising overall, but it experienced a lot of choppy movement, as for every new high it made, a sharp downward movement occurred. That means the market sentiment is still bearish as sellers are waiting anxiously for the right price in order to sell.

In this weekly video, I am going to provide my Elliott Wave forecast and explain as to why I think we are in for more sideways movement before another large drop.


Categories
Crypto Market Analysis

Weekly Crypto Update 04.06.2018 – Sideways Movement Expected


General Overview


Market Cap: $344,628,122,166

24h Vol: $16,760,046,234

BTC Dominance: 37.8%

From Monday 28th May, the cryptocurrency market cap evaluation has been rising overall, but it experienced a lot of choppy movement, as for every new high it made, a sharp downward movement occurred. That means the market sentiment is still bearish as sellers are waiting anxiously for the right price in order to sell.

The resistance line at around 342 billion dollars has been crossed and it is now being retested for support.


News


This weeks top headlines are the following:

South Korea is in the process of lifting the ICO ban 

The National Assembly has officially made a proposal to allow domestic initial coin offerings (ICOs). As the administration is sitting on its hands after imposing a total ban on ICOs in September last year, the National Assembly has come forward with an official recommendation.

Source: http://www.businesskorea.co.kr

Major vulnerability found in the EOS blockchain days before the mainnet launch. 

China’s largest Internet security company, Qihoo 360, has found several high-risk security vulnerabilities in EOS’s blockchain platform. These vulnerabilities would enable remote attacks on all EOS nodes, Qihoo 360 claimed on Weibo Tuesday, May 29.

Crypto exchange Binance plans to create 1 billion dollar fund.

Binance, currently the world’s largest cryptocurrency exchange by trade volume, plans to create a $1 bln cryptocurrency-based fund, an executive confirmed June 1. Using only Binance’s BNB tokens as an investment vehicle, the fund will be administered through the exchange’s incubator spin-off Binance Labs.

Source: cointelegraph.com


Analysis


BTC/USD

From Mondays open, the price of Bitcoin has increased by 4.2% coming from 7294$ to 7608$ where it is currently. The rise was in the form of an upward channel/wedge.


On the daily chart, we can see that the price was at its lowest last Monday and below the baseline support (bold black line). Since then the price went above the baseline support with strong momentum, as those lows triggered buyers who have pushed the price higher. The price is currently inside the triangle again and was repealed by the triangle resistance line and 0.236 Fibonacci retracement level, so the price fell back to the baseline support again.


Market sentiment

Bitcoin daily chart technicals signal a sell.

Oscillators are on buy, but moving average signal a strong sell.


Pivot points

S3 6141.4 
S2 6800.2 
S1 7219.1
P 7459.0 
R1 7877.9
R2 8117.8 
R3 8776.6

ETH/USD

From Monday, May 28. Ethereum’s price increased by staggering 22.27% from 494$ which was the week’s low, to 605$ where it is currently sitting.


Looking at the daily chart, we can see that the price found support at the 0.236 Fibonacci retracement level and the unconfirmed support, and is currently repealed by the downward channel resistance line and is heading down to the 0.382 Fibo level. Overall last week was bullish for Ethereum, but judging by how much has the price increased and the interaction with the significant trendlines, this week may not be the same.


Market sentiment

Ethereum is in the sell zone.

Oscillators are signalling a buy, but with 8 on neutral, and moving averages are signalling a strong sell.


Pivot points

S3 343.61 
S2 452.53 
S1 521.49 
P 561.45
R1 630.41 
R2 670.37 
R3 779.29

XRP/USD

In the last 7 days, the price of Ripple has been increasing steadily from 0.544$ to 0.656$ which is a 19.54% increase overall.


On the daily chart, we can see that Monday’s opening was the weeks low. From there the price went above the 0.573 with a strong momentum as indicated by the big green candle on Tuesday. Since then the price has been steadily increasing but it was now stopped out by prior range support, which now serves as resistance at 0.699$ levels.


Market sentiment

Daily chart technicals are signalling a sell.

Oscillators are on buy, and moving averages are signalling a sell.


Pivot point

S3 0.39577 
S2 0.50453 
S1 0.57380
P 0.61329
R1 0.68256 
R2 0.72205 
R3 0.83081

LTC/USD

From last Monday’s open, the price of Litecoin has increased by 9.73% from the weeks low on Monday at 110.2$ to 121$ where it is currently.


Looking at the daily chart we can see that the price of Litecoin fell below the retracement zone which is at the 111$ level on last Monday which triggered some buying. That buying pressure was short lived as the price failed to stay above the retracement zone level at 124$ and is now back in it again.


Market sentiment

Litcoin is in the sell zone.

Oscillators are on buy but with 8 on neutral, and moving averages are signalling a strong sell.


Pivot points

S3 88.590 
S2 103.930 
S1 113.810 
P 119.270 
R1 129.150 
R2 134.610
R3 149.950

Conclusion


The market conditions are now similar to that of Jun 2014. After a strong runup, we are seeing a triangle being formed on the global chart.

Market cap chart back in 2014.

As you can see after the evaluation broke out from the triangle it halved in evaluation from the first high that was formed outside of the triangle.

So if the similar thing happens again this would be something that I would expect – a downfall to around $178B which would bring the price of Bitcoin to around 4500$ which would correlate perfectly with my Elliot Wave correction count which can be seen on the weekly update video.

In any way, I would be expecting a lot of sideways movement in the following weeks as the evaluation is clearly in a range.

Categories
Crypto Market Analysis

Weekly Crypto Update 20.05.2018 – More Correction Coming


General Overview


Weekly Cryptocurrency Update:

Market Cap: $383,203,468,592 
24h Vol: $15,118,655,008 
BTC Dominance: 37.2%

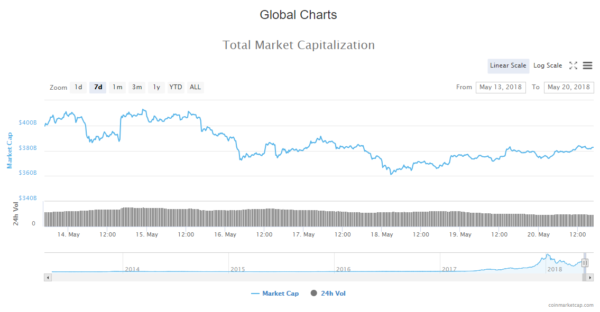
At the start of the week on Monday 14th May, the cryptocurrency market cap evaluation was $407,285,000,000 and it soon dropped to $386,345,000,000 before it spiked up to $412,903,000,000 which was the week’s high. From Monday to Friday, the market cap has been steadily dropping and it hit $361,113,000,000 which was the week’s lowest point.

Weekly Cryptocurrency Market Cap Update

From yesterday, the evaluation has been increasing but it looks like it entered the bearish territory, judging by the spike to $383,159,000,000, and a quick drop. However, this may be a new support level, as the evaluation appears to be stabilising around these levels.


Analysis


BTC/USD

At the start of the week, the price of Bitcoin was $8700 and the only time it went higher was on the same day when it hit $8815 after a drop to $8365. It is now sitting at $8370 which is a 4.8% decrease.


Looking at the daily chart we can see that Monday’s candle was a pin bar doji which indicated stronger buying pressure than the pressure from the sellers, but the position of the candle, however, indicated more downside.

Yesterday’s candle closed as a red doji and as you can see from the wick, the price hit the 0.382 Fibonacci level and retraced since so judging by the wick there’s still a lot of selling pressure.

Today’s candle is green, which is very unusual for Sunday, as on weekends there’s a lot of selling going on. 


Market sentiment

Daily chart technical signals a strong sell.

Oscillators are on a sell and moving averages are indicating a strong sell with 13 MA’s on sell


Pivot points

S3 5360.5 
S2 7120.1 
S1 7795.5 

P 8879.7

R1 9555.1 
R2 10639.3
R3 12398.9

ETH/USD

From Monday until today, the price of Ethereum has decreased by 2.8% going from $733 to $712 where it is now sitting. The price fell even lower to $660 on Friday which is the week’s low.


On the daily chart, we can see that the candle on Monday was a pin bar doji like in the case of Bitcoin and since then, the price fell to the 0.5 Fibonacci levels, where it found support. Yesterday’s candle was a doji also like in the case of Bitcoin, and the current one is green but not higher than yesterday’s which is still a bearish sign. 


Market sentiment

Ethereum’s daily chart technicals signal a buy.

8 oscillators are on neutral and moving averages are signalling a strong buy. 


Pivot points

S3 499.01 
S2 596.73 
S1 646.17 

P 694.45 

R1 743.89 
R2 792.17 
R3 889.89

XRP/USD

From Monday’s open until today, the price of Ripple has declined by 5.82% going from $0.73 to $0.688 where it is currently sitting. The price went down further on Friday to $0.645, but since then, it has been steadily rising to the levels on where it is currently.


Looking at the daily chart we can see that Monday’s candle was a pin bar doji like in the case of Bitcoin and Ethereum, but the correlation doesn’t end there as we can see that yesterday’s candle was a doji also, like it was on the BTC and ETH daily charts. 


Market sentiment

Ripple is still in the sell zone, as daily chart technicals signal a sell.

Oscillators are;- 3 on sell and 8 on neutral, but moving averages signal a strong sell with 12 on sell.


Pivot points

S3 0.48085
S2 0.58545
S1 0.63011

P 0.69005

R1 0.73471
R2 0.79465
R3 0.89925

LTC/USD

Overall this week, Litecoin has decreased by 3.38% from $144 on Monday’s opening to $139.2 where it is today. The price went higher than it was on the opening to $151 on Monday, and it was lower than today’s (Friday), to $129 which was the week’s low.


Looking at the daily chart we can see that the price of Litecoin is currently interacting with the 0.236 Fibonacci retracement level which serves as resistance. On Monday there was great indecision which can be seen on Monday’s candle wicks. On Wednesday we had a pin bar doji that closed above the Fibonacci level which indicated buying pressure, but as you can see the buyers failed to push the price higher, and the sellers were stronger so the price fell below the Fibo level on the next day. 


Market sentiment

Daily chart technicals signal a sell.

Oscillators signal a sell, and moving averages a strong one.


Pivot points

S3 90.493 
S2 114.733 
S1 124.937

P 138.973

R1 149.177
R2 163.213
R3 187.453

Conclusion


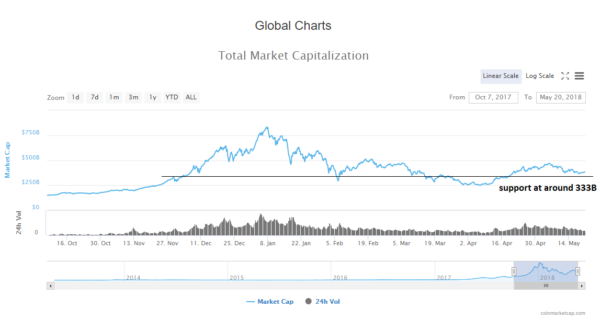
Weekly Cryptocurrency Update: I don’t believe that the corrective move is over. The prices of four major cryptocurrencies failed to exceed prior highs even though we are experiencing a move to the upside in the last couple of days. I think we are in for another low.

Weekly Cryptocurrency Update

This will correspond with a retest of prior resistance for support which is around $333B.

For more information about what’s likely coming in the following week make sure you watch the substitutionary video in which I provide a forecast and reasons why I believe there’s another low coming.


Categories
Forex Market Analysis

Weekly Update:markets on a positive evolution

Weekly Update / April 23rd – 27th

Macroeconomic Outlook

Last week closed positively since both indexes closed positively due mainly to:

  • Strong Quarterly Results from companies
  • Less relevance in regards to the risk factors that have been influencing the markets lately
Geopolitical tension has been reduced from:
  • That punctual attach from the USA over Syria
  • New tariff barriers have not been announced from both USA & China
  • The Technology sector has recovered following Netflix results

The increase in commodity prices which has induced a drop in bond prices

  • 7/8 basis points increased in both American and German bonds

We expect that markets to continue with a positive evolution from the past two weeks

  • Mainly because of a smaller relevance of geopolitical risks and more focus on the macroeconomics and business results
Macroeconomic Data
  • We do not expect them to be outstanding but solid enough to favour the financial markets
  • Relevant Macro Data

o   Consumer Confidence in USA

o   Business & Consumer Confidence + PMIs in the Eurozone

  • Will follow the trend from recent weeks

o   Won’t touch the highs attained during this year, but data will remain within fairy good levels which will confirm the expansive economic cycle that both USA and the Eurozone are enjoying.

o   USA GDP / Previous – 2.9% – Forecast – 2.2%

  • Normal to be weaker in the first trimester in USA and then recovers in the second one
  • Not a brilliant macro but good enough not to damage the markets

o   ECB Meeting on Thursday

  • Draghi will keep its expansive monetary policy due to
  • Protectionism
  • Strengthening from the Euro against the US Dollar
  • Triple P Strategy in a monetary policy that is giving good results
  • Persistent
  • Patient
  • Prudent
  • Hence, the macro environment can be a support for the upswing in financial markets along with the positive quarterly results reported from companies

o   Companies that have reported results from the S&P 500 so far have announced an increase in the profit per share of 18 %, higher than the 17% expected

o   Solid outlook from the biggest American banks last week

o   We expect this positive climate to hold this week

  • In USA big technologies company such as Alphabet, Google, Amazon or Facebook among others report results this week
  • Good results are expected

In summary, geopolitical risks (protectionism, trade wards…) cannot be forgotten. However, they hold less importance and focus this week on the good business results.  That will confirm the validity of the current cycle of economic expansion and will offer support for prices so that markets may remain in the bullish trend of the last weeks.


Technical Outlook

USD Index

Daily Chart

It is possible to appreciate how the USD Index is not only below the 200 EMA but also broke below the weekly support that has been retesting in the recent weeks and which has not been successful so far. In the short term is facing a bearish trend line caused by its recent devaluation.

It did not break the support which has been holding on for weeks, and now it is facing the key moment between a strong support and a strong resistance. We don’t mind where it breaks this week.  We’ll wait for a retest for confirmation.

USDJPY

Daily Chart

Moving into the USDJPY, it has just bounced from a monthly bullish trend after doing a fake breakout and consequently bouncing back. A bullish trend could be considered since there are not big resistances ahead except its 200 EMA and the recent bearish monthly trend. In the short term, there are two resistances not very strong but that may cause a small retracement. However, the monthly support is stronger than the resistance it is locked up between.

This week it opened on the edge right below the resistance, so a close on Monday above it may confirm the bullish trend line.


GBPUSD

Daily Chart

GBPUSD has taken a strong change of direction. From breaking up the resistance and having a clear path upwards to heavily break the support that once was a resistance, and opening the chance for a bearish trend. We´ll wait for a retest as confirmation of the downturn.

Crude Oil

Daily Chart

Recent political events, like the recent missile attack to Syria, have created volatility in the markets and consequently, the price of oil has been on the rise. After holding to the trend line and breaking above $65 it is possible to see a retest of the recent resistances it just broke above. Without more resistances ahead, our analysis hint for the next target at $70 per barrel.

So, as expected, on Tuesday it retested both supports it previously broke. Firstly, with the daily low it retested the down trend support and with the closing price second one. Here, it confirms the retest and instantly goes up leaving the door open to $70.

DAX

Daily Chart

Regarding technical, it just broke the resistance it was holding it from weeks. Now, after a clear retest, a bullish position can be taken.


© Forex.Academy


Categories
Forex Market Analysis

Tit-for-tat weighs heavy on the markets

A difficult week

It has been another difficult week in the markets, and this has been primarily down to the difficulty in assessing what the trade standoff between the US and China mean for the markets. The week started off with the market taking fright as additional tariff threats were voiced by the US, leading to a sharp sell-off in equity markets. However, much of that rhetoric was rowed back on leading to a significant bounce back actually making pre-fright highs before the SP500 started to sell off again.  This simply means that there is no overriding directional bias in either direction making this market very choppy and difficult to trade.


Gold

As a result, the Gold market responded by initially strengthening due to the fear related to the equity story but then reversed those initial gains and now trades right in the middle of significant support and resistance levels which can be clearly seen from the chart below, these significant levels are $1,357 and $1,310, so all eyes will be on these levels over the coming days and weeks to see what is next for the yellow metal.

Oil

The Crude-Oil market responded to these major global developments by initially selling off but then after seeing a bit of erratic price action we continued to see a continuation to the down side, closing the week below the $62 level.  However, from a technical perspective, the situation regarding the crude oil market is an interesting one.  We can see from the chart below that we have been in a consistent up trend since mid-June 2017, reaching a high of $66 towards the end of Jan 2018.  Since this time, this market has clearly struggled to break the $66, creating a double top end of March.  So over the last two weeks, this market has bounced back to its lower trend line.  The next few days will be interesting to see whether the support level holds and we see another attack at the $66 level or will this support level break, and we see prices pushing down to a potential structural failure below the $60 level which would put major pressure on this market to the downside.  At this crucial point, it’s hard to see whether buyers or sellers will win out.


So just to recap, over the course of the last 5 trading days, US officials made very strong statements about the need for trade tariffs to be introduced only for US officials to then row back on some of its rhetoric, as a result, market nerves were calmed, and Monday’s fear related move was subsequently reversed. The S&P rallied and then retraced, and the gold and crude oil markets came off.

US Dollar

The USD, however, has been impacted by recent events but to a lesser degree. As you can see, from the chart below, the dollar index has been in a period of consolidation since mid-Jan.  These, unfortunately, for the time being, are the market conditions in which we are trading the USD. The two major prices to keep an eye out for over the coming days and weeks is the 99.880 to the up side and 88.416 to the down side.  A move in either direction would be significant for this market.


EURUSD

EURUSD continues to trade within a range. Today’s weaker NFP numbers perhaps suggest that the pair might move higher next week given the fact too that from a technical perspective, the pair is trading closer to the lower end of its range as can be seen from the chart below.


USDJPY

USDJPY has been firmer this week, however, watch the key pivotal resistance area next week around 108.20. This was the breach that confirmed a bearish range breakout back in February.


The US Dollar paired earlier gains during Friday’s London session after data showed the US economy adding new jobs at less than half the pace economists had expected for the March month. The important Non-Farm Payrolls figure grew by just 103,000 during the recent month, which is down from 313,000 in February and far below the economist consensus for a reading of 188,000.

Separately, the unemployment rate held steady at 4.1% for the month when markets had been looking for a 10-basis point fall to 4.0%. Household incomes grew by 0.3% during the recent month, which is up from the 0.1% seen in February and in line with the consensus forecast of economists.


Price action largely noted limited volume in the week leading up the non-farm payroll figure but saw initial volatile swings before the USD began to weaken over the course of Friday afternoon and evening.

Trade of the week – Long GBP/USD

With the US caught up with trade issues with China causing confusion among other countries and added uncertainty across the US Dollar Forex Pairs, perhaps the best technical trade may look GBP support with better than forecast UK economic data.

With the GBP showing strength over the USD in April for the last 13 consecutive years running, speculators are now looking at this trend for the best potential buying opportunity. With good news for the pound with UK PMI slightly higher than expectations, Friday trading is seeing the pound trade up with a touch and bounce from the greater bullish trendline of 2017. The discussion now seems to favour the pound is seemingly defying the expectations of Brexit doom.