General Overview
Weekly Cryptocurrency Update:

Market Cap: $383,203,468,592
24h Vol: $15,118,655,008
BTC Dominance: 37.2%
At the start of the week on Monday 14th May, the cryptocurrency market cap evaluation was $407,285,000,000 and it soon dropped to $386,345,000,000 before it spiked up to $412,903,000,000 which was the week’s high. From Monday to Friday, the market cap has been steadily dropping and it hit $361,113,000,000 which was the week’s lowest point.
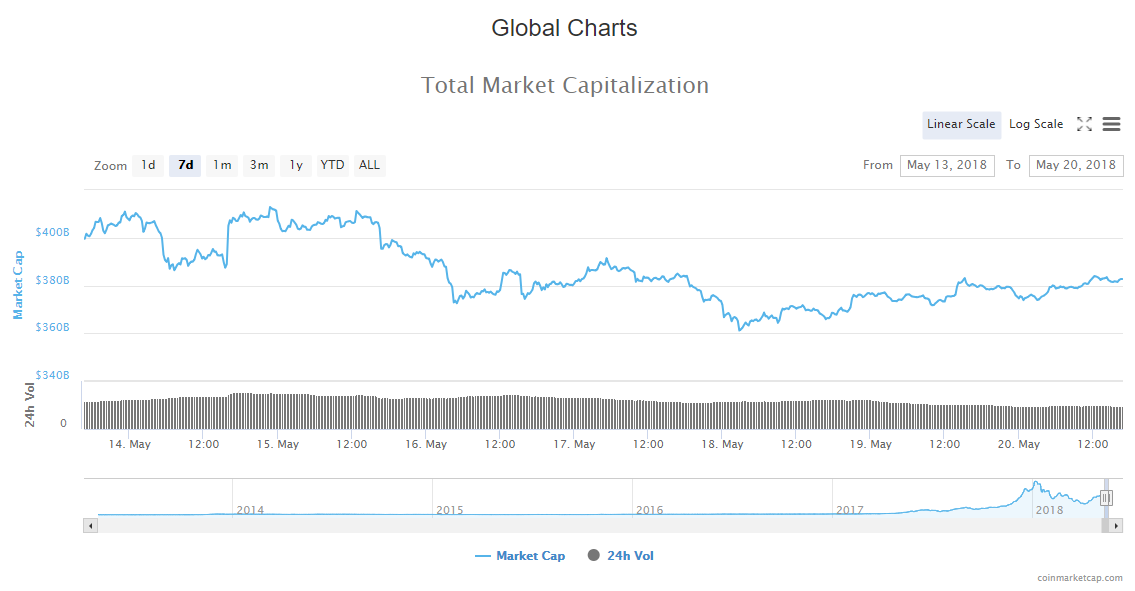
From yesterday, the evaluation has been increasing but it looks like it entered the bearish territory, judging by the spike to $383,159,000,000, and a quick drop. However, this may be a new support level, as the evaluation appears to be stabilising around these levels.
Analysis
At the start of the week, the price of Bitcoin was $8700 and the only time it went higher was on the same day when it hit $8815 after a drop to $8365. It is now sitting at $8370 which is a 4.8% decrease.
Looking at the daily chart we can see that Monday’s candle was a pin bar doji which indicated stronger buying pressure than the pressure from the sellers, but the position of the candle, however, indicated more downside.
Yesterday’s candle closed as a red doji and as you can see from the wick, the price hit the 0.382 Fibonacci level and retraced since so judging by the wick there’s still a lot of selling pressure.
Today’s candle is green, which is very unusual for Sunday, as on weekends there’s a lot of selling going on.
Market sentiment
Daily chart technical signals a strong sell.
Oscillators are on a sell and moving averages are indicating a strong sell with 13 MA’s on sell.
Pivot points
S3 5360.5
S2 7120.1
S1 7795.5

P 8879.7

R1 9555.1
R2 10639.3
R3 12398.9
ETH/USD
From Monday until today, the price of Ethereum has decreased by 2.8% going from $733 to $712 where it is now sitting. The price fell even lower to $660 on Friday which is the week’s low.
On the daily chart, we can see that the candle on Monday was a pin bar doji like in the case of Bitcoin and since then, the price fell to the 0.5 Fibonacci levels, where it found support. Yesterday’s candle was a doji also like in the case of Bitcoin, and the current one is green but not higher than yesterday’s which is still a bearish sign.
Market sentiment
Ethereum’s daily chart technicals signal a buy.
8 oscillators are on neutral and moving averages are signalling a strong buy.
Pivot points
S3 499.01
S2 596.73
S1 646.17

P 694.45

R1 743.89
R2 792.17
R3 889.89
XRP/USD
From Monday’s open until today, the price of Ripple has declined by 5.82% going from $0.73 to $0.688 where it is currently sitting. The price went down further on Friday to $0.645, but since then, it has been steadily rising to the levels on where it is currently.
Looking at the daily chart we can see that Monday’s candle was a pin bar doji like in the case of Bitcoin and Ethereum, but the correlation doesn’t end there as we can see that yesterday’s candle was a doji also, like it was on the BTC and ETH daily charts.
Market sentiment
Ripple is still in the sell zone, as daily chart technicals signal a sell.
Oscillators are;- 3 on sell and 8 on neutral, but moving averages signal a strong sell with 12 on sell.
Pivot points
S3 0.48085
S2 0.58545
S1 0.63011

P 0.69005

R1 0.73471
R2 0.79465
R3 0.89925
LTC/USD
Overall this week, Litecoin has decreased by 3.38% from $144 on Monday’s opening to $139.2 where it is today. The price went higher than it was on the opening to $151 on Monday, and it was lower than today’s (Friday), to $129 which was the week’s low.
Looking at the daily chart we can see that the price of Litecoin is currently interacting with the 0.236 Fibonacci retracement level which serves as resistance. On Monday there was great indecision which can be seen on Monday’s candle wicks. On Wednesday we had a pin bar doji that closed above the Fibonacci level which indicated buying pressure, but as you can see the buyers failed to push the price higher, and the sellers were stronger so the price fell below the Fibo level on the next day.
Market sentiment
Daily chart technicals signal a sell.
Oscillators signal a sell, and moving averages a strong one.
Pivot points
S3 90.493
S2 114.733
S1 124.937

P 138.973

R1 149.177
R2 163.213
R3 187.453
Conclusion
Weekly Cryptocurrency Update: I don’t believe that the corrective move is over. The prices of four major cryptocurrencies failed to exceed prior highs even though we are experiencing a move to the upside in the last couple of days. I think we are in for another low.
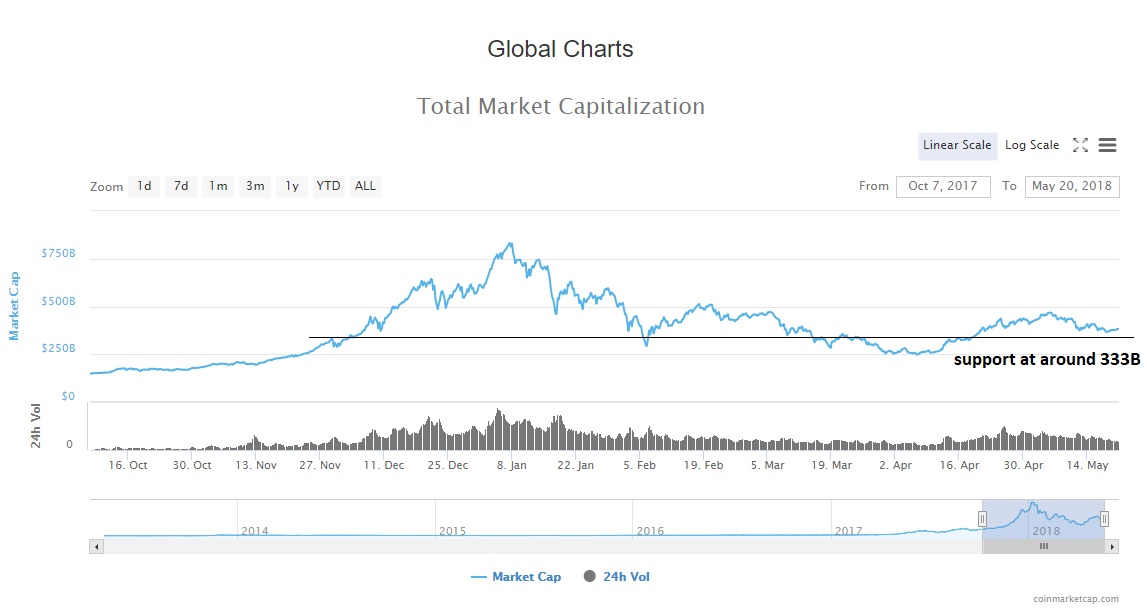
This will correspond with a retest of prior resistance for support which is around $333B.
For more information about what’s likely coming in the following week make sure you watch the substitutionary video in which I provide a forecast and reasons why I believe there’s another low coming.