
Yesterday, cryptocurrencies behaved as expected, retracing some of their Monday’s gains. Early morning losses continued. Bitcoin lost 2.47% over its 24-hour value. Most altcoins joined the movement such as Ethereum (4%), Ripple (-4.04%), Bitcoin Cash(-4.47%), EOS(-4.57%), Bitcoin SV(-6.15%) and TRON (-5.61%).

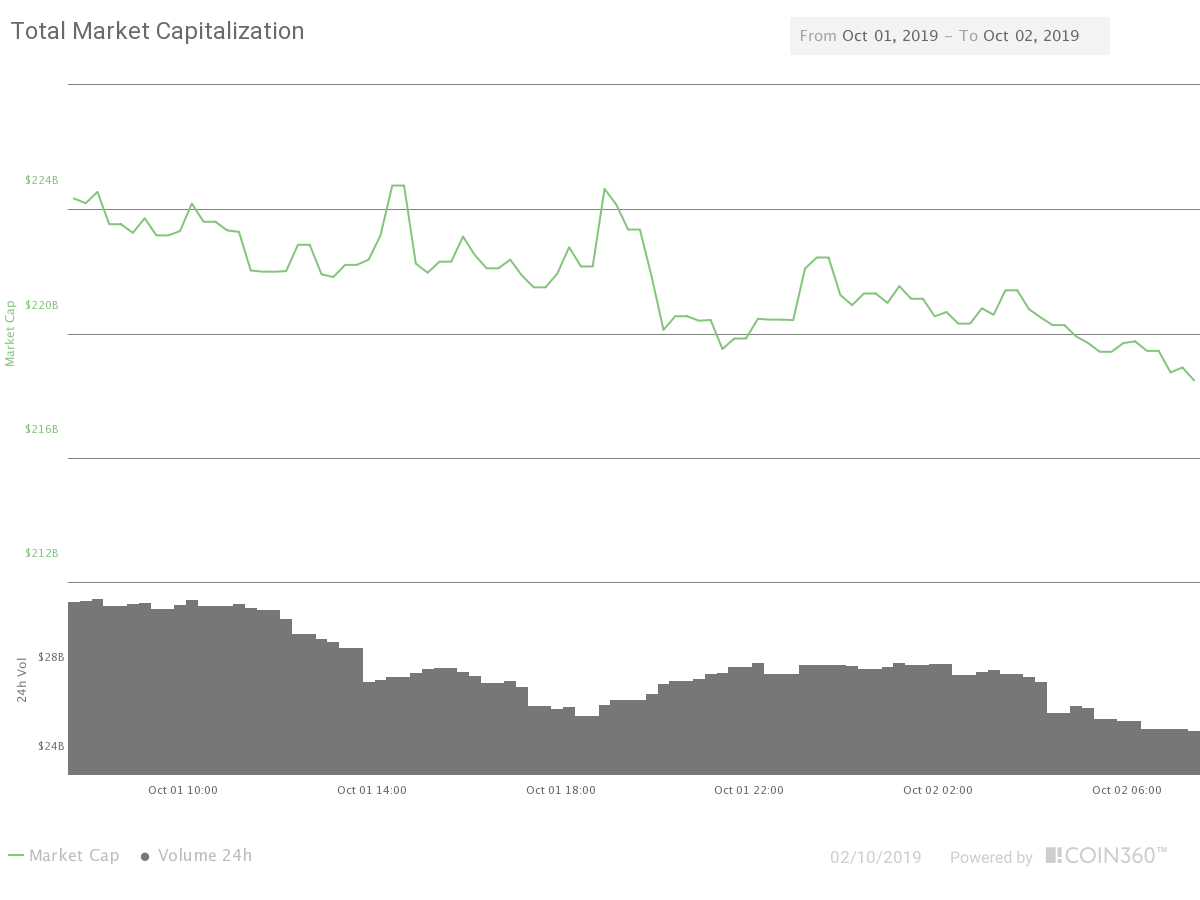
The market cap descended to $218.5 billion, while the 24H volume was $26 billion, as seen in the figure below.
The current market dominance is as follows:
- BTC:67.55%
- ETH:8.62%
- XRP:4.85%
- BCH:1.82%
- LTC:1.60%
- EOS:1.24%
- Others:15%
The Heat map here, shoes that, as usual, the whole sector moves with almost perfect correlation.
What happens
Ethereum-bases dApp FairWin has collapsed after the exposure of a vulnerability in its smart contract. Researches found the platform admins could drain the entire balance in the dApp easily, an $8 million worth of ETH stored in the platform. Researchers found $250,000 was stolen in a previous version. Source: Medium.com.
I just published 'The Collapse of FairWin’s ~$125m Ponzi Scheme' in which we detail the journey behind the rise and fall of FairWin's fraudulent project.https://t.co/GmpgWns9qc
— PhABC (@PhABCD) October 1, 2019
According to an article by condesk.com, major Libra backers Visa and Mastercard are re-thinking its participation in this digital project. Libra has been the trigger for regulators to start worrying for the irruption of digital assets and Libra has been opposed by European financial authorities saying Libra could destabilize the Euro, while the US Congress has demanded a complete halt on its development.
The Federal Reserve injects the USD worth the entire crypto market cap in days according to this article by beincrypto.com. The last one is said to add $162 billion to the total USD supply. US FED noted that it is a temporary measure.
Technical Analysis
Bitcoin
Bitcoin’s price has been losing ground after making a double top at $8,519. The MACD is dangerously approaching a bearish transition, while the price is currently sitting on the mean line of the Bollinger Band, at 8,200. That was our expectations yesterday. Thus, nothing to worry about unless weakness continues and the price keeps moving to the lower side of the Bollinger bands and challenge the $8,000 again.
Ethereum
Ethereum is moving in an ascending channel, a weak form of trending. Its price made a high at $185, then during the latest 4H candles has been retracing. At the moment of this writing, the price was held by the mid-line of the Bollinger Bands. MACD is also close to a bearish crossing. The figure created by the latest price action suggests the entire channel is a consolidation of the significant drop made on September 24. Short-term, if the price holds, we see a new test of the $185 high, although the price might go visiting the lower side of the channel.
Ripple
Ripple has retraced more than 50% of the large candlestick made on Sept. 30. Now the price is touching the upper border of the band where it had been ranging before that bullish candle. That may be a supply zone of people who wanted to go long that day but were late. That means a bounce off of this level is likely. If that does not happen, then the bullish candle was just a trap for bulls, and the movement is negated.
Litecoin
Litecoin is starting to show signs of buying interest. The price has been held by the Bollinger mean line and now has headed up. MACD is bullish, also. The movement is still feeble, and $57 acts as a resistance level, so to confirm a bullish scenario we would like to ask for a close above that level.
Related posts
 Daily Crypto Review, Oct 16 – Another Red Day in Play
 Daily Crypto Review, Oct 28 – Cryptocurrencies surging, China’s president optimistic on blockchain technology
 Daily Crypto Review, Nov 12 – Markets stale, XRP preparing for a new move
 Daily Crypto Review, Nov 13 – China’s stance on crypto skyrockets NEO’s price