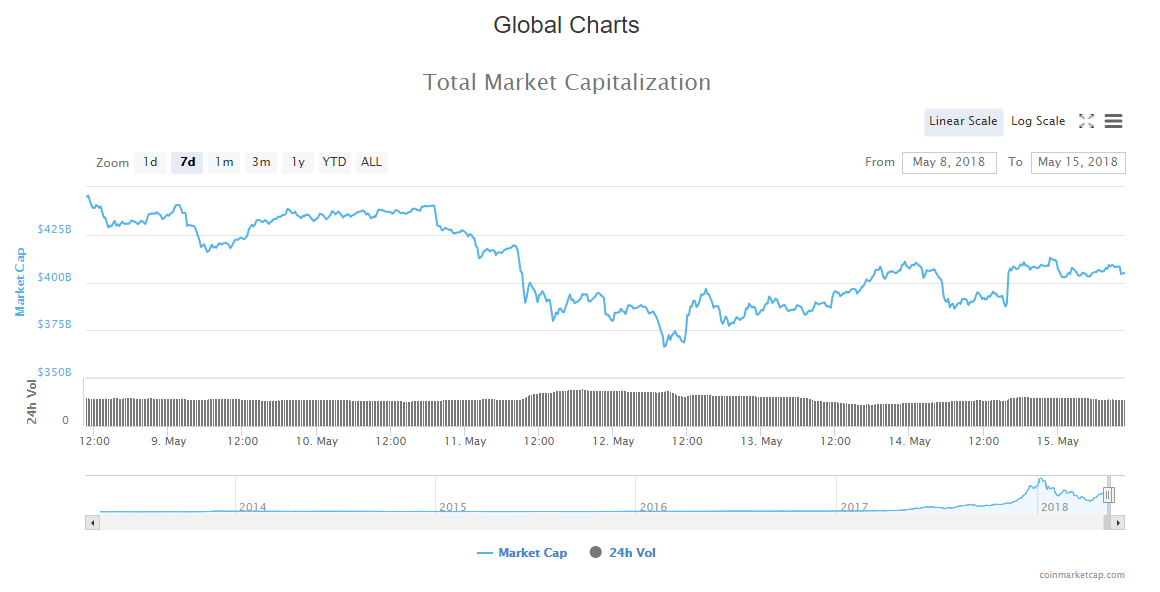
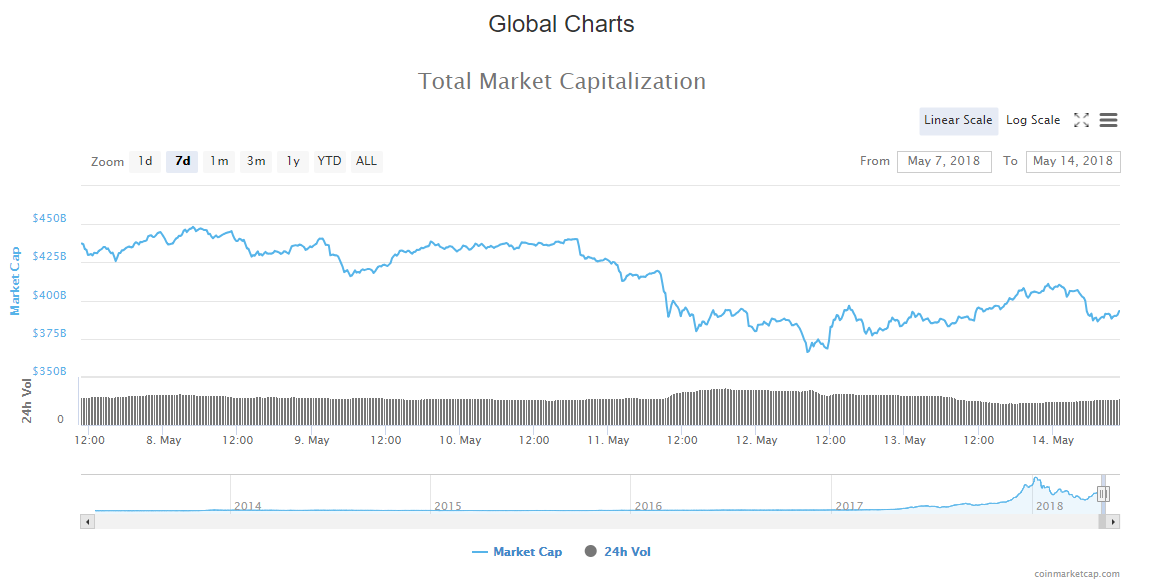
Categories
Crypto Market Analysis

Daily Crypto Update 31.07.2018 – Breakout From The Downside As Expected


General overview


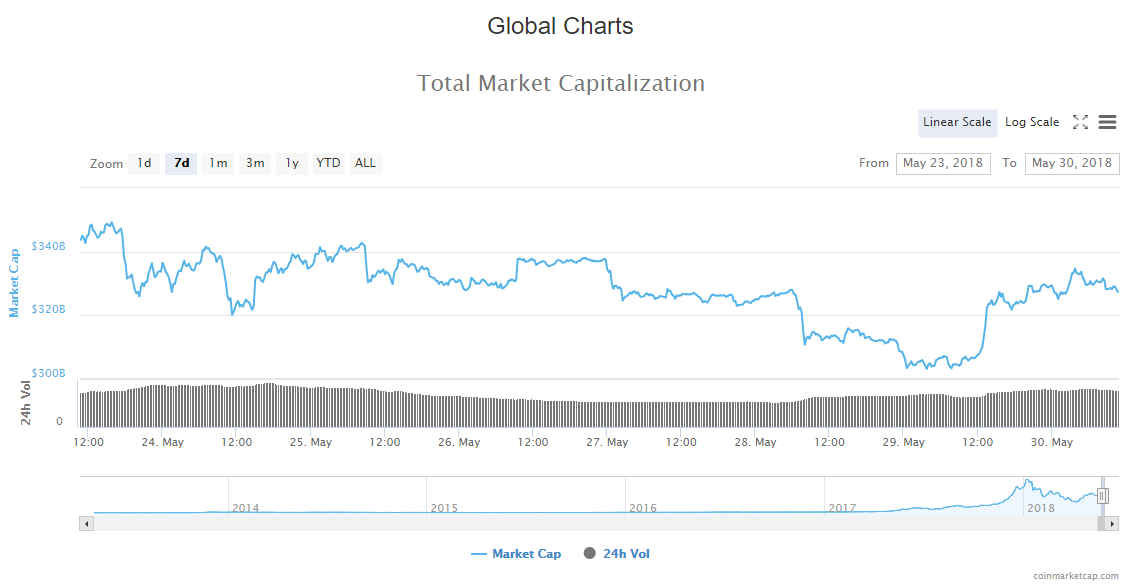
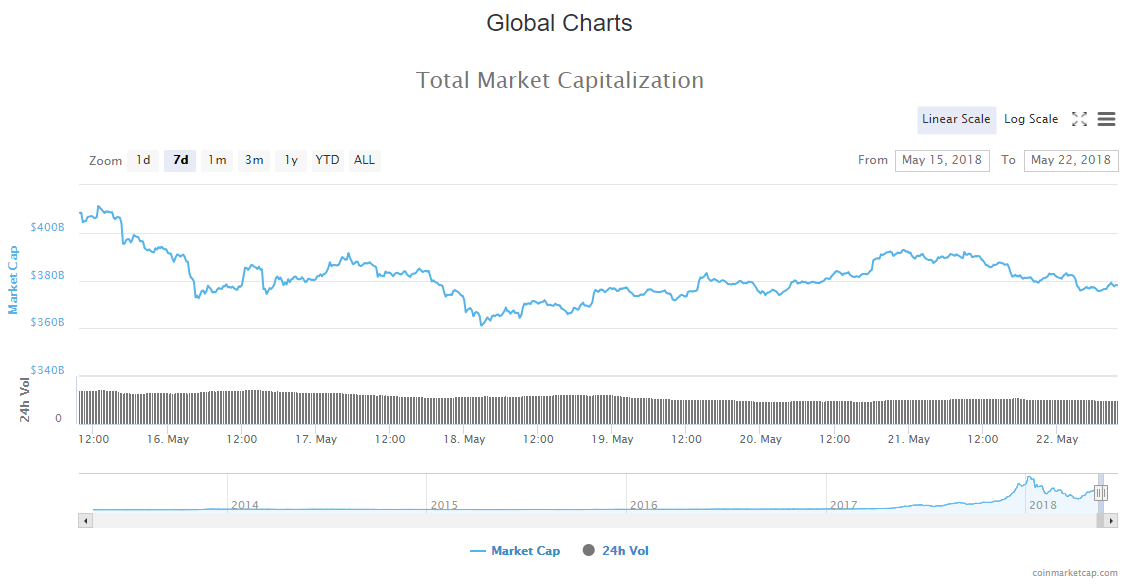
  • Market Cap: $278,463,268,852
  • 24h Vol: $15,188,740,539
  • BTC Dominance: 48.0%

From yesterday’s high at $299B the evaluation of the cryptocurrency market cap has fallen by 23 billion, as today’s low was around $276B. This was expected as a triangle pattern formed on the global chart.

Consequently, the market is currently in red with an average percentage of change among top 100 coins ranging from 3-7%.  The biggest loser is Pundi X with a decrease of 19%.


News


As the market experienced a decline in the evaluation, many headlines are analytical in nature. However, some significant headlines have come out in the last 24 hours.

Australian Government Awards Grant to Blockchain Project for Sustainable Sugar

The Australian government has granted A$2.25 million ($1.7 million) to the Sustainable Sugar Project, Foodnavigator-Asia reports July 30. The Sustainable Sugar Project, led by the Queensland Cane Growers Organization, will use blockchain technology to track the provenance of sugar supplies to Australia. The initiative known as the Smart Cane Best Management Practice (BMP) is part of a sugar industry push for better sustainability and traceability.

It isn’t the first time the Australian government has given a grant to a blockchain start-up. Power Ledger a blockchain based solar electricity solution received about 8 million dollar grant last year for further research and development.

Chamber of Digital Commerce Proposes Guidelines for ‘Responsible’ Crypto Market Growth

The Chamber of Digital Commerce Token Alliance has released a collaborative report of proposed guidelines for “responsible growth” of the cryptocurrency market, according to their July 30 press release. The document, entitled “Understanding Digital Tokens: Market Overviews & Guidelines for Policymakers & Practitioners,” is broken up into three sections: a regulatory overview of digital token markets in five countries, principles for those distributing digital tokens that are not intended to be securities, and economic coverage of the “global token landscape.”

It is an obvious attempt to provide the regulators more material on the cryptocurrency market as the SEC is more and more active in the regulation clamp down on the cryptocurrency space with little to no understanding of the underlying technology.

China: World’s Fourth Largest Bank by Assets Trials Blockchain Loans Backed by Land

The Agricultural Bank of China (ABC), the world’s fourth-largest bank by assets, has issued its first loan on blockchain, local news outlet Financial News reported July 31. State-owned ABC, which counts itself among China’s “Big Four” lenders, revealed it had issued a loan worth around $300,000 backed by a piece of agricultural land in the Guizhou province.

This headline is significant as China’s stance toward cryptocurrency was negative in the past, but it looks like they are switching the tone as they are getting more and more informed of the benefits that adopting blockchain and cryptos are carrying.

Major Swiss Online Bank Posts Soaring Profits After Offering Clients Crypto Investing

Online banking service provider Swissquote has seen a 44 percent surge in profits in the first half of 2018, an uplift attributed to the “crypto boom” earlier this year, local news outlet Finews reports July 31. In July 2017, the Swiss-based online bank was credited by many with becoming “the first” European online bank to launch Bitcoin (BTC) trading accounts for its clients.

Nobel Prize Winning Economist Paul Krugman Expresses Skepticism About Crypto, Predicts Collapse

Nobel Prize winning economist Paul Krugman has expressed his skepticism about the value of cryptocurrencies in a New York Times Opinion piece published July 31.

Source: cointelegraph


Analysis


BTC/USD

From yesterday’s open at 8265$ the price of Bitcoin has decreased by 6,21% and is currently trading at 7732$.


Looking at the two-hour chart, we can see that the price of Bitcoin has broken down the descending triangle and is currently sitting right on the 0,236 Fibonacci retracement level. This breakout to the downside of the triangle was expected and explained in yesterday’s report and because these current levels aren’t going to serve as strong support, so more downside is expected, maybe after some consolidation. If that happens and the price goes below the 0,236 Fibo level the next target would be the baseline support 2 (black dotted line) at around 7400$.


Market sentiment 

Bitcoins hourly chart technical indicators are signalling a strong sell.


Pivot points

S3 7233.1
S2 7673.6 
S1 7926.6 
P 8114.1 
R1 8367.1
R2 8554.7 
R3 8995.2

ETH/USD

From yesterday’s high at 456,9$ the price of Ethereum has dropped by 5,2% and is currently trading at 433$.


On the 2 hour chart, we can see that the breakout was real and that the price has recovered a bit to the channels support line retesting it for resistance. It looks like the price is getting rejected by those levels which is why I would expect more downfall for Ethereum in the upcoming period.


Market sentiment

Ethreum’s hourly chart technical indicator signal a sell.


Pivot points

S3 411.23 
S2 434.49 
S1 445.57 
P 457.75 
R1 468.83 
R2 481.01 
R3 504.27

XRP/USD

From yesterday’s at 0,45548$ the price of Ripple has decreased by 5,31% and is currently trading at 0,431$


Looking at the 2 hour chart we can see that the price has broken out off of the ascending channel in which it was consolidating which is why more downside is expected from here.


Market sentiment

Ripple’s hourly chart technical indicator signal a sell.


Pivot points

S3 0.40185 
S2 0.42371 
S1 0.43485 
P 0.44557 
R1 0.45671 
R2 0.46743 
R3 0.48929

Conclusion


In yesterday’s report I have discussed the possibility of a breakout from the downside for the major cryptos as well as the global chart market cap evaluation. As that happened yesterday, in the upcoming days more downside is expected for the crypto market.


Categories
Crypto Market Analysis

Daily crypto update 30.07.2018 – Consolidation Before A Breakout


General overview


  • Market Cap: $293,468,610,906
  • 24h Vol: $13,964,438,115
  • BTC Dominance: 47.7%

From yesterday’s high at 299,774,000,000$, the evaluation of the cryptocurrency market capitalization has decreased by 6,3 billion as its currently sitting at around $293,4B. As you can see from the global chart the evaluation is narrowing down in a triangle like pattern. This consolidative structure has formed as the evaluation failed to break the $300B mark, and from the current level, I would expect the evaluation to go further down to the triangle’s support around $290B. If that level holds than another attempt at the breakout on the upside can be a possibility, but a breakout from the downside is more likely to 284B level.

Following the 6,3 billion dollar decline, the market is currently in red but with a small average percentage of change among top 100 coins ranging from 1-5%. The biggest loser is Mithil which decreased by 17% in the last 24 hours.


News


In the last 24 hours, most significant headlines are those that can fit into the adoption category.

First by its adoption magnitude is the news story of Iran’s plan on creating a state-back cryptocurrency in the midst of the announced U.S. sanctions that will take effect in August. As reported by the Iranian media, a senior official within the government says that the currency could be developed in the next three months. This measure against the sanctions is definitely constructed with Venezuela’s example in mind, as they have developed their cryptocurrency ‘petro’ to surpass the imposed U.S. sanctions in 2017.

The second headline that caught my attention as I viewed it as significant is that Commonwealth Bank of Australia (CBA) successfully, facilitated a shipment of 17 tonnes of almonds from Australia to Germany and in that process tested their supply management system based on the Ethereum blockchain according to a press-release on Monday. Chris Scougall, managing director of industrials and logistics in client coverage at CBA, said in a press release.


“We believe that blockchain can help our partners reduce the burden of administration on their businesses and enable them to deliver best-in-class services to their customers,”

CBA facilitated all three key services in this type of trade deals–shipment operations, documentation and finance issues – by using the cryptocurrency technology.

The third headline by its significance in the adoption category is that Nasdaq discussed with Gemini and other crypto exchange representatives the future trends in regulation and the ways those exchanges can be in line with them as a way to improve the image of the cryptocurrency market in general, a source familiar with the matter told Bloomberg. This interest and reaching out seen by Nasdaq to the cryptocurrency exchanges certainly isn’t because they want to help other exchanges. It looks like they want to take advantage of the cryptocurrency market potential when it’s still an evolving market and push it to the mainstream providing more legality and in the end maintaining their position as the operator of one of the worlds largest exchanges.

In April, Bloomberg reported that “Gemini partnered with Nasdaq to use its advanced surveillance system to prevent and control market manipulations.” and they have confirmed last week that they are offering their technological solution to SBI Virtual Currencies and three other cryptocurrency exchanges that were not disclosed.

This is very important especially when the Winklevoss brothers, Bitcoin Trust application for an ETF was declined again with an explanation that The Securities and Exchange Commission doesn’t find the product safe enough for investors. The SEC said that it cannot “conclude that bitcoin markets are uniquely resistant to manipulation.”

So potentially is Nasdaq provides the solution to that problem with their surveillance technology that can provide more certainty for the SEC to approve a Bitcoin ETF soon.


Analysis


BTC/USD

From yesterday’s open which is also yesterday’s high at 8276$ the price of Bitcoin has decreased by 1,84% as its currently trading at 8128$.


As it can be seen on the hourly chart, the price action has formed a descending triangle and is currently interacting with its support levels. Descending triangle pattern usually breaks from the downside and that already happened on Friday but the price action found itself back in it again, which means that buyers are there. This triangle pattern is similar to that on the global chart, so I would expect a breakout soon. This pattern could be interpreted as a bull flag buy investors and traders and they might act accordingly – buying at support, which would result in a breakout to the upside. However, that is highly unlikely.


Market sentiment 

Hourly chart technicals support the bearish scenario as they signal a sell.

Oscillators are signaling a sell, and moving averages a strong one.


Pivot points

S3 7838.5 
S2 8028.8 
S1 8124.9 
P 8219.1 
R1 8315.2
R2 8409.4 
R3 8599.7

ETH/USD

From yesterday’s open and high at 471,3$ the price of Ethereum has decreased by 3,65% as its currently trading at 453$.


Looking at the hourly chart we can see that the price of Ethereum has broken out off of the ascending channel on the downside and judging by the size of that red candle it isn’t an interaction with the support that will result as a wick on the higher time-frame like it did prior three times. As I think Ethereum is lagging behind Bitcoin, and it didn’t retest the prior low on the daily chart, this breakout is going to push the price of Ethereum significantly down in the upcoming period – if the breakout doesn’t end like a fakeout that is.


Market sentiment 

Ethreum’s hourly chart technicals signal a sell.


Pivot points 

S3 444.41 
S2 455.61 
S1 461.04 
P 466.82 
R1 472.25 
R2 478.03 
R3 489.24

XRP/USD

From yesterday’s open at 0,454$ the price of Ripple has decreased by 2,5% and is currently trading at 0,442$.


On the hourly chart we can see that the price of Ripple is in a similar position like the price of Ethereum – its on the support levels of the ascending channel, but unlike the Ethereum, Ripple’s price is just starting to interact with it. As the price struggled to exceed the 0,453$ level where 0 Fibonacci retracement level is this decline is the logical progression of the price pathway. If we have in mind the global chart, the Bitcoin chart and the Ethereum’s potential breakout, we can say that a breakout on the downside should be expected.


Market sentiment 

Hourly chart technical indicators are signaling a sell.


Pivot points 

S3 0.43719 
S2 0.44567
S1 0.44939
P 0.45415 
R1 0.45787
R2 0.46263 
R3 0.47111

LTC/USD

From yesterday’s open at 85,118$ the price of Litecoin has decreased by 5,27% as its currently sitting at 80,786$.


On the hourly chart, we can see that yesterday’s open was on the triangles resistance line which again rejected the price and has sent it on a downward trajectory. The price is currently sitting on the minor range support, but I am expecting it to continue going down to the ascending channels support at around 78,111$.


Market sentiment

Like in the case of other cryptos, Litecoin’s hourly chart technical indicators are signaling a sell.


Pivot points 

S3 80.043 
S2 82.184 
S1 83.130 
P 84.325 
R1 85.271 
R2 86.466 
R3 88.607

Conclusion


As the prices of four major cryptocurrencies are interacting with their minor support levels, and Ethereum is showing early stages of a breakout, more downside is expected in the upcoming period for the cryptocurrency market. Bitcoin’s chart is similar to that of global pattern wise, and this doesn’t come as a surprise as Bitcoin’s dominance has increased to 47,7%. On the global chart, we have seen an attempt to break the $300B mark, after which the market is consolidating. After the consolidation, a breakout on the downside is most likely, but it is also possible that buyers make another attempt at breaking that level. If that happens, and I hope it does the prices will go further up but not that further as sellers are just waiting for a better price to dump their holdings.

I hope this happens as it would be a healthy move for the market thus making further projections more accurate. This would result in dumb money getting dumped on which would cause them to give up buying and those who are willing to sell are going to push the prices down where they should have gone.

Categories
Crypto Market Analysis

Daily crypto update 24.07.2018 – Recovery Continues


General overview


Market Cap: $298,408,763,099

24h Vol: $20,100,077,895

BTC Dominance: 47.0%

From yesterday’s open at around $280B the evaluation of the cryptocurrency market has increased by 20 billion dollars as it is currently sitting just slightly below 300B.

As you can see from the chart above it has entered the seller’s territory and that resistance is pushing the evaluation down, but buyers are aggressive which is why there’s a cluster forming around those levels.

The market is mostly in green with an average percentage of change among top 100 coins ranging from 3-6%.


News


In the last 24 hours, the most significant headlines are essentially positive in sentiment, but there aren’t any major headlines that are causing this bullish sentiment fundamentally. These are some of the headlines:

Gibraltar Stock Exchange’s Blockchain Platform Opens to Public Trading

The UK Overseas Territory of Gibraltar launched its Gibraltar Blockchain Exchange (GBX) July 23, a press release confirmed, opening up cryptocurrency trading.

TRON Acquires Major P2P Platform Operator BitTorrent

TRON’s long-rumoured acquisition of BitTorrent Inc., the operator of popular torrent client uTorrent, has been confirmed by TRON founder Justin Sun in a community letter published July 24

Google to Offer Distributed Ledger Solutions in Cloud Platform Marketplace

Google is joining the list of tech giants to deploy blockchain technology to offer customers fintech and cloud service solutions, according to an official statement Monday, July 23.

Crypto Exchange Giant Binance to Launch Operations in South Korea: Report

Binance, the world’s largest cryptocurrency exchange by trading volume, is reportedly planning to enter South Korea, one of the world’s major crypto trading markets.

Many headlines are analytical in nature and in favor of the bullish sentiment. Some of the headlines that fit into that category are the following:

$300 Billion: Cryptocurrency Market Cap Hits Major Milestone as Bitcoin Soars

Prominent Investors Bullish on Bitcoin Reaching $8,100 With Strong Volume

Bitcoin Price Blitzes to $8,200 but Wider Crypto Markets and Tokens Suffer


Analysis


BTC/USD

In the last 24 hours, the price of Bitcoin has increased by 11,2% coming from 7380$ to 8182$ where it is currently trading.


Looking at the hourly chart, we can see that the price has broken the triangle resistance line and is blazing upwards exponentially. The price has found resistance and has retraced since the spike up to 8362$. Since the price has increased exponentially, a retracement is expected.


Market sentiment 

Bitcoin is in the buy zone.


Pivot points

S3 6745.9 
S2 7191.9 
S1 7455.9 
P 7637.9 
R1 7901.9
R2 8083.9 
R3 8529.9

ETH/USD

From yesterday’s low at 448$ the price of Ethereum has increased by 6,36% and is now trading at 476$.


As you can see on the hourly chart the price has gone to channels resistance line and found support there. Currently, it is at the midpoint of the channel and judging by the cluster a retracement should be expected.


Market sentiment 

Hourly chart technicals signal a buy.


Pivot points

S3 406.20 
S2 430.80 
S1 440.20 
P 455.40 
R1 464.80 
R2 480.00 
R3 504.60

XRP/USD

From yesterday’s open at 0.448$ the price of Ripple has risen by 2,16% and is now sitting at 0,458$.


As you can see from the hourly chart, the price went even further to 0,468$ but since it went above the 0 Fibo level, it had to pull back to retest it for support.


Market sentiment 

Ripple is in the buy zone.


Pivot points

S3 0.40488
S2 0.42765 
S1 0.43633 
P 0.45042 
R1 0.45910 
R2 0.47319 
R3 0.49596

Conclusion


As the prices increased over the last couple of days, new participants are coming into the market which is why we have seen this small increase over the last 24 hours. Recovery continues but for how long we are yet to see.

Categories
Crypto Market Analysis

Daily crypto update 20.07.2018 – Uptrend Confirmation


General overview


Market Cap: $284,394,661,536

24h Vol: $16,128,684,818

BTC Dominance: 45.0%

From yesterday’s level, the evaluation of the cryptocurrency market capitalization has decreased by 4 million dollars which is not that significant. As you can see on the chart below the evaluation has formed a plateau. 

The market is mixed in colors, with an average percentage of change among top ranging from 2-4%.


News


Looking at the headlines that came out in the last 24 hours I see that many are analytical in nature as everyone is now speculating on whether the cryptocurrency market has reached its bottom, because of the rebound that the market has experienced.

Some of the headlines that fit that category are the following:

Bitcoin Rally Converts Staunch Bear, Sees Price Breaking Above US$8,000

Billionaire Investor Says No One Wants to Buy Bitcoin, Market Shows Otherwise

‘I’d Like to See Us Test $5,000’: BitMEX CEO Pragmatic on Bitcoin Price Rise

Bitcoin Price and Seasonality: The Coming Rally?


Analysis


BTC/USD

From yesterday’s open at 7290$ the price of Bitcoin has increased by 2% and is currently sitting around 7467$.


As you can see from the hourly chart the price action is testing the resistance line of the prior triangle support (bold blue line) and has formed a symmetrical triangle around it. The breakout looks near and judging by the steepness of the support line it looks like buyers are more aggressive at the moment which is why a breakout on the upside is more likely, but not by more than 15% likely.


Market sentiment

Hourly chart technicals signal a buy.

Moving averages are signaling a strong buy.


Pivot points

S3 6881.1 
S2 7159.7 
S1 7316.6 
P 7438.3 
R1 7595.2 
R2 7716.9 
R3 7995.5

ETH/USD

From yesterday’s high at 483$ the price of Ethereum has fallen by 4% as its currently sitting at 464$ level.


As it can be seen on the hourly chart, the price action is in the channel and currently in the lower midpoints of the channel. As the market is correlated, if the price of Bitcoin goes up so will the price of the Ethereum to the channels resistance line at least.


Market sentiment 

Hourly chart signals a sell.


Pivot points

S3 428.44 
S2 450.16 
S1 459.40 
P 471.88 
R1 481.12 
R2 493.60 
R3 515.32

XRP/USD

From yesterday’s open at 0.493$ the price of Ripple fell to 0.448$ level but has recovered since and is currently sitting at 0.462$ which is an overall 6,35% decrease


Looking at the hourly chart we can see that the price fell steeply and quickly which indicates that the demand was not that strong, but currently, we are seeing a higher low which is an indicator of a starting uptrend.


Market sentiment 

Hourly chart technicals signal a sell.


Pivot points

S3 0.43408 
S2 0.45760 
S1 0.46732
P 0.48112 
R1 0.49084
R2 0.50464 
R3 0.52816

Conclusion


Today is a very important day because we will see either a confirmation that the uptrend started or an invalidation, and a shift toward a short-term recovery in a downtrend scenario.

Categories
Crypto Market Analysis

Today´s Crypto Events 19.07.2018

Here you can find all the news about the upcoming hard fork, releases, exchange listings, updates, conferences, new launches, etc. We gather the most relevant events and conferences for you to pick from.


Today´s Crypto Events 19.07.2018


  • VeChain (VEN) — Distributed 2018 Conference in San Francisco
  • Augur (REP) — Distributed 2018 Conference in San Francisco
  • BAT Basic Attention Token (BAT) — Distributed 2018 Conference in San Francisco
  • Ripple (XRP) — Distributed 2018 Conference in San Francisco
  • AirSwap (AST) — Distributed 2018 Conference in San Francisco
  • Po.et (POE) — Distributed 2018 Conference in San Francisco
  • Qtum (QTUM) — Distributed 2018 Conference in San Francisco
  • Enigma (ENG) — Distributed 2018 Conference in San Francisco
  • ZCoin (XZC) — Distributed 2018 Conference in San Francisco
  • Leverj (LEV) — Distributed 2018 Conference in San Francisco
  • Genaro Network (GNX) — Distributed 2018 Conference in San Francisco
  • Maker (MKR) — Distributed 2018 Conference in San Francisco
  • ZenCash (ZEN) — Meetup in Los Angeles
  • Zilliqa (ZIL) — Meetup in Seoul
  • Stellar (XLM) — Blockchain Meetup in San Francisco
  • WeTrust (TRST) — AMA Session
  • Propy (PRO) — Meetup in Seoul
  • ZenCash (ZEN) — Super Nodes Launch
  • ColossusXT (COLX) — CryptalDash Exchange Listing
  • HempCoin (THC) — Coin Swap on Bittrex Exchange
  • Endor Protocol (EDR) — BitForex Exchange Listing
  • Bluzelle (BLZ) — AMA on Telegram
  • Silent Notary (SNTR) — DEx.top Exchange Listing
  • Docademic (MTC) — DEx.top Exchange Listing
  • Streamr DATAcoin (DATA) — StartupAutobahn Demo Day in Stuttgart
  • The Abyss (ABYSS) — Pre-Alpha Digital Distribution Platform Release
  • Civic (CVC) — Distributed 2018 Conference in San Francisco
  • Kyber Network (KNC) — DappCon in Berlin
Categories
Crypto Market Analysis

Daily Crypto Update 19.07.2018 – Another Burst Expected


General Overview


Market Cap: $287,548,026,731

24h Vol: $18,483,342,934

BTC Dominance: 43.8%

Since yesterday’s high at just slightly below $300B, the evaluation of the cryptocurrency market cap has retraced a bit and is currently sitting around $287,5B. Since today’s open the evaluation has flattened out much like it did before yesterday’s increase. 

Consequently, the market is in red with an average percentage of change among top 100 coins ranging from 3-6%.


News


As the market showed significant gains in the last day, many news headlines are analytical in nature, promoting the idea that the market reached its bottom.

For example, Barry Silbert, founder and chief executive officer of venture capital Digital Currency Group, said he is bullish on Bitcoin (BTC) as an investment vehicle, CNBC reported July 18.

Speaking at the Delivering Alpha Conference in New York on Wednesday, Silbert said that he thinks “we’ve probably hit the bottom for the year. I actually put some money into Bitcoin last week.” He added that “as an asset class it is here to stay … I’m 100 percent confident a decentralized, non-fiat form of money is here to stay.”

The most significant event in the last 24 hours in the US Congress hearing regarding cryptocurrency regulation entitled “The Future of Money: Digital Currency”. The news is neither positive or negative but at the moment as this is a discussion on which the regulatory framework is going to be built.  At the hearing, the Subcommittee on Monetary Policy and Trade discussed the deployment of cryptocurrency and its underlying technology, blockchain, by central banks, arguing whether central banks should introduce a central bank digital currency, and there are views supporting both cases.

Witnesses before the U.S. House of Agriculture Committee at a public hearing July 18 were unanimous in their view that digital assets complicate the hard and fast distinctions of existing regulatory frameworks.

We will be closely monitoring what policymakers have to say as their action could impact the market in both ways.


Analysis


BTC/USD

From yesterday’s open at 7319$ the price of Bitcoin went up to 7514$ and since then it has retraced to 7315$ forming a cluster around those levels, and currently, we are seeing a breakout from that cluster on the upside as the price is on a green candle around 7400$.


As you can see from the hourly chart it looks like the price is ready for another exponential increase, and if that happens I would expect the price to around 7834$ where the black downward pointing line is, which is the resistance line from the triangle on the higher time frame.


Market sentiment 

Bitcoin is in the buy zone.


Pivot points 

S3 6721.6 
S2 7063.1 
S1 7221.3 
P 7404.6 
R1 7562.8 
R2 7746.1 
R3 8087.6

EOS/USD

From yesterday’s open at 8,89$ the price of Eos has at first increased to 9,14$ and fallen to 8,37$ after. Since like in the case of Bitcoin a cluster has formed and now we are seeing a breakout on the upside.


On the hourly chart, we can see that the price is below the 8,69$ level which is a significant resistance level, and you can see that the price went below it quickly. If that level gets broken I am expecting the price to go to the next Fibo level which would in the price terms be around 10,4$.


Market sentiment 

Eos is in the buy zone.


Pivot points

S3 6.9916 
S2 7.8954
S1 8.2502 
P 8.7992 
R1 9.1540 
R2 9.7030 
R3 10.6068

XMR/USD

From yesterday’s open at 143,9$ the price of Monero has increased at first but fallen after to 138$, and currently, we are seeing the start of another uptrend as the price is currently sitting around the same levels of yesterday’s open.


Looking at the hourly chart we can see that the price went above the triangle’s resistance, but we still cannot say that it broke out as these fakeouts happened in the past, but judging but the bounce off of the resistance line I think that the support is found for the price to continue upward.


Market sentiment 

Monero is in the buy zone.


Pivot points

S3 117.387 
S2 129.917 
S1 134.893 
P 142.447 
R1 147.423 
R2 154.977 
R3 167.507 

Conclusion


As the confirmation of the uptrend happened yesterday and the first minor retracement happened, fear of missing out will kick in and the prices are going to be pushed higher which is why we are going to see some recovery in the market in the following days.

Categories
Crypto Market Analysis

Daily Crypto Update 17.07.2018 – Trend Continuation Or A Retracement


General Overview


Crypto Trend Analysis:

Market Cap: $271,154,252,040

24h Vol: $15,384,760,656

BTC Dominance: 42.5%

In the last 24 hours, the evaluation of the cryptocurrency market capitalisation has increased from 254,441,000,000$ which was yesterday’s low, to 273,729,000,000$ which is today’s high. Since this high, the evaluation has retraced slightly.

Crypto Trend Analysis

The market is in green with an average percentage of change by around 5%. The biggest gainer is Tenx with an increase of 31% while there are others like Powerledger, Enigma, Loom Network, WAX around 15%.


News


Top headlines that came out in the last 24 hours are mostly positive in sentiment. First among the significant headlines that already impacted the market in a positive way is that Robinhood listed Dogecoin (DOGE) on its Robinhood Crypto platform, which leads to an increase of 16% over the last 24 hours for this cryptocurrency.

Another significant headline in the similar category is that Coinbase got regulatory approval to list coins considered a security. 

Cryptocurrency exchange and wallet service provider Coinbase has received approval from the U.S. Securities and Exchange Commission (SEC) and the Financial Industry Regulatory Authority (FINRA) to list digital coins considered to be securities, Bloomberg reported July 16.

Third in the line of the similar headlines is that BitPay received BitLicense from New York Department of Financial Services.

Global crypto payments processor BitPay has been granted a BitLicense by New York state’s financial regulator, according to a press release shared with Cointelegraph July 16. The recently acquired virtual currency license from New York’s Department of Financial Services (NYDFS) will allow BitPay to do business with customers and companies based in the state. Additionally, New York-based businesses will be able to use BitPay to accept Bitcoin (BTC) and Bitcoin Cash (BCH) for purchases from users worldwide.


Crypto Trend Analysis


BTC/USD

From yesterday’s open around 6,350$, the price of Bitcoin has increased by 5.68% as its currently sitting around the 6,702$ level.


Looking at the hourly chart we can see that the price interacted with the minor resistance line and has been rejected by it, which is why it has retraced slightly. Currently, we are seeing a lower high being formed just slightly lower than the prior ones which might be an indicator of the downtrend starting, but it can also be a retracement before a breakout on the upside.


Market sentiment

Hourly chart signals a buy.

Oscillators are on neutral and moving averages signal a strong buy.


Pivot points

S3 5756.3 
S2 6179.2 
S1 6454.2 
P 6602.1 
R1 6877.1 
R2 7025.0 
R3 7447.9

ETH/USD

From yesterday’s open at 446$, the price of Ethreum has increased by 6% and is currently sitting around 473$.


On the hourly chart, we can see a similar pattern like on Bitcoin’s chart. The price has entered sellers territory which is why it has retraced since the spike at the 481$ level. Currently, the price is on the minor range support where it is testing for the support. If the support is found I would expect a breakout from the upside, but if not, I am expecting the price to fall back to the 445$ level which served as support recently.


Market Sentiment

Hourly chart signals a buy.

Oscillators are on sell and moving averages are signalling a buy.


Pivot Points

S3 396.67 
S2 432.54 
S1 455.82 
P 468.41 
R1 491.69 
R2 504.28 
R3 540.15 

XRP/USD

In the last 24 hours, the price of Ripple has increased by 7%, from 0.443$ to 0.474$.


Looking at the hourly chart, again, we can see a similar price action pattern like on Bitcoin’s and Ethereum’s chart. The price found first resistance significant enough to be rejected by those levels and has currently retraced to minor support level testing for support.


Market Sentiment

Hourly chart technicals are signaling a buy.

Oscillators are on a sell and moving averages on a buy.


Pivot points

S3 0.38614 
S2 0.42809 
S1 0.45526 
P 0.47004 
R1 0.49721 
R2 0.51199 
R3 0.55394

 Conclusion


Judging by the position of the market cap evaluation as well as the charts analysed in today’s report, I conclude that the prices have found first resistance and the sellers are on the alert. Today we will see either a breakout on the upside if the sellers don’t get nervous and let the buyers push the price, or, a retracement of this uptrend to the first support levels. I think the second scenario is more likely because in order for the prices resistance to be broken, strong support is needed and there is none on the current levels.

Categories
Crypto Market Analysis

Daily crypto update 10.07.2018 – Panic selling


General overview


Market Cap: $253,116,207,195

24h Vol: $13,918,432,489

BTC Dominance: 43.3%

In the last 24 hours the cryptocurrency market capitalization fell from 276,940,000,000$ which was yesterday’s high to around $253B where it is currently sitting.

The market is consequently in red with an average percentage of change among top 100 coins being 11,4%.


News


There aren’t any fundamental news that is causing this crash that we are seeing in the market. There are some negative news headlines nevertheless but they aren’t that significant to cause this panic selling.

Harmless for Now, Dangerous in the Future: Here’s What EU Researchers Think of Cryptocurrencies

On July 9, a “Monetary Dialogue” session was held by the Committee on Economic and Monetary Affairs Committee (ECON) of the European Parliament. It’s a quarterly conference that is directly interlinked with the European Central Bank (ECB): Every three months, the president of the ECB (or, occasionally, another representative) appears before the Committee to report on the state of monetary policy in the union.

Exclusive: Following ‘Security Breach,’ Bancor Expects to Be Online in 24 Hours

Bancor halted operations this Monday due to an investigation of a “security breach,” which involved more than $12 million. The platform confirmed the breach on its Twitter account, saying that “no user wallets were compromised.” The cybercriminals reportedly exchanged some of the tokens through conversion service Changelly. Sources familiar with the matter told Cointelegraph that the stolen tokens included Bancor’s native token BNT, about 25,000 Ethereum (ETH) ($12.2 million), and 300,000 Pundi X (NPXS) ($1,200).

Former World Bank Chief Economist: Bitcoin Will Fail as Governments Increase Regulation

Three major American economists have recently spoken negatively about Bitcoin’s (BTC) chances for survival in an interview with Financial News today, July 9. Joseph Stiglitz, Kenneth Rogoff, and Nouriel Roubini all made statements arguing that Bitcoin will fail as a currency, namely criticizing the cryptocurrency’s absence of intrinsic value and its price volatility. Stiglitz, a Nobel Prize-winning economist and professor at Columbia University, in particular criticized Bitcoin’s anonymity, which he argued contradicts the idea of creating “a transparent banking system.”

Source: cointelegraph


Crypto Market Analysis


BTC/USD

From yesterday’s high at 6730$ the price of Bitcoin has fallen by 5,43% and is currently sitting at 6364$.


Looking at the hourly chart we can see that the support line at yesterday’s levels was broken with a massive red candle as the uncertainty overruled the market, so the price fell to the next support level is found. This support level can’t hold the momentum behind the move which is why I am expecting more downside in the following days.


Market sentiment 

Bitcoin is in the sell zone.

Oscillators signal a buy, but moving averages signal a strong sell.


Pivot points

S3 6294.4 
S2 6497.8 
S1 6582.3 
P 6701.2 
R1 6785.7 
R2 6904.6 
R3 7108.0

ETH/USD

From yesterday’s high at 484$ the price of Ethereum has decreased by 10,46% as its currently 433$.


As you can see from the hourly chart, the price fell steeply which is a strong indicator that the sell of has begun. The price found some temporary support on the first significant level, but as this levels isn’t that strong we can expect a small consolidation before another drop.


Market sentiment 

Ethereum is in the sell zone as indicated by hourly chart technicals.


Pivot points

S3 437.46 
S2 456.74 
S1 464.14 
P 476.02 
R1 483.42 
R2 495.30 
R3 514.58

XRP/USD

From yesterday’s high at 0.481$ the price of Ripple has fallen by 7,1% and is currently sitting around 0.446$


Looking at the hourly chart we can see that the price has fallen below the 0 Fibonacci retracement level which is the level of the prior low on the daily chart. As the momentum is strong I am expecting this downtrend to continue.


Market sentiment 

Hourly chart technicals signal a sell.


Pivot points

S3 0.45342
S2 0.46450 
S1 0.46889 
P 0.47558 
R1 0.47997 
R2 0.48666 
R3 0.49774

Conclusion


In my yesterday’s update I have stated that the uncertainty may cause panic selling, and that is exactly what happened. Now that the sell-off has started I am expecting the prices to create lower lows which would in the case of Bitcoin be around 5500$.

Categories
Crypto Market Analysis

Daily Crypto Update 09.07.2018. – Uncertainty May Cause Panic Selling


General Overview


Market Cap: $274,298,138,355

24h Vol: $11,514,339,284

BTC Dominance: 42.5%

Yesterday the evaluation of the cryptocurrency market capitalization increased from 266,452,000,000$ to 280,836,000,000$ at its highest point. Since then the evaluation has decreased and is currently sitting around $274B.

Crypto Price Analysis

The market is showing mixed colours but the dominant one is red. Average percentage change among top 100 coins is ranging from 1-4%. The biggest loser is Bitcoin Diamond who decreased by 20% in the last 24 hours, while the biggest gainer is DigiByte with an increase of 14%.


News


There aren’t any significant headlines that came out in the last 24 hours that could impact the market sentiment.

Headlines are mostly analytical in nature because of yesterday’s rise. The only headline that could impact the price of a particular coin is the one regarding Ontology (ONT).

According to the press release the Mainnet launch has been successful and the Ontology blockchain is now live. This could impact the price of this coin as it will gain confidence in the followthrough from the original idea.


Crypto Price Analysis


BTC/USD

On Saturday the price of Bitcoin spiked up from 6524$ to 6765$ which was also the opening price on yesterday’s open. Since that high, the price of Bitcoin has retraced a bit, by 0.9% which is not a significant change.


As you can see from the hourly chart the price went above the minor resistance, and has retraced to its levels again for a retest of support, and has interacted with the levels 2 times so far. If the price fails to hold at these levels I would be expecting a downtrend to start to the lower low, but if it holds I am expecting the uptrend to continue.


Market sentiment 

Hourly chart technicals signal a buy.


Pivot points 

S3 6453.4 
S2 6589.2 
S1 6648.1 
P 6725.0 
R1 6783.9 
R2 6860.8 
R3 6996.6

ETH/USD

From yesterday’s opening at 486$, the price of Ethereum has first gone up to 491$ which was yesterday high but has retraced since below the levels of the opening at 480.50$.


Looking at the hourly chart we can see that the price is below the minor resistance line, that was bearly crossed which means that the price has entered the seller’s territory. The price is looking like its consolidating inside the minor support area, and similarly to the price of Bitcoin, is showing signs of indecision. If the price breaks out from this minor range, I would expect the downtrend to start to new lows, but if it goes up the price could recover significantly.


Market sentiment

Ethereum is in the sell zone, as indicated by hourly chart technicals.


Pivot points

S3 459.43 
S2 473.79 
S1 479.95 
P 488.15 
R1 494.31 
R2 502.51 
R3 516.87

NEO/USD

From yesterday’s high of 40.50$, the price of Neo has decreased by 5.44% as its now sitting at 38.42$.


As you can see from the daily chart, the price of Neo has been rejected by the support area which now serves as resistance, which propelled the price in a downward trajectory. Currently, the price is below the minor resistance line and is struggling to get above it, judging by the cluster that the price action formed.


Market sentiment

Neo is currently in the sell zone.


Pivot points

S3 34.88 
S2 37.22 
S1 38.11 
P 39.55 
R1 40.44 
R2 41.89 
R3 44.23

ONT/USD

The news of the Mainnet launch hasn’t impacted the price of Ontology, but as the press release was posted only an hour ago, the reaction is yet to be seen. The price of Ontology is in a downtrend from 25.06.2018 which is why this news may serve as a catalyst for a recovery.


Looking at the hourly chart, we can see that the price interacted with the descending channels support line on today’s opening, which resulted in an increase but it was short-lived, as the price is again on the same levels.


Market sentiment 

Hourly chart technicals signal a strong sell.


Pivot points

S3 0.0006199 
S2 0.0006495 
S1 0.0006610 
P 0.0006791 
R1 0.0006906 
R2 0.0007087 
R3 0.0007383

Conclusion


As the prices increased over the weekend, today is the retracement day. The price is, in my mind, on the crucial breaking point as everyone is expecting the uptrend to continue, but there aren’t any new buyers coming in, in the midst of the uncertainty. I think that from here the price will fall which would cause another panic sell.

Categories
Crypto Market Analysis

Daily crypto update 04.07.2018 – Another Low Coming Before The Recovery


General Overview


Coin Capital Market Cap: $272,844,346,322

24h Vol: $15,104,000,275

BTC Dominance: 42.0%

From this morning, the cryptocurrency market cap has increased by aproximately 10 billion, the evaluation coming to 277,181,000,000$ at the higest point.

Coin Capital Market

As you can see from the global chart, that area is clearly the seller’s territory, so the evaluation retraced from those levels as selling was activated.

The market is still in green as the prices haven’t retraced more than they have increased over the 24 hour period.


News


There aren’t any significant headlines that have come out from this morning. The only one that is worth mentioning is that the cryptocurrency exchange Binance has now resumed services after it announced the suspension of all trading and withdrawals, as reported by cointelegraph.

The temporary suspension was due to an alert over “irregular” Syscoin (SYS) trades “from a number of API users.” Binance subsequently chose to suspend trading, withdrawals and other account functions, as well as to take a series of further measures in order to protect its users.

Another headline that is worth mentioning is that UK housing minister Eddie Hughes released a report into blockchain July 4, calling on the government to “show leadership” by making the technology and its benefits a priority.

The report, ‘Unlocking Blockchain,’ makes several key proposals, using state projects currently underway in Estonia as the standard authorities should follow at home.

“The state should focus its attention on using blockchain to enable social freedom, to increase efficiency, and to rebuild societal trust,” Hughes summarises.

Source: cointelegraph


Analysis


ETH/USD

From today’s low at 454$, the price of Ethereum has increased by 4.25% as it is currently sitting at 474.40$.


Looking at the hourly chart, we can see that the latest high was lower than the last, and it looks like this may be the start of a descending channel of some kind, but currently, we are seeing another attempt to break that resistance, as the green candle is on its levels.


Market sentiment 

Ethereum is in the buy zone.


Pivot points

S3 414.42 
S2 442.08 
S1 452.05 
P 469.74 
R1 479.71 
R2 497.40 
R3 525.06

EOS/USD

From today’s low at 8.64$ the price of EOS went to 9.28$ and has retraced since to 9$ which is an overall increase of 4.76%.


Looking at the hourly chart, we can see that the 9.20$ levels are where the prior top was and that area serves as strong resistance. Now that the price has failed to break that resistance once again I am expecting the price to drop to around 8.50$.


Market sentiment 

Hourly chart technicals signal a buy.

Oscillators are on neutral and moving averages signal a strong buy.


Pivot points 

S3 7.5413
S2 8.2669 
S1 8.5395 
P 8.9925 
R1 9.2651 
R2 9.7181 
R3 10.4437

XMR/USD

From today’s low at 136$, the price of Monero increased by 3.44% and is currently 141.70$.


Looking at the hourly chart we can see that the price is currently interacting with the median line of the pitchfork, and I am expecting it to go further down to create a higher low.


Market sentiment 

Monero is in the buy zone.


Pivot points

S3 123.033
S2 131.213 
S1 134.787 
P 139.393 
R1 142.967 
R2 147.573 
R3 155.753

ADA/USD

From today’s opening at 0.147$, the price of Cardano has increased by 5.13% coming to 0.1558$.


As you can see, the price went higher to the resistance at 0.16$ and has retraced since to the mid-range support line. I am expecting the price to break the support and go further down to the next support levels at 0.146$.


Market sentiment 

Cardano is in the buy zone.

Moving averages signal a strong buy.


Pivot points

S3 0.078
S2 0.104
S1 0.121
P 0.13
R1 0.147
R2 0.156
R3 0.186

Conclusion


Coin Capital Market: After the prices have been increasing rapidly in the last 24 hours, we are seeing interaction with first significant resistance levels, and this retracement as the result of that. I am expecting that tomorrow will be another green day.

Categories
Crypto Market Analysis

Daily Crypto Update 03.07.2018 – Slight Retracement After The Pop


General Overview


Market Cap: $272,980,602,705

24h Vol: $16,028,501,689

BTC Dominance: 41.6%

From yesterday’s high at around $270B, the cryptocurrency market capitalisation has increase by 2 billion in evaluation.

Crypto Coins News

The market is in green with an average percentage of change among top 100 coins ranging from 5-8%. Biggest gainers are Syscoin 24%, Loom Network 22%, Wax 46%, Ethos 21.89%.


Crypto Coins News


There aren’t any fundamental reasons for the green day we are seeing as there is no major news that is changing the market’s sentiment, so the recovery is based on the price action and the perceived relative value of the cryptocurrencies.

There is news regarding blockchain adoption and utilisation, as well as governmental relation to crypto.

For instance, Bank of Finland released a paper titled “The Great Illusion of Cryptocurrencies,” written by Aleksi Grym, Adviser on Digitalisation and Head of the Digital Central Bank process in the Financial Stability and Statistics Department. The main point of the paper is to explain how cryptocurrencies fundamental nature “shows how poorly understood the concept of money itself still is today” and how the Internet and social media have “muddled our sense of fact and fiction”.

Meanwhile, Japanese financial regulator the Financial Services Agency (FSA) is considering to change the legal basis for how it regulates cryptocurrency exchanges, as reported by cointelegraph.

The FSA is reportedly considering to regulate crypto exchanges by the Financial Instruments and Exchange Act (FIEA), instead of its current legal foundation, the Payment Services Act. According to Senkai, this means that the exchanges will have stronger customer protections. The FIEA obliges securities companies to manage customer funds and securities, such as stocks, separately from corporate assets.

The Association of Thai Securities Companies (ASCO) is considering establishing a joint cryptocurrency exchange, with plans for several firms to apply together for a crypto exchange license, local news outlet Bangkok Post reports July 2.

Pattera Dilokrungthirapop, ASCO chairperson, told the Bangkok Post that several Thai securities firms will apply for a joint crypto operating license with the Thai Securities and Exchange Commission (Thai SEC) in order to reduce costs and share technologies.

While we are on the topic of exchanges, a major headline that was anticipated for quite some time now is that Coinbase Custody – digital assets custodian solution for institutional investors is now launched, according to an official blog post. They have already been storing over 20 billion dollars worth of crypto for their clients, but the new service will notably be secured through an SEC-compliant and FINRA-member independent broker-dealer, Electronic Transaction Clearing (ETC).


Analysis


BTC/USD

From yesterday’s open at 6376$, the price of Bitcoin has increased by 3.15% and is currently sitting at 6556$. The price went further to 6684$ but has retraced since from the spike.


Looking at the hourly chart we can see that the price found resistance at the 6647$ level from which it has retraced. I am expecting the price to fall back to the 0 Fibonacci retracement levels where it will find the support needed to propel the price higher.


Market sentiment 

Hourly chart signals a sell.

Oscillators are on neutral and moving averages on sell.


Pivot points

S3 5712.2 
S2 6118.4 
S1 6368.0 
P 6524.6 
R1 6774.2 
R2 6930.8 
R3 7337.0

ETH/USD

From yesterday’s open at 452$, the price of Ethereum has increased by 3.5% and is currently sitting at 467,9$. The price went higher to 487$ but has retraced since.


As you can see from the hourly chart, the price found resistance at the 482$ level, which pushed the price lower. Currently, the price is looking for support, and it looks like the first support has been found. If this support doesn’t hold the next one should be around the levels of yesterday’s open at 456$.


Market sentiment

Ethereum is in the sell zone.


Pivot points

S3 388.00
S2 427.80 
S1 452.30 
P 467.60 
R1 492.10 
R2 507.40 
R3 547.20

EOS/USD

From yesterday’s open at 8.14$ the price of Eos has increased by 9.23% as the price is currently 8.91$. The price spiked higher to the 9.4$ level but has retraced since.


Looking at the hourly chart we can see that the price found resistance at the 9.27$ level which pushed the price lower. The price is looking like it has found support on the current levels, but if this support doesn’t hold, the next level I would be expecting to serve as strong support is around 8.2$.


Market sentiment 

EOS is in the buy zone.


Pivot points

S3 6.1
S2 7.4
S1 8.19
P 8.69
R1 9.4
R2 9.97
R3 11.2

Conclusion


Crypto Coins News: After yesterday’s pop in the market cap evaluation, we are seeing a first small retracement, as the prices have suddenly and quickly increased. Today we are going to see the prices find the support of the retracement and continue to go upward.

Categories
Crypto Market Analysis

Daily Crypto Update 28.06.2018 – More Downside Expected


General Overview


Market Cap: $246,339,425,253

24h Vol: $10,306,976,047

BTC Dominance: 42.5%

Yesterday the evaluation of the cryptocurrency market capitalization started off with 250,553,000,000$ and from there it fell to 242,196,000,000$ today. Since that low, it has recovered to just slightly below 250B again before it fell back again.

The market is currently showing mixed colours but the more dominant is green. The average percentage change is ranging from 0.5-2%. Biggest gainer among top 100 coin by market capitalisation is Mithril which increased by 19%.


News


There aren’t any significant news items that could impact the market either positively or negatively at this point. However, there are some follow-ups from yesterday and other news that could impact the prices of particular coins.

First in the line is that ZenCash and Tron are added as payment options on Pornhub.

According to a blog post by ZenCash, the new integration will allow users to set up recurring payments and simply pay-per-use while leveraging the anonymity of the privacy coin.

This new use case for these cryptos could impact the price positively, much like it did for Verge when a similar announcement was made.

In the case of EOS, the news is negative. Dan Larimer the CTO of EOS project has proposed rehauling the project’s existing constitution to limit so-called arbitrators’ powers, in an EOSGov Telegram chat yesterday, after the recent mishaps the network has experienced. Three distinct groups work to ‘keep one another in check,’ as defined by the project’s current constitution which are known block producers and is similar to miners in the Bitcoin network.

This could impact the price of EOS negatively as FUD (Fear, Uncertainty and Doubt) takes over.

In the other news that fit into law/regulation category, the most significant one is coming from Hong Kong.

Hong Kong’s Securities and Futures Commission (SFC) released their annual report yesterday, in which they state that they will “keep a close watch” on crypto and Initial Coin Offerings (ICO), as reported by cointelegraph.

The SFC notes that since new technologies “come with risks,” they will be looking closely at crypto and ICOs and “intervening when appropriate.” The report states that the SFC took regulatory action against crypto exchanges and ICO issuers in Hong Kong this year, and released two public warnings to investors about the risk of investing in crypto.

One of the headlines that is neglected but provides an insight into the current fundamentals of the Bitcoin network is the study of Diar in which the analysed Lightning networks usage and transactions, and they have concluded that “the reliability of successfully routing a payment on the Lightning Network is still quite low”.

But while the capacity and the number of nodes as well as channels are increasing steadily, the reliability of successfully routing a payment on the Lightning Network is still quite low, especially for larger amounts. The success rate for a payment for no more than a few dollars between random LN nodes is 70%

The last headline is the one that follows up on Facebook’s ad unban. As you may remember, a few days ago Facebook has decided to lift the ban from cryptocurrency related advertisements.  This follow up is a more detailed view of the implications and the actual changes that are going to be made to their “misleading or deceptive promotional practices” policy.

On June 26, the same policies were again updated and Facebook announced that it would allow cryptocurrencies to be advertised again, but ICOs would remain banned. The company stated that it had been looking at the best way of refining its blanket ban on cryptocurrency adverts.

The revised “prohibited products and services policy” now reads:

“Starting June 26, we’ll […] allow ads that promote cryptocurrency and related content from pre-approved advertisers. But we’ll continue to prohibit ads that promote binary options and initial coin offerings.”

The phrase that caught attention was ‘pre-approved advertisers’, which means that not everyone who wants to advertise will be able to do so.

This censorship will allow Facebook more power to promote those coin and projects that are aligned with their agenda or even moderate content as to create a certain impression of a particular project.


Analysis


XRP/USD

Since yesterday’s open, the price of Ripple hasn’t changed much, as the percentage change is only +0.6%. The price went higher than on the open but it fell down to the prior levels quickly.


As you can see from the hourly chart, there’s a bearing pennant from which I am expecting a breakout on the downside. Currently, the price is on the levels of the pennants support in an upward trajectory which is why first I would look out for a bounce from the resistance line before confirming the breakout’s direction.


Market sentiment 

Ripple is in the sell zone, as indicated by hourly chart technicals.


Pivot points

S3 0.40898 
S2 0.43698 
S1 0.45409
P 0.46498 
R1 0.48209 
R2 0.49298 
R3 0.52098

NEO/USD

From yesterday’s open the price of Neo has increased only by 1.34% and is now sitting at around 30$ like yesterday.


The price action has formed a triangle and the breakout is near. From which side the breakout is about to happen we are yet to see but judging by the steepness of the support angle it looks like buyers are more aggressive at this point. But as this is a symmetrical triangle, a breakout from both sides has the same probability. If the price goes up I would be looking at a 33.8$ level as a target, and if it goes down I would look out for 26.28$ level.


Market sentiment 

Neo is in the sell zone, as indicated by the hourly chart technicals.


Pivot points

S3 27.82 
S2 28.97 
S1 29.67 
P 30.13 
R1 30.83 
R2 31.29 
R3 32.44

DASH/USD

From yesterday’s open at 229.4$, the price of Dash has decreased by 3.25% and is now sitting at 221.5$.


On the hourly chart, nothing has changed much. My target of 211.8$ remains the same.


Market sentiment

Dash is in the sell zone.

Oscillators are signalling a sell and moving averages signal a strong sell.


Pivot points

S3 208.22
S2 217.78
S1 223.09
P 227.34
R1 232.65
R2 236.90
R3 246.46


Conclusion


As the market cap evaluation hasn’t gone beyond the 250B level, and the chart of three cryptos that were covered in this report are forming bearish patterns, more downside is expected.

Categories
Crypto Market Analysis

Daily Crypto Update 27.06.2018 – More Stagnation


General Overview


Crypto Market Capitalization Chart:

Market Cap: $246,600,162,313

24h Vol: $11,274,713,968

BTC Dominance: 42.5%

In the last 24 hours, the evaluation of the cryptocurrency market capitalisation has decreased from $256B to 242,426,000,000$ and has recovered slightly since.

Crypto Market Capitalization Chart

The market is currently in red with an average percentage change among top 100 coins ranging from 3 to 6%. Monaco, Nebulas and Qtum are the only ones in green with an increase of 11, 8, 7%, respectively and everything else is in red with biggest losers being around 11%.


News


In the last 24 hours, the most significant headlines that came out, many of them regarding cryptocurrency exchanges, are as follows. The first that came out is Binance suspended trading and withdrawals due to a risk warning, according to a note from Binance.

“Due to a warning from a pre-trade check in our risk management system, we will postpone the start of trading and withdrawals.

Please stay tuned for more information regarding the reopening of trading and withdrawals.

We apologise for any inconvenience and thank you for your patience.”


Meanwhile Singapore-based CoinBene and Hong Kong-based Bit-Z have introduced a new “transaction fee mining” model which made them the largest volume holders in the last 24 hours, with the first one ranked as first with more than $2.1 billion in trading volume, and second one ranked as second with about $1.5 billion in trading volume over a 24 hour period.

This impacted the rank of Binance, which previously sat in the number one spot and is now ranked fourth, with 629$ million in daily trading volume.

The third largest cryptocurrency exchange in the world by 24-hour trading volume, Huobi has announced in an email sent to investors in Japan on Wednesday, that they are to remove the Japanese option from its homepage and suspends trading services from July 2, as reported by Coinpost.

As suggested in the Coinpost report, Huobi Pro made the decision to withdraw Japan-based services because is not registered with the Financial Services Agency (FSA), Japan’s financial watchdog, as mandated under a money transaction law introduced in 2016. It is not currently clear if the exchange has been contacted by the FSA over the issue.

While we are on watchdogs, another significant headline that fits into the exchange category is that Korean Watchdog is to tighten the rules on crypto exchange bank accounts.

South Korea’s financial regulator has amended the anti-money laundering rules that apply to cryptocurrency exchanges in the country, requiring domestic banks to tighten up monitoring of related bank accounts.

According to an announcement from the Financial Services Commission (FSC) on Wednesday, the amendment – which will initially be in effect for a year – means domestic banks who provide services to crypto exchanges must now monitor all the accounts held by an exchange.

Out of the news items that’s not in the exchange related category, the most significant one is that Facebook has updated its policy to allow cryptocurrencies to once again be advertised, while upholding its ban on the promotion of initial coin offerings (ICOs), in an announcement published Tuesday, June 26, as reported by cointelegraph.


Analysis


BTC/USD

From yesterday’s open at 6251$, the price of Bitcoin has decreased by 2.66% as it’s now sitting at 6090$.


As you can see on the hourly chart, from the resistance found at 6277$, the price has been in a constant steady decline. The price interacted with the downtrends resistance line with a quick spike in order to test that resistance. We can expect that the price is going to continue its downward movement today and go to the support line at 6000$.


Market sentiment 

Bitcoin is in the sell zone.

Oscillators are on neutral and moving averages signal a strong sell.


Pivot points

S3 5673.6 
S2 5904.2 
S1 5988.8
P 6134.8 
R1 6219.4 
R2 6365.4 
R3 6596.0

ETH/USD

From yesterday’s open at 461.22$ the price of Ethereum has decreased by 6% coming to around 432$ where it is currently sitting.


Looking at the hourly chart we can see that the price is currently on the levels of the downtrend resistance line where the price is looking for support, but as the trend is down the support goes down as well. We will see if the support hold, but lower low is more likely at this point.


Market sentiment 

Hourly chart technicals signal a sell.

Oscillators are signalling neutral and moving average a strong sell.


Pivot points

S3 374.87
S2 407.37 
S1 418.35
P 439.87 
R1 450.85
R2 472.37 
R3 504.87

XRP/USD

In the last 24 hours, the price of Ripple has decreased by 3.91% from 0.4819$ to 0.4629$.


Looking at the hourly chart we can see that the price is on the same levels of the recent low as it retested the 0 Fibo level. It has recovered slightly but not nearly that fast in order to show some sign of strength, which is why I think we are in for more downside today.


Market sentiment 

Ripple is in the sell zone.

Oscillators are on neutral and moving averages signal a sell.


Pivot points

S3 0.39681 
S2 0.42945 
S1 0.44081 
P 0.46209 
R1 0.47345
R2 0.49473 
R3 0.52737

Conclusion


Looking at the charts of the three cryptos we covered in this report, I am under the impression that the prices are struggling and aren’t stable. They are at or close to the levels of the recent low as the recovery was short-lived. We are potently going to see another low today, but the continuation of the stagnation with some sideways movement is more likely.

Categories
Crypto Market Analysis

Daily Crypto Update 26.06.2018 – Stagnation May Cause Another Low


General Overview


Market Cap: $253,329,490,428

24h Vol: $18,385,228,119

BTC Dominance: 42.0%

In the last 24 hours, evaluation of the crypto market cap has been stagnating and is on the same levels as on yesterday’s open. It went a bit higher to 258,595,000,000$ but since that high, it has been steadily declining.

Real Trade News:

The market is showing mixed colours, with an average percentage change among top 100 coins ranging from 1-3%. The biggest gainer is Theta Token which increased by 23%.


Real Trade News


In the last 24 hours, there are three news headlines that can impact the market. First by its significance is that  Tether (USDT), has issued 250 million more tokens yesterday, according to data from Omni Explorer.

While it is still unclear whether Tether is printing their coins on there own, or investors are purchasing USDT and they increased the supply in a proper 1:1 ratio, one thing is certain – more Tethers mean that Bitcoin’s price is going up.

One of the headlines that could impact the market negatively is that Hyun Song Shin, economic adviser at The Bank for International Settlements’ (BIS), said that cryptocurrencies should be treated the same as stocks and bonds, Business Times reported June 25.

“If people pay to hold the tokens for financial gain, then arguably they should be treated as a security and come under the same rigorous documentation requirements and regulation as other securities offered to investors for a return.”

And the last of the three significant headlines is that cryptocurrency with a market capitalisation of $2.7 billion, Tron (TRX),  has activated its mainnet following a migration to its independent public blockchain, according to a blog post published June 25. This could impact the price of Tron positively.


Analysis


TRX/USD

From yesterday’s opening at 0.04271$, the price of Tron has decreased by 3.84% as the price is currently sitting at 0.041$


As you can see from the hourly chart, the price action is currently in a triangle and it looks like the breakout is near. Judging by the steepness of the triangle resistance line, the breakout is going to be from the downside, which means that the fundamental news may not impact the price just yet.


Market sentiment 

Tron is in the sell zone.

Oscillators signal a sell, and moving averages signal a strong one.


Pivot points

S3 0.036658 
S2 0.039447 
S1 0.040771
P 0.042236 
R1 0.043560 
R2 0.045025 
R3 0.047814

ETH/USD

In the last 24 hours, the price of Ethereum has decreased by 1.3%, which is not significant as the price is hovering around the same levels since yesterday’s open.


As you can see from the hourly chart, the price action is in an ascending channel in which it is correcting after the last low. The price found support at the descending channels resistance (purple line) yesterday, but we are yet to see how far can the price go before another drop.


Market sentiment

Ethereum is in the sell zone.

Oscillators are on sell, and moving averages signal a strong sell.


Pivot points

S3 401.33 
S2 430.45 
S1 444.73 
P 459.57 
R1 473.85 
R2 488.69 
R3 517.81

BCH/USD

From yesterday the price of Bitcoin Cash hasn’t changed at all as the price is still hovering at around 748$.


As you can see from the hourly chart, the price is hovering at the baseline support 1, as it is consolidating after the recent low and verifying that support level.


Market sentiment 

Hourly chart technicals are the same as two prior ones – sell.

Oscillators are on sell and moving averages on a strong one.


Pivot points

S3 663.0
S2 709.2 
S1 731.0 
P 755.4 
R1 777.2 
R2 801.6 
R3 847.8

 Conclusion


Real Trade News: After the recent low, the prices have recovered a bit, but that recovery was short-lived as the prices are now stagnating and even decreasing a bit. As the low had a V shape that is common at the bottom in the markets, I was convinced that the low was the bottom for a short-term recovery. Now, a day later and after analysing the charts, I am not so sure anymore. We might see another low in the following days, so be careful not to fall into the trap of thinking the market has to do something (has to recover after a steep low)- it doesn’t have to do anything.

Categories
Crypto Market Analysis

Daily Crypto Update 25.06.2018 – Short-term Recovery Expected


General Overview


Live Trading Update:

Market Cap: $254,201,622,949

24h Vol: $15,258,651,571

BTC Dominance: 41.7%

In the last 24 hours, the evaluation of the cryptocurrency market capitaliSation started off at 259,367,000,000$ and shortly after that it fell to 235,331,000,000$ yesterday. This is the lowest cryptos have been since the correction has started, and the last time we saw this evaluation was in the first half of November last year. Currently, the evaluation has recovered from yesterday’s low and is sitting on the levels prior to the drop.

Live Trading Update

The market is currently in green with an average percentage of change ranging from 5-10%. Biggest gainers among top 100 coins are WaykiChain 39%, Cortex 38%, and Theta Token 26%.


News


There aren’t any significant news items that came out in the last 24 hours. Most of the headlines are analytical in nature as the cryptocurrency market experienced the recent low, followed by interviews that reassert the bullish views on cryptos over the long run.

These are some of the headlines:

Bitcoin Price Hits 2018-Low at $5,825, Where Will it Bottom Out?

Bitcoin’s Defense of $6K Raises Odds of Relief Rally

Ether Price Drops to 10-Week Low Near $400

Cardano Co-Founder: Wall Street Will Bring ‘Tens of Trillions of Dollars’ to Crypto

Blockchain CEO Says Bitcoin Adoption Will Take a Long Time, Survivors Will Win

One of the headlines that stand out and is not from this category is that China’s state-backed monthly ratings are out and according to them, EOS in number 1. The rating is called “Global Public Chain Technology Evaluation Index” and is published by the China Center for Information Industry Development (CCID) of the Ministry of Industry and Information Technology.

EOS’ top ranking is attributed to the “outstanding technical advantages in transaction confirmation efficiency, network throughput, and transaction costs” of the protocol.

While conceding the EOS Mainnet’s recent mishaps – since going live on June 15, the network has faced technical issues, and criticism for freezing some accounts – the evaluation nonetheless judges the project to be “highly active in technological innovation,” a “new generation public blockchain” that is “currently most regarded by the industry.”

Source: cointelegraph


Analysis


BTC/USD

From yesterday’s low at 5777,3$ the price of Bitcoin has recovered by 7.54% and is currently sitting at 6224$.


Looking at the hourly chart we can see that the price of Bitcoin has fallen below the 6000$ level which was a psychologically significant level as are most round numbers. This spike at around 5700$ played out yesterday just like I’ve predicted and now the price is likely going to start to recover.


Market sentiment 

Bitcoin’s hourly chart technicals signal a buy.

Oscillators are signalling a buy and moving averages are signalling a buy.


Pivot points

S3 5061.5 
S2 5556.2 
S1 5852.1 
P 6050.9
R1 6346.8 
R2 6545.6 
R3 7040.3

XRP/USD

From yesterday’s low at 0.4417$, the price of Ripple has recovered by 9% as it is currently sitting around 0.481$.


On the hourly chart, we can see that the price has fallen below the 0 Fibonacci retracement level, which means that the price fell lowest since the correction has started as this is the ending point of the prior retracement. Currently, it looks like is testing for support on the last range support and we are yet to see if it holds.


Market sentiment 

Hourly chart technicals signal a buy.

Oscillators are on buy, and moving averages signal a buy.


Pivot points

S3 0.35393 
S2 0.41192 
S1 0.44334 
P 0.46991 
R1 0.50133 
R2 0.52790
R3 0.58589 

EOS/USD

From yesterday’s low at 6.96$ the price of Eos has recovered significantly as it rose by 15.3% coming to around 8$ where it is currently sitting.


On the hourly chart, we can see that the price action created a similar U shape bottom as in the case of Bitcoin and Ripple. After the recovery the price has experienced, it is currently looking for support on the levels from which the drop appeared.


Market sentiment

EOS is in the buy zone.

Oscillators are on buy, and moving averages signal a buy.


Pivot points

S3 4.7107 
S2 6.2507 
S1 7.1489 
P 7.7907 
R1 8.6889 
R2 9.3307 
R3 10.870

XMR/USD

Monero is another coin which experienced significant recovery. From yesterday’s low at 108.6$ the price has increased by 15.8% coming to 127$. Currently, the price has retraced a bit and is now sitting at 124.7$.


Unlike other cryptos, Monero didn’t just spike down to its lows but instead retested those levels two more times after the first spike down. The price is now above the levels from which it previously dropped, looking for support, as you can see from the chart.


Market sentiment

Hourly chart technicals signal a buy.

Oscillators are on neutral and moving averages signal a buy.


Pivot points

S3 80.973 
S2 99.403 
S1 110.097
P 117.833
R1 128.527 
R2 136.263 
R3 154.693

 Conclusion


Live Trading Update: As the prices of all major cryptos fell to their lowest since the correction has started, and in a way, retested the lowest cryptos have ever been, I am now looking for signs of a short-term trend reversal that will serve as a retest of prior highs. Spikes that we’ve seen look like the bottoms as they are V-shaped and were short lasted which is how markets usually bottom out. As those spikes could be interpreted as a missed opportunity by buyers, fear of missing out on the bottom can push the prices higher.

Categories
Crypto Market Analysis

Daily Crypto Update 19.06.2018 – Will Yesterday’s Spike Trigger a Trend Reversal


General Overview


Market Cap: $287,823,534,235

24h Vol: $12,135,483,741

BTC Dominance: 40.0%

In the last 24 hours, something strange has happened. After a period of stagnation, all of a sudden the evaluation of the crypto market cap has spiked up from 276,698,000,000$ to 289,453,000,000$. The spike wasn’t caused by news or any fundamental factors, which is why this is strange.

I have written my take yesterday on what I think has happened in the post entitled ‘The Reason Of The Sudden Rise In The Crypto Market May Be Manipulation‘ which you can read here.

The market is currently in green as a result of the rise with an average percentage change ranging from 3-5%.


News


There aren’t any significant news items that came out in the last 24 hours that can justify the up move we have seen in the market. Top headlines that came out are informative in nature and every major news outlet reported on the sudden rise in the crypto market capitalisation rise.

Crypto Markets See $13 Bln Price Spike in One Hour, Despite Negative BIS Report – cointelegraph

Investors Turn Bullish as Cryptocurrency Market adds $12 Billion 24 Hours – ccn

Bitcoin Recovery Stalls Raising Risk of Price Drop – coindesk

Majority of analysts expected a steep fall to 6000$ for Bitcoin, which is why this unexpected rise is considered a news event and was reported by many.

Other relevant news in the crypto space are the following:

US: Federal Employees to Disclose Crypto Holdings Following New Guidance

The US Office of Government Ethics (OGE) has ordered federal employees to report their holdings of virtual currency, according to new guidance issued June 18. The guidance will affect around 2 million federal executive branch employees, including the Departments of Homeland Security, the Army, Justice, Veterans Affairs, and others.

Source: cointelegraph

EOS Vulnerability Will Lead to ‘Massive Exchange Hack’, Predicts Cornell Blockchain Researcher

Cornell professor Emin Gün Sirer forecasted his belief that EOS, will be the root cause of a significant cryptocurrency exchange hack at some point during the next calendar year.

“I’m calling it: there will be a massive exchange hack within the next year, taking advantage of an EOS vulnerability. That exchange will lose its hot wallet.”

“If EOS uses its arbitrators to reverse the hack, the contagion will spread downstream,” he added. There will be threats of lawsuits involving the devs and the [block producers].”

While clarifying that this prediction is not based on any specific vulnerability he has identified or believes lies hidden within the EOS source code, he argued that such an exploit is likely inevitable given the way developers “handle safety critical bugs.”

Source: ccn


Analysis


BTC/USD

From yesterday’s opening at 6378$ until now, the price of Bitcoin has increased by 5.28% and is currently sitting around 6714$.


Looking at the hourly chart we can see that the price interacted with the unconfirmed baseline support 2 (black dotted line) and was stopped at resistance found on those levels at 6850$. Currently, the price is sitting quietly in the middle of the range, as market participants are waiting to see if the spike up will push the prices higher.


Market sentiment 

Hourly chart signals a buy.

Oscillators are on buy and moving averages signal a strong one.


Pivot points 

S3 5685.4 
S2 6164.3 
S1 6436.7 
P 6643.2 
R1 6915.7 
R2 7122.2 
R3 7601.1

XRP/USD

From yesterday’s opening, the price of Ripple has increased by 4.91% going from 0.52$ to 0.547$ where it is currently.


The price has found support at the 0.51$ level and bounced off it, and is starting to interact with the minor resistance line, as you can see from the hourly chart. We will see what happens in the following hours, but if this resistance line gets broken I would expect the price to go up to the purple dotted line which is a significant level that served as support in the past.


Market sentiment 

Hourly chart technicals signal a buy.

Oscillators are on buy, and moving averages signal a strong buy.


Pivot points

S3 0.43653 
S2 0.48395 
S1 0.51157 
P 0.53137 
R1 0.55899 
R2 0.57879 
R3 0.62621

LTC/USD

In the last 24 hours, the price of Litecoin has increased by 4.29% rising from 93.6$ to 98$ where it is currently.


On the hourly chart, we can see that the price broke out of the bearish pennant on the upside and has stopped at a minor resistance line like other coins.


Market sentiment 

Litecoin is in the buy zone.

Oscillators are on sell, and moving averages signal a strong buy.


Pivot points

S3 82.890
S2 90.100
S1 94.469
P 97.310
R1 101.679
R2 104.520
R3 111.730


Conclusion


After the sudden rise, the prices of all major cryptos including these that are covered in this report have spiked up but were stopped out at minor resistance levels which means that the momentum behind the move wasn’t strong. Today, we will see if the spike serves as a signal for market participants to start buying, and that will be confirmed if the minor resistances are going to be broken and we see a high exceeding the prior one. That will in the case of Bitcoin be around 7000$, in the case of Ripple around 0.578$ and in the case of Litecoin around 111$.

Categories
Crypto Market Analysis

Daily Crypto Update 18.06.2018 – Another Low Ahead


General Overview


Market Cap: $276,643,180,630

24h Vol: $10,182,196,782

BTC Dominance: 40.1%

From yesterday’s open at 281,509,000,000 cryptocurrency market cap has decreased by around 4,5 billion dollars. The evaluation has been hovering around these levels for the most part as you can see from the graph below.

It looks like its forming a plateau as market participants are waiting to see if this is the bottom. Buyers don’t want to come in just yet as prices may decline further, and those who are thinking of selling don’t want to sell if this is the bottom.

Currently, the market is mostly in red, with an average percentage change ranging between 1-3%.


News


There aren’t any significant news items that came out over the weekend that could impact the market neither positively or negatively. Most significant headlines are those regarding technical improvements in particular cryptos and situations in their ecosystem.

Out of those stories that fit into this category the first that stands out is that Bitcoin Core Version 0.16.1 has been launched, according to the post from Linux Foundation

This is a new minor version release, with various bugfixes as well as updated translations.

This Bitcoin Core version removed miner block size recalling the depreciation of the “-blockmaxsize” option for miners to limit their blocks’ sizes in version 0.15.1. It states that miners now should apply “-blockmaxweight” option if they want to limit the weight of their blocks.

Ethereum is going to combine Casper and Sharding upgrades, as reported by cointelegraph.

The key point of the recent meeting is rescheduling the releases of two main Ethereum chain upgrades such as Casper and Sharding. Casper should have been released as a smart contract separately from the sharding upgrade. The new proposals suggest that Casper may be released on a shard, or a sidechain instead.

EOS blockchain is live again after a bug froze the network

The bug is now fixed and the network is up and running.


Analysis


BTC/USD

From yesterday’s opening at 6542$, the price of Bitcoin has decreased by 2.05% as it is currently sitting at 6430$.


As you can see from the hourly chart the price action has formed a symmetrical triangle and it looks like a breakout is soon going to happen. After the price consolidated a bit, it looks like it ready for a move, and I think a move to the downside is more likely to around 6000$, to retest of the lowest points and give potential buyers a better price, as the last low hasn’t triggered significant amount of buying that could push the price upward.


Market sentiment

Hourly chart technicals signal a sell overall.

Oscillators are signalling a buy, and moving averages a strong sell.


Pivot points

S3 6182.3
S2 6330.5
S1 6384.5
P 6478.7
R1 6532.7
R2 6626.9
R3 6775.1


ETH/USD

From yesterday’s high at 507$, the price of Ethereum has decreased by 3% and is now 492,68$.


Looking at the hourly chart we can see that the price action is also forming a triangle like in the case of Bitcoin. The breakout from the downside is more likely as the purple line represents the resistance from the descending channel which held the price strong in the past.


Market sentiment

Hourly chart technicals signal a strong sell.

Oscillators are on sell, and moving averages on a strong one.


Pivot points

S3 469.31
S2 484.44 
S1 490.76 
P 499.57 
R1 505.89 
R2 514.70 
R3 529.83

LTC/USD

The price of Litecoin has decreased over the last 24 hours by 4.21% – from 97.65$ to 93.66$.


Again we can see a triangle forming as market correlation is strong in the bear market, and judging by the steep angle of the triangle resistance line we can conclude that sellers are more aggressive at the moment, which means the breakout from the downside is more likely.


Market sentiment 

Litecoin is in the sell zone.

Oscillators are on neutral, and moving averages signal a strong sell.


Pivot points

S3 88.024 
S2 91.986 
S1 93.430 
P 95.948 
R1 97.392 
R2 99.910 
R3 103.872

Conclusion


As you have seen consolidative triangles are on all of the cryptos that I have covered in this report, and the breakout is about to happen today. As market sentiment is bearish, technical indicators signal a sell and judging by the steepness of the resistance line from the triangles I conclude that we are in for another low. I am expecting the price of Bitcoin to retest 6000$ level, Litecoin to 85$ and Ethereum to 460$ or less. Overall that would mean another 8% drop in the whole market which would bring the crypto market cap to around 250B which was the prior low.

Categories
Crypto Market Analysis

Daily Crypto Update 15.06.2018 – Be Ready For Another Low


General Overview


Market Cap: $283,999,903,554

24h Vol: $15,738,961,943

BTC Dominance: 39.8%

In the last 24 hours, the crypto market cap has been showing sideways action as the evaluation went from 268,312,000,000$ to 290,760,000,000$ and has been decreasing since that point to around 283B where it is currently.

The market is currently mixed in colour with a small average percentage change of around 0.4-2%.


News


The most significant news that came out in the last 24 hours which may impact the space positively is that a senior U.S. Securities and Exchange Commission (SEC) official has said that leading altcoin Ethereum will not be regulated as a security, as reported by the Wall Street Journal.

SEC Corporation Finance Director William Hinman said at Yahoo Finance’s All Market Summit: Crypto in San Francisco today that:

“Based on my understanding of the present state of ether, the Ethereum network and its decentralised structure, current offers and sales of ether are not securities transactions.”

This news is interpreted by some analysts as the fundamental factor in charge of the rebound we are seeing currently in the markets.

Another significant news headline is that Coinbase Index Fund opens for large-scale investors, as reported by cointelegraph.

The fund, whose creation was announced in March, is available only to U.S. resident accredited investors – those who have a net worth of more than $1 mln or an annual salary of more than $200,000 – who invest between $250,000 and $20 mln.

Both of these headlines may introduce some short-term confidence in the markets, and impact it positively.


Analysis


BTC/USD

Since yesterday’s low at 6273$, the price of Bitcoin has increased by 5.3% coming to 6605$ where it is currently sitting. The price went a bit higher to 6660$ where the resistance was found, as you can see from the chart below.


Looking at the hourly chart, we can see that current formation looks similar to that of the prior low. The price is currently above the 0 Fibonacci level, but it might drop again steeply, as the cluster is starting to form around 6660$ level which serves as resistance.


Market sentiment 

Bitcoin is in the sell zone.

Oscillators are on neutral, and moving averages signal a strong sell.


Pivot points

S3 5612.5
S2 6079.6
S1 6356.6
P 6546.6
R1 6823.6
R2 7013.6
R3 7480.6


XMR/USD

The price of Monero is on the same levels as it was on yesterday’s opening around 122$.


Looking at the daily chart, we can see that the price of Monero has broken out off of the triangle on the downside and has currently found support at prior range resistance. Wednesday’s candle was a hammer Doji that tested the prior range support line and from there went on to recover quickly.


Zooming into an hourly chart, we can see that from the spike down price went to 133.6$ four times and hasn’t exceeded the level which means there’s a strong resistance there, which made the price fall back again to the support line.


Market sentiment

Hourly chart technicals signal a strong sell.

Oscillators are on sell, and moving averages signal a strong one.


Pivot points

S3 96.317 
S2 112.207 
S1 122.293 
P 128.097 
R1 138.183 
R2 143.987 
R3 159.877

DASH/USD

From yesterday’s opening at 245$, the price of Dash has increased by 6.2% and is currently sitting slightly below 260$.


Looking at the daily chart, we can see that the price of Dash found support at the levels of the current range support at around 238.85$.


Zooming into an hourly chart we can see that the price action is forming the same pattern like it did last time it bottomed out, but also similar to that of the prior triangle fractal from which the price went on to continue in a downward trajectory and finally to the current low.


Market sentiment

Hourly chart technicals signal a sell.

Oscillators are on neutral and moving averages signal a strong sell.


Pivot points

S3 201.55 
S2 231.57 
S1 249.39 
P 261.60 
R1 279.42 
R2 291.62 
R3 321.65

 Conclusion


As price action of the three cryptocurrencies that I have covered in this report are showing signs of a recovery, they are also struggling to get past the first resistance that they face. I think we might see another low to the levels of the lasts one or even a bit lower, before a short-term trend reversal.

Categories
Crypto Market Analysis

Daily Crypto Update 13.06.2018 – Another Flash Crash Coming?


General Overview


Market Cap: $272,840,869,681

24h Vol: $15,609,802,094

BTC Dominance: 40.4%

In the last 24 hours, the cryptocurrency market cap has declined from 295,086,000,000$ to around 272 billlon dollars which is a 23 billion dollar decrease.

The market is currently in the red, with an average decrease ranging from 10-15%. Among top 100 coins, only Decentraland (+2%) and Emercoin (+5%) are in the green.


News


Top headlines that came out in the last day are mostly regarding corporations and major players adopting blockchain technology. Some of the most significant news that fit into that category are the following:

Multiple Russian corporate giants have created a joint venture that plans to develop projects in blockchain and the digital economy, as reported by TASS.

Russian telecom company MegaFon, Gazprombank, government corporation Rostec, and the USM Group have created a joint venture – referred to as MF Technologies (MFT) – that is worth $450 mln and has a 59 percent stake in Russian Internet giant mail.ru.

Argo, crypto mining firm, set to become London Stock Exchange’s first blockchain listing, as reported by Bussines insider.

After launching its subscription service for mining contracts the same day, the company says it plans to hold an IPO, following a $2.5 mln funding round it completed in January of this year.

Argo says it aspires to “democratise” the mining landscape for four altcoins – Bitcoin Gold, Ethereum, Ethereum Classic and Zcash – by renting computing power from an eco-friendly facility located in Quebec.

 VeChain (VEN), Singapore-based blockchain startup, and DB Schenker, global logistics provider, have co-developed a blockchain-based supplier evaluation system, according to cointelegraph

A new decentralised application (DApp) will use the VeChainThor blockchain to score DB Schenker’s third-party logistics partners in China based on collected data – the result being an evaluation for services such as packaging, transportation, and the quality of goods.

Out of news that fit into this category, the story reported by Korea JoongAng Daily regarding South Korean commercial banks launching a blockchain-powered customer ID verification platform is the most significant one.

Korea Federation of Banks (KFB) will launch their “BankSign” identity verification system to be used in both online computer-based and mobile banking. According to Korea JoongAng Daily, the move is intended to replace the 20-year old public verification system that is reportedly notorious for its complexity and inefficiency.

Other significant headlines that are leaning on the side of the general sentiment toward cryptocurrencies are those that came from Germany and Financial Action Task Force (FATF).

The German Federal Government has stated that cryptocurrencies do not pose a threat to financial stability, Cointelegraph auf Deutsch reports today, June 12. Nevertheless, the government sees the need for regulatory measures to control digital currencies.

The Financial Action Task Force (FATF), the international group that combats money laundering and terrorism financing, will start developing binding rules for crypto exchanges in June, a Japanese official familiar with the matter told Reuters June 12.

The new rules would be an upgrade to the non-binding resolutions which were adopted by the FATF in June 2015. The FAFT will consider whether existing guidelines on anti-money laundering (AML) measures and reporting suspicious trading activity are still appropriate, and if they can be applied to new exchanges. The intergovernmental organisation will also reportedly investigate how to work with countries who have moved to ban cryptocurrencies.

Source: cointelegraph.com


Analysis


BTC/USD

From yesterday’s opening at 6853$, the price of Bitcoin has decreased by 5.49% and is currently sitting slightly below 6500$.


Looking at the hourly chart, we can see that the price is now below 0 Fibonacci retracement level and below the unconfirmed baseline support 2. In my weekly update, I have stated that I would expect the price to continue falling down to these levels, as there was no strong support prior that can hold the momentum. I am expecting the price to go even lower to around the 6000$ area which was the lowest point in this correction before we see some short-term trend reversal.


Market sentiment 

Hourly chart technicals signal a strong sell.

Oscillators are on sell, and moving averages signal a strong one.


Pivot points

S3 5743.2 
S2 6180.5 
S1 6362.2 
P 6617.8 
R1 6799.5 
R2 7055.1 
R3 7492.4

LTC/USD

From yesterday’s opening at 107$, the price of Litecoin has decreased by 11.12% and is currently sitting around 95$.


On the hourly chart, we can see that the price of Litecoin is in a straightforward downfall and is going to continue moving in a downward trajectory as there’s no support until the wedge support line (blue dotted line) at 85$, so I am expecting interaction with it soon.


Market sentiment

Litecoin is in the sell zone, as indicated by hourly chart technicals.

Oscillators are one sell, and moving averages signal a strong one.


Pivot points

S3 79.310 
S2 90.506 
S1 95.165
P 101.702 
R1 106.361 
R2 112.898 
R3 124.094

OMG/USD

In the last 24 hours, the price of OmiseGo has declined by 9% – from yesterday’s open at 9.97$ to 9.08$ where it is currently sitting.


Looking at the hourly chart we can see that the price found some support at the current levels, but I don’t believe that it will bounce off of it as selling pressure is strong. Most likely, the price is going to continue its downward movement and will interact with the 0 Fibonacci level much like it did in the case of Bitcoin, and form a double bottom at around 8$ level.


Market sentiment

OmiseGO is in the sell zone.

Oscillators are on buy, and moving averages signal a sell.


Pivot points

S3 7.1564 
S2 8.2784 
S1 8.6688 
P 9.4004 
R1 9.7908 
R2 10.5224 
R3 11.6444

ZRX/BTC

From yesterday’s open the price of 0x has decreased by 15% coming from 15542 Satoshi to 13222 Satoshi where is currently sitting.


Looking at the daily chart we can see that the price pathway was, as I have projected it would be, in a bearish scenario – the handle pattern is a downward channel and the price fell down to the channel support for a retest.


Zooming into the hourly chart we can clearly see the interaction with the channel support – the price is currently below it and is back to retest it for resistance. We will see if the breakout will happen and the price breaks from the cup and handle on the downside, or will it bounce back into the channel range and continue on as I have projected the pathway.


Market sentiment 

Hourly chart technical signal a strong sell.

Oscillators are on sell, and moving averages on a strong one.


Pivot points

S3 0.00010967
S2 0.00012567
S1 0.00013133
P 0.00014167
R1 0.00014733
R2 0.00015767
R3 0.00017367


Conclusion


As the prices of the cryptocurrencies that were covered in this report are still in a downfall with no real support in sight, I conclude that we are in for more downside. We could see a short-term trend reversal if the prices are so low that the potential buyers couldn’t resist not buying.  That’s why I believe that this trend continuation will maybe even be another flash crash, which will spike down to new lows that would exceed prior once, which would in the case of Bitcoin be around 5700$.

Categories
Crypto Market Analysis

Daily Crypto Update 12.06.2018 – Recovery


General Overview


Market Cap: $300,847,470,009

24h Vol: $14,745,555,309

BTC Dominance: 39.0%

From yesterday’s low at $291B, the evaluation of the cryprocurrency market capitalisation increased around 9 billion dollars, coming to around $300B.

TH

The Crypto market is currently mixed in colour with an average percentage of change ranging from 0.5-2%. Biggest gainers are Loom Networking which surprisingly increased by 34%, Ethereum Classic 21.7%, Dropil by 17% Cyber Miles 12%. Those who are in red haven’t decreased more than 4%.


News


News that came out in the last 24 hours is mostly analytical in nature, as this last drop in price surprised a lot of the analysts and is considered as an event. There are also significant stories that can positively impact the market sentiment which may cause some temporary confidence.

For example, news that the cryptocurrency exchange Coinbase is going to list Ethereum Classic on their platform resulted in the ETC increasing in price by 21.7%. In the blog post they have stated:

Per this process, we will now begin the engineering work (Step 4) for supporting Ethereum Classic. As part of this process, customers can expect to see public-facing APIs and other signs that the asset is being added. When we reach the final testing phase of the technical integration, which we expect to occur over the next few months, we will publicly announce a launch date for trading via our blog and Twitter (Step 5).

While we are mentioning exchanges, another related major news story is that Binance is going to support fiat-crypto trading. 

Crypto exchange Binance announced plans to allow fiat-crypto trading this year through a separate Malta-based exchange, a Binance representative told Cointelegraph today, June 11

While Bloomberg reported today that Binance will “soon allow customers to convert digital tokens into fiat currencies”, a Binance representative clarified to Cointelegraph that “Binance.com is a pure crypto-to-crypto exchange.” They confirmed that crypto-fiat trading will only be offered through a separate local exchange the company is opening in Malta. Binance Malta will most likely begin fiat trading with a euro-Bitcoin (BTC) pair, the representative told Cointelegraph.

Yesterday at the Cebit ‘18 Expo in Germany, IOTA and Volkswagen demonstrated a Proof-of-Concept (PoC) that uses IOTA’s Tangle system for autonomous cars. This is significant as it may impact the price of IOTA positively in the following days, much like the prior news story did for Ethereum Classic.


Analysis


BTC/USD

From yesterday, the price of Bitcoin increased by 1.5% from 6724$ to 6822$ where is currently sitting.


Looking into the hourly chart we can see that the price broke out from the triangle in which it was consolidating and is currently on the rise. As the price broke out from the daily triangle two days prior, the price is likely going to continue going higher, probably in the form of an ascending wedge, and eventually reach its support which now serves as resistance at the 7126$ level.


Market sentiment 

Hourly chart technicals signal a sell.

Oscillators are on buy, and moving averages signal a sell.


Pivot points

S3 6262.1
S2 6531.4 
S1 6702.3 
P 6800.7 
R1 6971.6 
R2 7070.0 
R3 7339.3

IOTA/USD

From yesterday’s open, the price of IOTA has increased by 3% from 1.35$ to just slightly below 1.4$ where it is currently.


As you can see from the hourly chart, the price found support on the 0.236 Fibonacci level and is currently on the rise. I would expect the price action to form an ascending wedge or an upward channel.


Market sentiment 

Hourly chart technicals signal a sell.

Oscillators are on buy, and moving averages signal a strong sell.


Pivot points

S3 1.0946 
S2 1.2543
S1 1.3570 
P 1.4140 
R1 1.5167 
R2 1.5737
R3 1.7334

ETC/USD

The price of Ethereum Classic increased 21.5% from yesterday’s opening – from 12.67$ to 15.4$ in the last 24 hours.


As you can see from the hourly chart, my targets which I have projected in the charting section last month have been met perfectly. After those lows have been tested, the fundamental news impacted the price positively and you can see the strong green candle proudly waving a bull flag. The price is currently consolidating inside a triangle and we are likely going to see the uptrend trend continue.


Market sentiment 

Hourly chart technicals signal a buy.

Oscillators are on buy, and moving averages signals a strong one.


Pivot points

S3 11.073 
S2 11.879 
S1 12.375 
P 12.685 
R1 13.181 
R2 13.491 
R3 14.297

Conclusion


Today we are going to see some recovery and some sideways action as the prices are going to recover from yesterdays lows.

Categories
Crypto Market Analysis

Daily Crypto Update 07.06.2018 – Nothing Has Changed Since Yesterday


General Overview


Market Cap: $345,346,669,155

24h Vol: $14,967,182,843

BTC Dominance: 37.9%


In the last 24 hours, the crypto market cap has been moving sideways. Yesterday started off at around $344B and has been hovering around these levels before it dropped steeply to $338B only to go up again to previous levels. Today’s high was at 349,653,000,000$ and since then, the evaluation has retracted back to yesterday’s levels.

The market is currently showing mixed colours. Biggest gainer among top 100 is Aeternity whose price increased by 13.7%, and the biggest loser is Nexus who’s price decreased by 15.16%.


News


The most significant news that came out in the last 24 hours is that the U.S. Securities and Exchange Commission Chairman Jay Clayton stated that the agency won’t change securities laws to cater to cryptocurrencies

“We are not going to do any violence to the traditional definition of a security that has worked for a long time,” U.S. Securities and Exchange Commission Chairman Jay Clayton told CNBC on Wednesday. “We’ve been doing this a long time, there’s no need to change the definition.”


That means that cryptos are intended to compete with sovereign currencies like the US dollar, won’t be defined as a security.

“(Cryptocurrencies) These are replacements for sovereign currencies, replace the dollar, the euro, the yen with bitcoin,” Clayton said. “That type of currency is not a security.”

However, those tokens that are sold during an ICO are securities by Clayton’s definition.

“A token, a digital asset, where I give you my money and you go off and make a venture, and in return for giving you my money I say ‘you can get a return’ that is a security and we regulate that,” Clayton said. “We regulate the offering of that security and regulate the trading of that security.”

This is fairly good news, but we are yet to see the implications of it. For example, many ICOs are emphasizing their token’s utility to escape being seen as a security.

While we are mentioning SEC, another significant headline that came out in the last 24 hours is that Van Eck Associates Corp. and SolidX Partners Inc. filed a request to list a Bitcoin-linked ETF to the U.S. Securities and Exchange Commission on Wednesday, as reported by Bloomberg.

SEC has rejected Winklevoss Bitcoin Trust ETF last year, so we are yet to see if these two companies make the ETF. The important thing is that this fund will be physically backed, meaning they will hold the actual Bitcoin, which would be insured in a theft or loss event.

Another news item regarding regulation and filing is that Circle Internet Financial Limited – a peer-to-peer payments technology company, who obtained the cryptocurrency exchange Poloniex is pursuing both a federal banking license with the Office of the Comptroller of the Currency (OCC) and registration as a brokerage and trading venue with the US Securities and Exchange Commission (SEC), as reported by Bloomberg

Similar news is that Coinbase is aiming at becoming an SEC regulated broker, through an acquisition of securities dealer Keystone Capital Corp. according to their blog post.

Today, we’re announcing that Coinbase is on track to operate a regulated broker-dealer, pending approval by federal authorities. If approved, Coinbase will soon be capable of offering blockchain-based securities, under the oversight of the US Securities and Exchange Commission (SEC) and the Financial Industry Regulatory Authority (FINRA). This step forward is being made possible by our acquisition of a broker-dealer license (B-D), an alternative trading system license (ATS), and a registered investment advisor (RIA) license.

CFTC denies FOIA request for Bitfinex and Tether subpoenas, as reported by Coindesk.

The top U.S. futures regulator has denied a Freedom of Information Act (FOIA) request for subpoenas reportedly issued to crypto exchange Bitfinex and the closely-linked ‘stablecoin’ operator Tether, according to records obtained by CoinDesk.

The FOIA request, filed by an individual who requested anonymity when speaking to CoinDesk, sought “subpoenas issued to iFinex inc. also known as Bitfinex and it’s subsidiary companies, as well as subpoenas issued Tether Limited and its subsidiary companies” and was initially submitted in February.

Thus, we still don’t have the light shed on the controversy surrounding Bitfinex and Tether Stablecoin.

Parity urges users to install the update after discovering a Testnet vulnerability

Users of Ethereum software issued by Parity Technologies face enforced updates this week after warnings a testnet vulnerability could spread to the Ethereum network, according to Parity’s blog post on June 6.

Parity is a UK-based provider of infrastructure software for interacting with the Ethereum network. A blog post from the company June 5 originally flagged the security problem, describing it as a “potential consensus issue with Parity Ethereum.”

For those who don’t know this isn’t the first time Parity had a bug, as in November last year there was a “Parity multisig hack” in which about $300M was frozen and (probably) lost forever.


Analysis


BTC/USD

From yesterday’s low at 7510$, the price of Bitcoin rose up to 7700 which is a 2.37% increase.


Looking at the hourly chart we can see that the price is currently in another cluster below the 0.236 Fibonacci retracement level. However, the price is above the baseline support line and the triangle resistance line. This is a very crucial time for the price of Bitcoin because if the price continues to go higher that may trigger buying and we can see a short-term trend reversal. I think that’s now going to happen, as the likely scenario is that the price fells below those resistance lines again from this current cluster as it did before and retest old lows at around 7000$.


Market sentiment 

Bitcoin is in the buy zone as indicated by hourly chart technicals.

Oscillators are on neutral, and moving averages on a strong buy.


Pivot points

S3 7198.6 
S2 7406.9 
S1 7530.5 
 P 7615.2 
R1 7738.8 
R2 7823.5 
R3 8031.8

ETH/USD

From yesterday’s low at 594$, Ethereum’s price has increased by 1.6% coming to 606$ currently.


As you can see from the hourly chart, the price bounced off the 0.236 Fibonacci level where it found support yesterday, and since then it has broken out of this short-term triangle like pattern and is now back on prior resistance for a retest of support. The price is also above the purple bold line which is the descending channel resistance line.


Market sentiment 

Ethereum is in the buy zone as indicated by the hourly chart technicals.

Oscillators are on buy, and moving averages are on neutral.


Pivot points

S3 562.18 
S2 582.91 
S1 594.79 
 P 603.64 
R1 615.52 
R2 624.37 
R3 645.10

XRP/USD

From yesterday’s low, the price of Ripple has increased by 3.2% from 0.659$ to 0.681$ where it is currently sitting.


Looking at the hourly chart we can see that the price broke out of the symmetrical triangle two days ago on the upside as I’ve projected it would, but my short term target hasn’t been met. The price has stopped out at 0.68$ level and retraced to 0.659$ which was yesterday’s low and is now back on those same levels struggling to make a new high, and I still think it is going to get there which would be slightly below 0.7$


Market sentiment

Hourly chart technicals signal a buy.

Oscillators are on buy, and moving averages are signalling a strong one.


Pivot points

S3 0.61446 
S2 0.64266 
S1 0.65853 
 P 0.67086 
R1 0.68673 
R2 0.69906 
R3 0.72726

Conclusion


Things haven’t changed much since yesterday. We are still yet to see where the prices are going from these levels. As the prices are looking unstable I am expecting another drop to prior lows for a retest, before a short-term trend reversal.

Categories
Crypto Market Analysis

Daily Crypto Update 04.06.2018 – No Trade Zone


General Overview


Market Cap: $345,759,677,827

24h Vol: $16,991,056,608

BTC Dominance: 37.7%

In the last 24 hours, the evaluation of the cryptocurrency market capitalization has been on the rise from 343,187,000,000$ to 354,900,000,000$ at the highest point and has retraced sharply since to 343,918,000,000$.

The market is mixed in color, but the dominant one is red with an average decrease of 4% amongst the top 100 coins. Biggest losers are IOTA which experienced a decrease of 9%, Loom network the same around 9% and MOAC by 8.3%.


News


There haven’t been any major headlines over the weekend that can impact the market’s sentiment, however, those stories that came out as significant are positive overall. Many are analytical in nature, as analysts are eager to see if the prices have bottomed out.

For example, Joost van der Burgt, policy adviser at the Federal Reserve Bank of San Francisco who is leaning on the work of Hyman Minsky and his five stages of an asset bubble (displacement, boom, euphoria, profit-taking, and panic), believes that Bitcoin is in the profit taking stage and that the panic stage is yet to come.

Positive headlines are those regarding blockchain tech adoption and governmental relation to crypto.

China

Baidu, the Chinese multinational technology company specialising in Internet-related services and products, is planning to launch a protocol aimed at reducing mining energy consumption, according to a report by China News Weekly today, June 3.

Spain

Spanish Congress unanimously supported draft legislation that would favourably regulate blockchain technology and cryptocurrencies in the country. However, there are complications with the EU laws compliance, but the attempts to legalise cryptos in Spain are going to be successful.

South Korea

The South Korea National Assembly is set to re-legalise Initial Coin Offerings (ICO) in the country.

Abu Dhabi

Maqta Gateway LLC, a wholly owned subsidiary of Abu Dhabi Ports, has become the first entity in Abu Dhabi to deploy its own blockchain solution, Construction Business News reports June 2.

On the flipside, the negative news is about ZenCash 51% hack

ZenCash became the target of a 51% attack like we saw recently on Bitcoin Gold. The hacker obtained more than 50% of the hashrate, giving him control over the network, but the team at ZenCash acted immediately, containing the attack to only two double spending transactions of 19,000 ZEN which is around 558,000$.


Analysis


BTC/USD

From yesterday’s open, the price of Bitcoin has decreased by only 0.45%. The price has been rising from 7639$ to 7751$ and has retraced since to the 7602$ level where it is currently sitting.


Looking at the daily chart we can see that the price of Bitcoin is in the cross-section of many significant trendlines. The price went above the baseline support (bold black line) but was stopped out at the triangle resistance (bold blue line) and 0.236 Fibo level, and it has retraced back to the baseline support.


Zooming into the hourly chart, we can see that the price broke out from an ascending wedge from the downside and is currently below the baseline support.


Market sentiment

Hourly chart technical signal a sell.

Oscillators are on neutral and moving averages signal a sell.


Pivot points

S3 7341.0 
S2 7520.0 
S1 7619.0 
P 7699.0 
R1 7798.0 
R2 7878.0 
R3 8057.0

ETH/USD

From yesterday’s open, the price of Ethereum has increased by 1.7%. The price went from 594$ to 625$ but it has retraced since to the high of 603$ where it is currently sitting.


Looking at the daily chart, we can see that the price of Ethereum has hit the downward channel resistance line and was repealed by it and is now heading down.


Zooming into the hourly chart, we can clearly see the momentum behind the upward movement, and how the price interacted with the resistance line – it went above it, retested it for support but the support wasn’t there so the price fell below it again and is currently sitting on the support line of the ascending triangle from which it broke previously.


Market sentiment

Ethereum is in the sell zone, as indicated by the hourly chart technicals.

Oscillators are on neutral, and moving averages signal a sell.


Pivot points

S3 343.61 
S2 452.53 
S1 521.49 
P 561.45 
R1 630.41
R2 670.37 
R3 779.29

LTC/USD

From yesterday’s open the price of Litecoin has decreased by 1.38%. The price went from 123$ to 127.9$ at the highest point and has retraced since to 122$ where it is currently sitting.


On the daily chart, we can see that the price of Litecoin went above the retracement zone, but quickly fell into it again leaving a wick on yesterday’s candle.


Zooming into the hourly chart, we can see clearly what happened at these levels – the price went above the 124.87$ support level, retested it for support but it didn’t find it, which is why the price quickly fell below it back to the retracement zone to the prior resistance line, where it did find some temporary support.


Market sentiment 

As in the case of Bitcoin and Ethereum, Litecoin is in the sell zone.

Oscillators are on neutral, and moving averages signal a sell.


Pivot points

S3 110.023 
S2 117.893 
S1 121.657 
P 125.763 
R1 129.527 
R2 133.633 
R3 141.503

Conclusion


We can see that the prices are struggling to get above their resistances even though the buying was triggered. A lot of sideways movement is experienced, and a lot of significant trendlines are near, so without any confirmation as to where the prices are going from here, I conclude that we are in a no trade zone.


Categories
Crypto Market Analysis

Daily Crypto Update 01.06.2018 – Ascending Triangles


General Overview


Market Cap: $335,204,491,129

24h Vol: $16,264,540,111

BTC Dominance: 38.6%

In the last 24 hours, cryptocurrency market capitalisation has been struggling to get past the level of around $335 billion dollars, but no new highs have been made. However, we can see that higher lows have been made as buyers are pushing the evaluation, forming an ascending triangle pattern. 

The market is showing mixed colours, with an average percentage change among the top 100 being very small. Biggest gainers are IOTA by 11%, Hshare 11,28%,  Huobi token 22%.


News


In the last 24 hours, a lot of news has came out. I have filtered out those that are most significant and could impact the market sentiment. Top stories are mostly positive in nature, however, there are some that could impact the market negatively. These are the headlines:

Polish Gov’t Invites BitBay to Join Working Group as Exchange Forced to Leave Country

Recently expatriated Polish cryptocurrency exchange BitBay tweeted yesterday, May 30, that the Polish Financial Supervision Authority (KNF) has asked them to join a Blockchain Working Group.

Tenth Largest Crypto TRON to Leave Ethereum, Launches Beta Version of Own Blockchain

TRON (TRX) launched a beta version of its independent public blockchain at 12 am UTC, today May 31, according to a press release shared with Cointelegraph. Tron is currently the tenth largest cryptocurrency by market capitalisation.

Mary Meeker’s 2018 Internet Trends Report Shows Interest in Crypto ‘Exploding’

Former Wall Street analyst Mary Meeker’s well-known annual Internet Trends report for 2018, published May 30, shows interest in cryptocurrency “exploding” since January of last year. The report also highlights that a course on Bitcoin (BTC) and cryptocurrency technologies made it into the top 10 most popular university classes in 2017.

Spain: Innovation-Aimed Crypto Regulation Wins Cross-Party Support in Congress

Draft legislation that would favourably regulate blockchain technology and cryptocurrencies has received unanimous support in the Spanish Congress, Europa Press reported yesterday, May 30.

Ripple CEO Compares Bitcoin to Napster, Says BTC’s Influence on Market Could Lessen

Brad Garlinghouse, CEO of Ripple (XRP), thinks that Bitcoin’s (BTC) influence on cryptocurrency market prices will eventually decrease, CNBC reported yesterday, May 30.

Coinbase Board Member: Crypto Ecosystem Will Not See Regulation for Years

Kathryn Haun, board member of Coinbase and HackerOne claimed that cryptocurrency and blockchain will not see regulation for years, Techcrunch reports May 31. Haun made her statements on regulation at the Code Conference in California today.

IMF Official Calls for Regulation, Tech Adoption By Banks to Fight ‘Crypto Competition’

An official from the International Monetary Fund (IMF) suggested that central banks need to make fiat currencies “more attractive for the digital age” in an article published May 31. Deputy Director of the Monetary and Capital Markets Department Dong He suggested three responses to combat potential competition to central banks from cryptocurrencies.

Norway’s Largest Bank to Explore Applications for IOTA’s Distributed Ledger Technology

DNB ASA (Den Norske Bank), Norway’s largest financial services group, and the IOTA Foundation (IOTA) have signed a memorandum of understanding (MOU), according to a press release May 31. DNB and IOTA will now reportedly co operate to explore applications of the IOTA Tangle, a “third-generation” distributed ledger (DLT).

US Crypto Exchange Signs Agreement to Offer Fiat-Crypto Trading to Corporate Clients

Seattle-based crypto exchange Bittrex has signed a banking agreement that will allow corporate investors to trade selected cryptocurrencies for fiat, Bloomberg reports today, May 31.

Source: cointelegraph.com


Analysis


BTC/USD

From yesterday’s open, the price of Bitcoin has increased by 2.37% – from 7374$ to 7535$ where it is currently sitting.


On the daily chart, things haven’t changed much. The price is still below the baseline support which now serves as strong resistance.


Zooming into the hourly chart we can see the same pattern as on the global graph for the cryptocurrency market capitalisation – an ascending triangle which is a bullish sign.


Market sentiment

Bitcoin hourly chart technicals signal a strong buy.

Oscillators are on buy and moving averages a strong one.


Pivot points

S3 6951.1 
S2 7212.8 
S1 7349.3 
P 7474.5 
R1 7611.0
R2 7736.2
R3 7997.9

ETH/USD

From yesterday’s open, the price of Ethereum has increased by 4.38% – from 560$ to 584$ where it is now.


Looking at the daily chart, we can see that the price went higher than in the previous two days but has now retraced back to the levels of yesterday’s candle high.


Zooming into the hourly chart, we can see a similar ascending triangle forming and it looks like the breakout is very close. Ascending triangles are bullish in nature, but in this case, it looks more like a rising wedge which is a bearish sign. And if we take the proximity of the 0.382 Fibonacci level which serves as resistance we conclude that the price is likely going to break out from the downside.


Market sentiment 

Ethereum is in the strong buy zone.

Oscillators are on buy, and moving averages are indicating a strong buy.


Pivot points

S3 504.05 
S2 538.11  
S1 557.55  
P 572.17  
R1 591.61 
R2 606.23
R3 640.29

XRP/USD

In the last 24 hours, the price of Ripple has increased by 4%, coming from 0.591$ to 0.614$.


On the daily chart, things haven’t changed much, the price is still in the range between the support at 0.573 and 0.236 Fibonacci retracement levels. The current candle is green but hasn’t exceeded prior two candle wicks.


On the hourly chart, we can see a familiar pattern again, as markets are strongly correlated.


Market sentiment

Ripple is in the buy, as indicated by the hourly chart technicals.

Oscillators are signaling a buy, and moving averages a strong one.


Pivot points

S3 0.54396 
S2 0.57567 
S1 0.59333 
P 0.60738 
R1 0.62504 
R2 0.63909 
R3 0.67080

Conclusion


The global charts, as well as charts from three major cryptocurrencies, are forming an ascending triangle pattern which is a bullish pattern. Technical indicators are also bullish as they are signaling a buy. We cannot conclude that the bottom is in before we see a breakout from the ascending triangle on the upside, but I am pretty sure that we have hit a temporary bottom, and I say temporary because I am expecting new lows, but first, the price needs to be pushed higher to trigger large selling. Watch carefully what happens in the next 24 hours.

Categories
Crypto Market Analysis

Daily crypto update 30.05.2018 – Buying Has Been Triggered, But Who Has More Power?


General overview


Market Cap: $328,089,417,655

24h Vol: $18,528,052,314

BTC Dominance: 39.0%

From yesterday’s low at 303,340,000,000$, cryptocurrency market cap evaluation has increased to 334,675,000,000$ which is the today’s high for now and has since retraced back to around $327 billion dollars.

Crypto Market Daily NewsThe market is currently in green, with an average increase of 7-10% among top 100 coins. Biggest gainers are Bytecoin +26%, 0x +17%,  Theta Token +31%.


Crypto Market Daily News


The top story that came out in the last 24 hours is about South Korea changing the direction with relation to cryptocurrency in a more acceptive way. These are some of the significant headlines:

S. Korea: Financial Regulator ‘Sympathizes’ With Demands to End Crypto-Blockchain Regulatory Split

A South Korean blockchain researcher has criticized the government’s approach to regulation of the technology at the 2018 Seoul Financial Forum, local media reported May 29. Addressing the head of South Korean regulator the Financial Supervisory Service (FSS) Lee Geun-woo, Park Sung-joon, head of the Blockchain Research Center at Dongguk University, said adopting different approaches to cryptocurrency and blockchain was futile. One, he argued, cannot exist meaningfully without the other:

“In the digital asset trading market, virtual currency and blockchains can not be separated because they need the appropriate means of payment.”

Lee Geun-woo responded by saying:

“I sympathize with the words of Park Chan-hee, and I will pass on his suggestions to the financial authorities.”

South Korea: Government Committee Plans to Make ICOs Legal Again

South Korea plans to pursue the road to re-legalizing initial coin offerings (ICOs), local news media reported May 29, citing government officials. According to Business Korea, a National Assembly committee dedicated to studying the so-called ‘Fourth Industrial Revolution’ said it would seek to enhance the legal “basis” of cryptocurrency in the country, part of which would be reversing the ICO ban which the government enacted in September 2017.

$14.5 Bln South African Investment Firm to Launch Crypto Exchange

Sygnia Asset Management, a major South African investment firm with 180 bln rand ($14.5 bln) under management, has revealed that it will launch a cryptocurrency exchange later this year, BusinessTech reported May 25.

Survey: Three out of Ten Germans Are Considering Crypto Investing

Twenty nine percent of Germans are interested in cryptocurrencies as a form of investment, Cointelegraph auf Deutsch reported Tuesday, May 29. German bank Postbank came to this conclusion after a survey of 3,100 Germans, which was conducted from the end of February to the end of March 2018.

Source: cointelegraph.com


Analysis


BTC/USD

In the last 24 hours, the price of Bitcoin has increased by 5,2% – from 7104$ to 7481$ where it is now.


Looking at the daily chart we can see that the price almost went to the triangle support (blue bold line), but hasn’t interacted with it. Currently, price action is forming a cluster below the baseline support (bold black line), which serves as resistance.


If we zoom into the hourly chart, we can see that the cluster has a form of a rising wedge, which is a bearish sign. If we consider that the baseline support serves as resistance, the most likely scenario would be that the price is heading down from here, probably to the triangle support for a proper test.


Market sentiment

Bitcoin is in the buy zone, as indicated by hourly chart technicals.

Oscillators are on buy, and moving averages are on a buy.


Pivot points

S3 6355.1 
S2 6851.1 
S1 7158.1 
P 7347.1 
R1 7654.1 
R2 7843.1 
R3 8339.1

ETH/USD

From yesterday’s opening till now, the price of Ethereum has increased by 10,89% – from 511$ to 567$ where it is now sitting.


As you can see from this daily chart yesterday’s candle showed a strong momentum that was needed to break above the resistance line at 539,5. Today’s candle body is bearly noticeable, and as you can see from the upper wick the price went higher buy was repealed by a fair amount of selling pressure.


If we zoom into the hourly chart we can see that today’s price action is in an upward channel which hight bearly exceeded the prior high levels.


Market sentiment 

Ethereum’s hourly chart technicals indicate a buy.

Oscillators are signaling a buy, and moving averages a strong one.


Pivot points

S3 422.51 
S2 486.39 
S1 526.69 
P 550.27 
R1 590.57 
R2 614.15 
R3 678.03

XRP/USD

From yesterday’s open till now, the price of Ripple has increased by 12,3% – from 0,547$ to 0,614$.


Looking at the daily chart, we can see that the price rose strongly above the resistance line at  0,573$ but was stopped out by 0,236 Fibonacci level which serves as resistance.


Zooming into the hourly chart we can see that the price is currently breaking out from the bull flag, and is on an upward trajectory. The Fibonacci level is very close, so we will see what happens at these levels.


Market sentiment 

Ripple is in the buy zone.

Oscillators are on neutral, and moving averages signal a strong buy.


Pivot points

S3 0.45320 
S2 0.51892 
S1 0.55954 
P 0.58464 
R1 0.62526 
R2 0.65036 
R3 0.71608 

Conclusion


Crypto Market Daily News: As I have said yesterday the lows can trigger some buying, and that’s exactly what happened – we are seeing new buying pressure arising in the markets. The question is how powerful are the buyers? Can they push the prices up to prior levels, and then exceed prior highs? I think not. I think that as soon as the price is pushed a bit higher, which would mean a better price for sellers, they are going to start selling again. They did not want to continue selling on the month’s lows, as they were hesitant to make a mistake losing their bitcoin if the prices go higher, and people who were waiting to get into the bandwagon have entered the market. We will see what happens but for now, I am still bearish.

Categories
Crypto Market Analysis

Daily Crypto Update 29.05.2018 – Price Action is Showing Signs of a Struggle


General Overview


Crypto Coin Market News:

Market Cap: $306,776,676,366 
24h Vol: $15,425,897,276 
BTC Dominance: 39.8%

In the last 24 hours, cryptocurrency market capitalization has been declining steadily from $328,1B which was yesterdays high to $306B where it is currently sitting. 
Crypto Coin Market News:

The market is mostly in red as you would presume, with an average decline of 3-4% among top 100 coins. There are some in green as well. For example, Cardano (ADA) is up by 6.4%, Icon by 2.16%, Golem by 5% and CyberMiles is the biggest gainer amongst the top 100, experiencing an increase of 21%.


Crypto Coin Market News


Top stories that came out in the last 24 hours are mostly about fundamentals and are analytical in nature. As far as sentiment is concerned, it looks like the tone is bullish reassuring.


Despite Hitting Monthly Price Lows, Bitcoin Network Fundamentals Keep Growing

While the crypto markets overall are seeing a downward trend, some of the fundamental Bitcoin indicators such as the hashrate and the number of the Segregated Witness (SegWit) transactions are growing steadily, indicating the continued development of the network.

Ethereum’s Price Drop Possibly Due To Large ETH Sell-Off By EOS, Report Says

Etherscan shows that wallet address marked as EOSCrowdsale still has around 200,000 ETH, and wallet address marked EOS-Owner around 916,000, together equaling over 1.1 mln ETH.

1090 DApps And 700 Tokens Launched on Ethereum Network in 2017, Analyst Says

In 2017, 1,090 decentralized applications (DApps) and more than 700 tokens have been deployed on the Ethereum (ETH) network, Finance Magnates reports May 28.

Bank of England: Central Bank Digital Currencies Can Jeopardize Commercial Banks

The Bank of England has issued a May 2018 staff working paper, which suggests that the adoption of central bank digital currencies (CBDCs) could pose a competition threat to commercial banks.

Source: cointelegraph.com


Analysis 


BTC/USD

From yesterday’s open, the price of Bitcoin dropped by 3.23% going from $7343 to $7117 where it is currently sitting.


Looking at the daily chart we can see that the price is between the baseline support (black line) and the triangle support (blue line). After those, there is a third support level which is an unconfirmed baseline support 2 (dotted line). The price is likely heading down toward one of them, as the search for support continues.


Zooming into the hourly chart we can see that we are about $135 away from the triangle support line at around $7000 and that the price is going to meet that level. When the price does reach that level, I would be looking for either a sign of a trend reversal or trend continuation which is a more likely scenario from a probability standpoint. If the trend continues I am expecting the price of Bitcoin to fall to the dotted line which is an unconfirmed baseline support 2 at around $6600.


Market sentiment

  • Bitcoin hourly chart technicals signal a sell.
  • 9 oscillators are on neutral, and 11 moving averages signal a sell.

Pivot points

S3 6448.5 
S2 6823.9 
S1 6960.9 

P 7199.3 

R1 7336.3 
R2 7574.7 
R3 7950.1

ETH/USD

From yesterday’s open, the price of Ethereum has dropped by 7.68% from $568.9 to $522 where it is currently.


On the daily chart, we can see that the price bounced off of the 0.236 Fibonacci level, but judging by the hight of the candle the momentum behind the bounce was not strong enough to even come back to the prior support line which now serves as resistance at $539.5.


Zooming into the hourly chart, we can see that the price action is currently in a triangle from which it’s likely heading lower, and we are going to see a breakout from the downside.


Market sentiment

  • Ethereum is in the sell zone.
  • Oscillators are on buy, but with 9 on neutral, and moving averages signal a sell.

Pivot points

S3 363.16 
S2 444.66 
S1 478.32 

P 526.16 

R1 559.82
R2 607.66 
R3 689.16

XRP/USD

In the last 24 hours, the price of Ripple has decreased by 4.83% – from yesterday’s open at $0.604 to $0.58.


Looking at the daily chart we can see that the price is interacting with the prior support which now serves as resistance at $0.573.


If we zoom into the hourly chart we can see that the price is above it, but we need to wait for the candle to close to be sure, as selling pressure can slap the price back below it, leaving a wick.


Market sentiment

  • Ripple hourly chart technical signal a buy.
  • Oscillators are on buy, and moving averages signal a buy.

Pivot points 

S3 0.44321 
S2 0.50486 
S1 0.52601 

P 0.56651 

R1 0.58766 
R2 0.62816 
R3 0.68981

Conclusion


Crypto Coin Market News: Prices are getting pushed to new lows which may trigger some buying. That’s why I am expecting some short-term sideways movement, before another final drop. Bitcoin is near the support levels, Ethereum is in a triangle and Ripple is struggling to move back above the support line which means that price action is showing signs of a struggle. These are significant levels on which the prices of three major cryptos are at the moment and what happens today will affect what happens in the following days. If these lows trigger buying, we can see the prices bounce back to the prior high level, if not we are in for lower lows.

Categories
Crypto Market Analysis

Daily Crypto Update 28.05.2018 – Major Support Has Been Broken


General Overview


Market Cap: $312,693,245,353
24h Vol: $15,021,077,612 
BTC Dominance: 39.3%

Over the weekend, cryptocurrency market capitalisation has been bouncing in a range from $325B to $336B, and weeks low has at around 321 billion dollars. This morning the market cap has dropped below what seems as support level at $325B, in a straightforward manner.

Crypto Market NewsThe market is currently in red, with approximately 4-8% decrease among top 100 cryptocurrencies. Biggest losers are Augur -10%, Fusion 14.23% and Centrality 10.86%. There are some in green like All Sports +25% and MyBit Token +24%, but they are newly introduced coins to the market.


Crypto Market News


There aren’t any significant stories that came out over the weekend and in the last 24 hours. As the market plummets, many are analytical in nature and have a bearish tone. These are some of most notable headlines:

Bitcoin and Crypto on Continuous Decline: Major Factors and Trends

Analyst Says Bitcoin May Drop to $5,500 Before New Upside In Q3/Q4 2018

Spanish Central Bank Governor Perceives Cryptocurrency Risks, Distributed Ledger Technology Potential

Buy Bitcoin, Sell Your Altcoins, Says Pioneering Wall Street Blockchain Analyst


Analysis


BTC/USD

In the last 24 hours, the price of Bitcoin has dropped by 1.56% coming from 7326$ to 7212$ where it is currently sitting.


The most significant thing that we see on the daily chart is that the price has fallen below the baseline support, and is now heading to the second one which intersects the ending point 0 of the Fibonacci retracement.


Zooming into an hourly chart we can see the interaction with the baseline support. The price oscillated above and below it, struggling to find stable support, and the wedge prior support served as stronger resistance which repealed the price and pushed it lower.


Market sentiment

  • Bitcoin hourly chart technicals signal a sell.
  • Oscillators are on neutral, and moving averages on a strong sell.

Pivot points 

S3 6896.8
S2 7111.1 
S1 7225.4 
P 7325.4 
R1 7439.7 
R2 7539.7 
R3 7754.0 

ETH/USD

From yesterdays open until now, the price of Ethreum has decreased by 8.94%, and that’s not the lowest its been. The price went from 585$ to 503$ but quickly bounced from there to 532$ where it is currently sitting.


Looking at the daily chart we can see that the price went to touch the 0.236 Fibonacci level and left a wick below it which is the mentioned drop to 503$.


Looking at the hourly chart, we can see the interaction with the support at 539.5$. The price is currently on an upward trajectory heading back to that support for a retest.


Market sentiment

  • Ethereum is in the sell zone, as hourly chart technicals signal a sell.
  • Oscillators are on neutral, and moving averages on a strong sell.

Pivot points

S3 492.75
S2 532.10
S1 550.55
P 571.45
R1 589.90
R2 610.80
R3 650.15


XRP/USD

In the last 24 hours, the price of Ripple has dropped by 5.64% coming from 0.608$ to 0.57495$ where it is now sitting.


On the daily chart, we can see that the price is below the 0.236 Fibonacci level and is currently sitting on the support which was the prior range resistance.


Zooming into the hourly chart we can see the interaction with the support level, and judging by the momentum behind the down move, the price is likely to be heading down further.


Market sentiment 

Ripple is a sell, as hourly chart technicals signal.

Oscillators are on buy, and moving averages on a strong sell.


Pivot points

S3 0.57247 
S2 0.58842 
S1 0.59624 
P 0.60437 
R1 0.61219
R2 0.62032 
R3 0.63627

Conclusion


Crypto Market News: As seen on the charts, major support lines have been crossed below and the prices are now heading even further down as the strong momentum behind the down move has to find strong buying pressure in order to see a trend reversal.

Categories
Crypto Market Analysis

Daily Crypto Update 24.05.2018 – The Prices Found First Support


General Overview


Crypto News Daily Updates:  
   Market Cap: $323,628,725,976 
       4h Vol: $20,747,314,659 
BTC Dominance: 39.1%

In the last 24 hours, the cryptocurrency market cap evaluation has fallen from 363,2 billion dollars to 320,1 billion dollars, which is a 43,1 billion dollar decrease.

Crypto Daily News

The market is in red with the biggest losers being around -10%. Only Steem +3,2% and 0x +9,1% are in green


Crypto Daily News


The top stories that came out in the last 24 hours are the following:

Coinbase Announces Launch of Coinbase Pro, Paradex Acquisition

Coinbase has announced Coinbase Pro, the new version of its trading platform GDAX, in a blog post Wednesday. The announcement comes on the same day as Coinbase’s acquisition of relay platform Paradex.

Bloomberg: US DOJ Opens Criminal Investigation Into BTC, ETH Price Manipulation

A criminal probe into Bitcoin (BTC) price manipulation by crypto traders has been opened by the U.S. Department of Justice (DoJ), Bloomberg reports today, May 24. Bloomberg cites four unnamed sources close to the matter as reporting that the criminal investigation – run by U.S. federal prosecutors and the Commodity Futures Trading Commission (CFTC) – will look into how traders could have engineered prices by illegal activities like spoofing and wash trading.

UN’s Project Services Arm Partners With IOTA to ‘Expedite’ its Mission With Blockchain

The United Nations signed a “memorandum of understanding” with blockchain platform IOTA to explore how the technology can increase efficiency, the two parties confirmed May 22. In a press release about the partnership, which features the United Nations Office for Project Services (UNOPS), the organization said the focus was on cutting intermediaries using blockchain.

Source: cointelegraph.com


Analysis


BTC/USD

From yesterday’s, open the price of Bitcoin has decreased by 7.67% from $7954 to $7355 where it is currently.


Looking at the daily chart the most important thing we see is that the price is currently interacting with the baseline support 1 which was the main support line from 14.07.2017, and held pretty strong in the past. Below that baseline is another unconfirmed which may serve as support if this one is broken.


Zooming into an hourly chart we can see the interaction with the support baseline, and that the price is currently below it. That doesn’t mean that the price is going further below, as this has happened twice before, the price interacted with that baseline support. We will see how today’s candle closes, but I am expecting a wick on the daily chart.


Market sentiment


  • Bitcoin is in the sell zone.
  • Oscillators are 9 on neutral, and moving averages signal a sell. 

Pivot points

S3 6404.6 
S2 7021.9
S1 7258.3 
 P 7639.2 
R1 7875.6 
R2 8256.5 
R3 8873.8

ETH/USD

In the last 24 hours, the price of Ethereum has dropped by 9.6% – from $649 to $586.5 where it is now.


Looking at the daily chart, we can see that the price is below 0.382 Fibonacci level and is looking for support at the levels of prior range resistance. As you can see from the wick, there was a good amount of buying pressure which propelled the price in an upward trajectory.  The price went above 0.382 Fibo level again for a while but has retraced since leaving a wick, which indicates the equal amount of selling pressure from above.


On the hourly chart, you can see that the price touched the prior resistance at $539.5 and bounced quickly, but it looks like now its entering seller’s territory. 


Market sentiment

  • Ethereum hourly chart technical signal a sell.
  • Oscillators are 9 on neutral, and moving averages signal a sell. 

Pivot points

S3 425.88
S2 511.34 
S1 544.12 
 P 596.80 
R1 629.58 
R2 682.26 
R3 767.72

XRP/USD

In the last 24 hours, the price of Ripple has dropped from $0.637 to $0.573 where it found temporary support and is now sitting at $0.615 which an overall decrease of 3.36%.


Looking at the daily chart, we can see that the price fell below 0.236 Fibonacci retracement level with strong momentum.


Zooming into an hourly chart we can see where the price found support, and it was on the levels of prior range resistance at $0.573. As you can see currently the price is up again, but on the same levels from which it has fallen before, which means that sellers are near, so we can expect another drop from these levels. 


Market sentiment

  • Ripple is in the neutral zone.
  • Oscillators and moving averages are signaling a neutral.

Pivot points

S3 0.46433
S2 0.53360
S1 0.56156
 P 0.60287
R1 0.63083
R2 0.67214
R3 0.74141

Conclusion


As prices of three major cryptocurrencies only made a quick dip toward their first support from which they bounced back to the prior high, I am expecting to see some short-term upside movement in the form of an upward channel after which the prices are likely to be heading down again for another low for a proper retest.


Categories
Crypto Market Analysis

Daily crypto update 23.05.2018 – After a big drop, the price is struggling for support.


General overview


Market Cap: $348,018,621,395 
24h Vol: $18,262,368,943 
BTC Dominance: 38.8%

In the last 24 hours, cryptocurrency market capitalization dropped from $383B to $342B, which is a decrease of 41 billion dollars in the evaluation.

cryptocurrency market capitalization dropped from $383B to $342B

The market is currently in red, with an average decrease in the price of 10%. Biggest losers among top 100 are Verge -14,7%, 0x -14,3%, Bitcoin Diamond 15,6%, and the only one crypto that’s in green is Bitcoin Private +7%.


News


Top stories that came out in the last 24 hours are mostly about blockchain tech adoption and acceptance, however, after the big drop in the evaluation, there is much analytical news as well.

These are some of the significant headlines:

Mitsubishi, MUFG Conduct Successful Pilot Payment With Major Thai Bank’s Blockchain

Several major global banks have successfully completed a cross-border payment pilot test using Thai bank Krungsri’s (Bank of Ayudhya) Blockchain Interledger, according to a press release May 22.

Bitcoin Price Is Struggling After Blockchain Week, Possible New Regulatory Pressure

Cryptocurrencies continue to slow down today as all major coins are in the red on Tuesday. Bitcoin (BTC) price is struggling for gains above $8,500 following concerns over increased regulation according to Naeem Aslam, chief market analyst at Think Markets:

“The recent selloff has come from the news out of China that the ICO [initial coin offering] market is still very active and there are fears that China will further increase the strict regulation.”

Russian State Duma Almost Unanimously Approves First Reading of Crypto Industry Bill

Russia’s parliament the State Duma approved the first reading of new laws regulating the crypto industry Tuesday, May 22. The laws define cryptocurrencies and tokens as property, and lay out specifications for interacting with crypto and blockchain-related technologies.  

US: Crypto Could Pose a Problem for Candidates Seeking Security Clearances

The recognition of Bitcoin as a form of foreign currency could potentially have an impact on decisions in recruiting new employees to the US Department of Defence (DoD), Bloomberg reported May 22. The Pentagon’s chief concern is whether investment in cryptocurrencies indicates criminal intent or constitutes an increased predisposition toward risky personal behavior. This could detrimentally affect a job candidate’s profile should the DoD be considering them for a security clearance.

Argentinian Bank Now Using Bitcoin for Cross-Border Transactions

Argentinian Banco Masventas (BMV), has announced a partnership Bitex to enable clients to use Bitcoin for international payments as an alternative to SWIFT, according to a Facebook post May 21. Bitex is a blockchain-based financial services provider based in Latin America.

Nobel Prize Economist Says That Crypto the Latest in a Pattern of Alternative Currencies

In a May 21 article entitled “The Old Allure of New Money,” the 2013 Nobel laureate of Economics Robert Shiller calls crypto the newest iteration of alternative currency ideas.


Analysis


BTC/USD

In the last 24 hours, the price of Bitcoin has dropped by 6,7% coming from 8400$ to 7847$ where it is currently sitting.


Looking at the daily chart, we can see that the price of Bitcoin is back in the wedge pattern, as I predicted in my weekly forecast. The drop in price has to find new support, and the 0.236 Fibo level will serve as support at least temporarily, so watch out what happens at these levels.


Looking at the hourly chart we can see that last 4 candles are dojis, meaning that the price is experiencing a lot of buying and selling pressure and considering the proximity of the 0.236 Fibonacci level we can conclude that price is struggling and looking for support there.


Market sentiment

  • Bitcoin hourly chart technicals signal a sell.
  • Oscillators signal a sell and moving averages a strong one.

Pivot points

S3 6427.8 
S2 7387.3 
S1 7809.2 
P 8346.8 
R1 8768.7 
R2 9306.3
R3 10265.8

ETH/USD

From yesterday’s open the price of Ethereum has dropped by 10%, coming from 693$ to 621$ where it is currently.


On the daily chart, things are looking very bearish. The price is currently at the levels of prior resistance, looking for support, and it’s near the 0.382 Fibonacci retracement level, but we haven’t seen the interaction with it just yet.


On the hourly chart, we can see that the price is struggling for support, as indicated by the wicks we are seeing on the candles. The price is likely going to bounce back quickly after this massive and fast drop occurred, before continuing to go down further.


Market sentiment

  • Hourly chart technicals signal a sell.
  • Oscillators are on neutral, and moving averages on a strong sell.

Pivot points

S3 539.11 
S2 598.95 
S1 619.48 

P 658.79 

R1 679.32 
R2 718.63 
R3 778.47

XRP/USD

In the last 24 hours, the price of Ripple has dropped by 8,86% coming from 0,676$ to 0,617$ where it is now.


On the daily chart, we can see that the price of Ripple has fallen below the 0.236 Fibonacci level. From there on the only significant level, I see stopping this momentum is at the close of the candle before one that broke that level from the upside, which is at 0,54$.


Hourly chart shows us the interaction with the Fibo level, and as you can see it was broken with a strong momentum, and the current situation is similar to that of Bitcoin and Ethereum in a sense that there is a lot of wick on the current candles.


Market sentimet

  • Ripple is in a sell zone.
  • Oscillators are on sell, and moving averages a strong one.

Pivot points

S3 0.56621
S2 0.60802
S1 0.62285

P 0.64983

R1 0.66466
R2 0.69164
R3 0.73345

Conclusion


The price is struggling to find support after a massive and quick drop in price. I expect the prices to quickly bounce to the 0.5 levels of prior highs before another drop in price. We are going to see a lot of sideways price action today, as indecision is taking over, and reactions from participants are unclear. 

Categories
Crypto Market Analysis

Daily crypto update 22.05.2018 – New Corrective Move Has Started


General overview


Crypto Daily Update:

Market Cap: $377,526,863,027 
24h Vol: $15,782,191,998 
BTC Dominance: 37.6%


From yesterday’s high at 391,920,000,000$ crypto market cap has decreased to $377,1B steadily.

The market is in red, with approximately 3%-5% average decrease in value from top 100 cryptocurrencies.


News


Top stories that came out in the last 24 hours are mostly positive, however, there are no significant news that can impact the market. These are the most significant headlines:

Polish Finance Ministry Rolls Back Crypto Tax, Promises Smarter Regulation

Poland’s Ministry of Finance will temporarily suspend tax collection for cryptocurrencies, the Polish Press Agency (PAP) reported May 18. The Ministry says it will conduct an “in-depth analysis” of the crypto space to inform better regulation and taxation policies going forward.

Japan’s Largest Bank and Cloud Delivery Giant Akamai Announce Blockchain Payment Network

The Mitsubishi UFJ Financial Group (MUFG) has partnered with major U.S.-based cloud delivery platform Akamai Technologies to release a global payment network based on blockchain, Cointelegraph Japan reports today, May 21.

Walmart Files Patent for Blockchain-Based Customer Marketplace

Walmart has filed a patent for a blockchain-based marketplace for reselling purchased products, according to a US Patent and Trademark Office USPTO patent filing from May 17.

Thai SEC Holds Focus Group to Clarify New Crypto, ICO Regulations

Thailand’s Securities and Exchange Commission (SEC) held a focus group on cryptocurrency regulation today, May 21, streamed on Facebook Live. The hearing focused on the SEC’s approach to crypto-related businesses and fundraising through Initial Coin Offerings (ICO), local news outlet Siam Blockchain reports.

Germany’s BaFin Visits National Bank of Georgia to Discuss Crypto Regulations

One of the largest financial supervisors in Europe met with the National Bank of Georgia (NBG) and other members of the finance sector to discuss cryptocurrency regulation, according to a post on the NBG’s site May 18.

Bank of England Issues Working Paper on Central Bank Digital Currencies

On May 18, the Bank of England released a staff working paper, laying out various scenarios of possible risks and financial stability issues of central bank digital currencies (CBDCs).


Analysis


BTC/USD

From yesterday’s open at 8525$ the price of Bitcoin has decreased by 3,18% dropping to 8253$ where it is currently sitting.


Looking at the daily chart we can see that the price fell below 0,382 Fibonacci retracement level and is currently at the levels of the opening of the day before yesterday’s candle, which was a green candle, which broke out from the wedge pattern.


Zooming into an hourly chart we can see clearly what happened at the Fibonacci level. As you can see the momentum behind the move was strong, and the price is likely heading back to the wedge resistance for a retest.


Market sentiment

  • Bitcoin hourly chart technical signal a strong sell.
  • Oscillators are signaling a sell, and moving averages a strong one.

Pivot points


S3 7781.1 
S2 8116.0 
S1 8257.8 

P 8450.9 

R1 8592.7 
R2 8785.8 
R3 9120.7

ETH/USD

In the last 24 hours, the price of Ethereum has decreased by 4,2% coming from 715$ to 685$ where it is currently sitting.


Looking at the Ethereum daily chart we can see that the price was repealed by the resistance at 712$ and that from there the price only fell further.


Zooming into the hourly chart we can see that the price fell even further, but quickly bounced back to the support levels on which it’s currently sitting. The price found some temporary support, but judging by the momentum behind the move, that support won’t hold again.


Market sentiment

  • Ethereum hourly chart technicals signal a sell.
  • Oscillators are on buy, but moving averages signal a strong sell.


Pivot points

S3 632.57 
S2 666.63 
S1 681.38 

P 700.69 

R1 715.44 
R2 734.75
R3 768.8

XRP/USD

From yesterday’s open at 0.6991$ the price of Ripple has decreased by 4,56% dropping to 0,6673$.


On the daily chart, things haven’t changed much, the price is still in the range between 0,382 and 0,236 Fibonacci retracement levels, and after a move up it has retraced to the start of that move, looking for support.


On the hourly chart, we can see that the price was repealed by the resistance of the triangle from which it tried to burst but failed which propelled the price in a downward trajectory.


Market sentiment

  • Ripple is still in the sell zone.
  • Oscillators are on buy, and moving averages signal a strong sell.

Pivot points

S3 0.61103 
S2 0.64647
S1 0.66073

P 0.68191

R1 0.69617
R2 0.71735
R3 0.75279

Conclusion


Crypto Daily Update: As I have projected in my weekly forecast, the correction is still in play and we are in for new lows. The prices failed to break resistance at prior highs, and as they entered sellers territory the selling has begun.

Categories
Crypto Market Analysis

Daily Crypto Update 21.05.2018 – Indecision


General Overview


Crypto Market Update Today:

Market Cap: $389,840,003,354

24h Vol: $17,523,547,047

BTC Dominance: 37.2%

In the last 24 hours, cryptocurrency market cap has increased from $375B to slightly below $390B.

Crypto Market Update TodayThe market is mostly in green, with the biggest gainers among top 100 being Tron +14%, Skycoin 10%, Holo 20%.


News


There isn’t any significant news that came out during the weekend. Top stories are therefore analytical in nature or follow-ups from prior stories.  These are some of the more significant headlines:

Iran and Russia Discuss Transacting in Crypto to Avoid International Sanctions

Iran and Russia could start using cryptocurrencies to avoid Western sanctions, Russian news portal RBC reported yesterday, May 17.

Norway Central Bank Considers Developing Digital Currency

Norway’s central bank, Norges Bank, is considering developing its own digital currency as a supplement to cash to “ensure confidence in money and the monetary system”, according to a working paper May 18.

Former UK Visa CEO Takes Helm of Crypto Consumer Payment Startup

The former head of Visa in the UK and Ireland has joined a startup bringing crypto to consumer payments, Business Insider NL reports today, May 19.

WSJ: Coinbase Spoke to U.S. Regulators About Acquiring Federal Banking License

Major U.S. cryptocurrency exchange and wallet Coinbase spoke to regulators about obtaining a federal banking charter, according to a report by the Wall Street Journal (WSJ) May 18.

Source: cointelegraph.com


Analysis


BTC/USD

From yesterday’s open, the price of Bitcoin has increased by 3.4%, going from $8229 to $8510 where it is currently sitting.


On the daily chart, we can see that the price is currently a red doji above 0.382 Fibonacci retracement level.  We can also see a breakout from the falling wedge.


Zooming into an hourly chart, we can see the interaction with the Fibo level, and the momentum behind the up move. Price action formed a double top, with the last top’s candles closed with two massive wicks from the upside, which indicates selling pressure.


Market sentiment

Bitcoin is in the buy zone, as indicated by hourly chart technicals.

Oscillators are on buy, and moving averages on a strong one.


Pivot points

S3 7578.2 
S2 8004.6 
S1 8264.2 
P 8431.0
R1 8690.6 
R2 8857.4 
R3 9283.8

ETH/USD

The price of Ethereum has increased by 3.34% from yesterday’s open, going from $690 to $712,8 where it is currently.


Looking at the daily chart, we can see that the current candle is a red doji, like in the case of Bitcoin, and it sits at the levels of prior high.


Zooming into an hourly chart, we can see that the price has retraced to retest the support, which is on the levels of prior high at $712. We can also see a breakout from a triangle which wasn’t that strong, as the impulse behind the move looks like any other prior move.


Market sentiment

Ethereum is in the neutral zone, as hourly chart technicals are on neutral.


Pivot points

S3 638.08 
S2 673.30 
S1 694.40 

P 708.52 

R1 729.62 
R2 743.74 
R3 778.96

XRP/USD

In the last 24 hours, the price of Ripple has increased by 3.17%, from $0,67250 to $0,69436. The price has been steadily rising and is now facing first strong resistance.


On the daily chart, we can see that the current candle is red, and is sitting at the levels of prior high.


The hourly chart paints a clearer picture. We can see that the price is still in an upward channel which is inside the symmetrical triangle pattern. The price found resistance on the triangle’s resistance line levels and is currently struggling to keep up the upward movement.


Market sentiment

Hourly chart technicals are on neutral, so the price of Ripple is currently indecisive.


Pivot points

S3 0.61264 
S2 0.65176 
S1 0.67536 

P 0.69088 

R1 0.71448 
R2 0.73000 
R3 0.76912

Conclusion


Crypto Market Update Today: In the last day, we have seen an upward movement has been stopped by first major resistance, as seen on the charts from three major cryptocurrencies that we are covering in this daily report. The market is currently showing signs of indecision indicated from the current candles being Dojis. We are likely to see a move down, which would be a final corrective move, before a new runup to new highs.

Categories
Crypto Market Analysis

Daily Crypto Update 18.05.2018 – Lower Lows Ahead


General overview


Crypto Market Cap Live Update:

Market Cap: $370,028,549,685

24h Vol: $19,283,416,338

BTC Dominance: 37.4%

In the last 24 hours, the crytocurrency market cap went from $381,331,000,000 to $391,463,000,000 which was yesterdays high. Since then, the evaluation has fallen to $361,113,000,000 this morning, and is slightly up from then.

Crypto Market Cap Live UpdatAs you would have suspected, the market is mostly in red, with an average decrease of 4-6% per coin amongst the top 100. Some of the biggest losers are iExec RLC -17%, Dragonchain -13%,  biggest gainers are Syscoin +19.3% and Huobi token 11.95%.


News


Top stories that came out are either about blockchain tech adoption or familiar names adopting it, but we can also see some negativity and criticism. These are some of the significant headlines:


Chinese IT Ministry Cryptocurrency Ratings Released: Ethereum 1st, Bitcoin 13th of 28

China’s Ministry of Industry and Information Technology has released its official cryptocurrency ratings. The “domestic experts” awarded Ethereum 1st and Bitcoin 13th out of 28 places. May 17. First-rate domestic experts and scholars” contributed to the ratings, which they calculated on the basis of three indexes: “technology,” “application” and “innovation.”


Germany’s 2nd Largest Stock Exchange To Launch Zero-Fee Crypto Trading App

Germany’s second largest stock exchange, the Stuttgart Börse, which reportedly has a trading volume of $100 bln, has announced it is launching a zero-fee cryptocurrency trading app, Thursday, May 17. The smartphone app, dubbed ‘Bison,’ will be free to use as of Autumn 2018, and has been developed together with fintech startup Sowa Labs.


JP Morgan Announces Prototype Blockchain Platform to Streamline Capital Markets Infrastructure

J.P. Morgan Chase & Co presented a prototype of its blockchain platform for capital markets, which aims to cut costs and enable smoother securities transactions. The announcement took place at NY’s Consensus conference Wednesday, the Wall Street Journal reported May 16.


Wall Street Journal Research Finds ‘Red Flags’ In almost 19% Of ICOs

The Wall Street Journal released findings from its analysis of almost 1500 initial coin offerings (ICOs) May 17, concluding 18.6% of them raised “red flags.” The latest source to investigate the still-booming ICO market, the WSJ warned that of the 1450 offerings it found, 271 of them were using what it described as “deceptive or even fraudulent tactics.”


JPMorgan Creates and Fills New Position of Head of Crypto Assets Strategy

Leading US banking group and financial services firm JPMorgan Chase has recently created and filled the new position of head of crypto-assets strategy, Business Insider reported today, May 17. London-based Oliver Harris, 29, will take the new role, reporting to the head of blockchain development, Umar Farooq. Harris will also lead JPMorgan’s internal blockchain project Quorum, which began testing by JP Morgan Chase and the National Bank of Canada last month.


Bitfinex Requires Customer Tax Info which it ‘May Exchange’ with Gov’t, Tax Authorities

Cryptocurrency trading platform Bitfinex has recently distributed a letter to certain users, saying that they are required to disclose their tax information, which the exchange may share with the government, according to a statement from the exchange on Twitter May 17.


Tel Aviv Stock Exchange Develops ‘First Of A Kind’ Blockchain Lending Platform

The Tel Aviv Stock Exchange (TASE) has developed a “first of a kind” blockchain-based securities lending platform, according to a press release May 16. The new platform was completed in partnership with Israeli fintech firm The Floor, global professional services company Accenture, and Intel.


Swiss Government Requests Study on State-Backed Digital Currency

The Federal Council of the Government of Switzerland has requested a report on the risks and opportunities of introducing its own state-backed digital currency, or so called “e-franc”, Reuters reported May 17.


Analysis


BTC/USD

From yesterday’s open at $8382 the price of Bitcoin has decreased by 3.11% coming to $8116 where it is now sitting. The price has fallen even further to $7940 but bounced back quickly to the levels at which it is now.


Looking at the daily chart we can see that the price is below the 0.382 Fibo level in a downward trajectory heading toward the 0.236 level.


On the hourly chart, we can see that the price is back at prior support, which now serves as resistance.


Market sentiment

Bitcoin hourly technicals signal a sell.

Oscillators are in favor of sell even though 8 are signaling neutral, and moving averages are indicating a sell.


Pivot points:

S3 7173.6 
S2 7673.3 
S1 7863.8 

P 8173.0 

R1 8363.5 
R2 8672.7 
R3 9172.4

ETH/USD

From yesterday’s high at $712, the price of Ethereum fell to $660 this morning but has since bounced back a bit to $680 where is now sitting, leaving an overall decrease of 4.6%.


On the daily chart, we can see that the price found support at the 0.5 Fibonacci level and has increased since it hit it.


On the hourly chart, we can see the interaction with the 0.5 Fibo level. The price went below it and quickly bounced back, but it is currently at the prior support levels which now serve as resistance.


Market sentiment

Ethereum is still in the sell zone.

Oscillators and moving averages both signal a sell.


Pivot points

S3 565.61
S2 624.01
S1 645.93

P 682.41

R1 704.33
R2 740.81
R3 799.21

XRP/USD

From yesterday’s open at $0.7 the price of Ripple has decreased by 5.3% to $0.67 where it is now sitting.


Looking at the daily chart we can see that things haven’t changed that much. The price action is still stuck between 0.382 and 0.236 Fibonacci levels. Today’s candle is green but it hasn’t exceeded prior highs.


The hourly chart tells us that the price broke out of the upward channel from the downside, found tempory support and is currently hovering around the levels of prior support which now serves as resistance.


Market sentiment

Ripple hourly technicals signal a sell.

Oscillators and moving averages are both signaling a sell.


Pivot points

S3 0.54850
S2 0.61100
S1 0.63479

P 0.67350 

R1 0.69729
R2 0.73600 
R3 0.79850 

Conclusion


Crypto Market Cap Live Update: The prices of three major cryptos that we cover in this daily report have experienced the same thing in the last 24 hours – breakout to the downside and retesting of prior resistance for support. After this retest is done I am expecting another downside movement and creation of lower lows.

Categories
Crypto Market Analysis

Daily Crypto Update 16.05.2018 – New Lows Ahead


General overview


Daily Crypto Market Update:

Market Cap: $377,867,819,649

24h Vol: $22,547,487,155

BTC Dominance: 37.2%

From yesterdays highest point at $412,9B  cryptocurrency market capitalization evaluation fell approximately by 40B, coming to $372,9B this morning.

cryptocurrency market capitalization

Amongst the top 100 coins, about 98% are in red, with an average decrease in percentage from 13%. Biggest losers are Augur -15%, Mixin -16%, Mithil -22%, Kin -22%, Salt – 15%. Out of those who are in green, Wax is the biggest gainer, increasing by 4%.


News

Top stories that came out in the last 24 hours are mostly positive in sentiment. There are many established companies mentioned starting to adopt blockchain technology, or starting their own blockchain projects. Here are some of the significant headlines:


IBM Partners With Veridium Labs To Let Companies Track Carbon Footprint Via Blockchain

IBM announced a partnership with Veridium Labs to tokenize carbon credits that will allow companies to track their carbon footprint with blockchain today, May 15, in a press release shared with Cointelegraph.


FedEx CEO: Blockchain Is The ‘Next Frontier’ For Global Supply Chains

Delivery services multinational FedEx said it is “quite confident” blockchain has “big, big implications” for supply chains in a speech May 14, as it continues engagement with the technology.


Coinbase Targets ‘$10 Bln’ Institutional Investor Market With New Suite Of Products

The four products – Coinbase Custody, Coinbase Markets, The Coinbase Institutional Coverage Group and Coinbase Prime – all focus on alleviating major concerns that have allegedly caused institutional investors to hold back from entering the cryptocurrency space so far, such as security and regulatory compliance.


World’s Fifth Largest Bank To Trial Own Cryptocurrency In 2019

The banking unit of Japan’s Mitsubishi UFJ Financial Group (MUFG) plans to trial its own cryptocurrency as early as 2019, Cointelegraph Japan reports today, May 15.


Two Ex-JPMorgan Blockchain Leaders Reveal New Decentralized App Store Startup

The Two former leads of JPMorgan’s blockchain program unveiled a new startup, a decentralized app (DApp) store, Fortune reported yesterday, May 14.


Amazon And ConsenSys’ Startup To Offer Simplified Blockchain Platforms

Amazon Web Services (AWS), the tech giant’s cloud computing arm, is partnering with ConsenSys’ blockchain startup Kaleido to offer simplified blockchain cloud platforms for its clients, CNBC reports today, May 15.


HTC Reveals Plans To Launch Blockchain-Powered Smartphone

Consumer electronics corporation HTC has unveiled “the first native blockchain phone”, HTC Exodus, which will launch with support for multiple blockchains, including Bitcoin (BTC) and Ethereum (ETH) networks, PCMag reported May 15. HTC Vive creator Phil Chen announced the forthcoming project at the Consensus conference in New York City today.


Belarus Considers Digital Economy a Top Priority, Develops Resolution For OSCE Meeting

Belarus considers the digitization of the economy a top priority and is developing a resolution promoting digital economy for a session of the Parliamentary Assembly of the Organization for Security and Co-operation in Europe (OSCE PA), local news BelTA reports May 15.


Analysis


BTC/USD

From yesterday’s open at $8683, the price of Bitcoin has decreased by 5.73% coming to $8191 where it is now sitting.


On the daily chart, we can see that the price has fallen below 0.382 Fibonacci retracement level and is now sitting at the level of the opening candle on the 12th of May where it temporarily found support.


Looking at the hourly chart, we are seeing that the price broke out of the upward channel support line, and is heading towards the 0.236 Fibo level.


Market sentiment

Bitcoin is still in the sell zone.

Oscillators are signaling a sell, and moving averages a strong one.


Pivot points

S3 7698.0 
S2 8138.7 
S1 8303.1 

P 8579.4 

R1 8743.8 
R2 9020.1 
R3 9460.8

ETH/USD

From yesterday’s open at $726, the price of Ethereum has decreased by 5.26%, coming to $688 where it is now.


Looking at the daily chart, we can see that the price has fallen to the levels on the opening candle on the 13th of May. 50 day and 100 day EMA are getting closer, and if 50 EMA goes across the 100 day from above, we will get a buy signal. However, I doubt that is going to happen, as the down move is only getting larger.


As you can see from the hourly chart, hourly EMA’s are crossing in a bearish manner, meaning 50 hour EMA is crossing 100 EMA from above. The price has broken out of the upward channel and has bounced off of the prior downward channel resistance line.


Market sentiment

Ethereum’s hourly chart technicals signal a strong sell.

Oscillators are on sell, and moving averages are on strong one.


Pivot points

S3 623.96
S2 668.50 
S1 686.78 

P 713.04 

R1 731.32 
R2 757.58 
R3 802.12

XRP/USD

From yesterday’s high at $0.741 which is on the 0.382 Fibo level, the price of Ripple has decreased by 8.92%, coming to $0.674 where it is now sitting.


On the daily chart, things haven’t changed much. The price action is still between 0.236 and 0.382 Fibonacci retracement levels, below 50 day and 100 day EMA’s.


On the hourly chart, we are seeing a breakout from the upward channel from the downside, like in the case of Bitcoin and Ethereum, which shows a strong correlation in the market. The price found temporary support at the levels of the channels starting point.


Market sentiment

Ripple is in the sell zone with hourly technicals signalling a strong sell.

Oscillators are signalling a sell while moving averages a strong one.


Pivot points:

S3 0.56768 
S2 0.63718
S1 0.66337 

P 0.70668 

R1 0.73287 
R2 0.77618 
R3 0.84568

Conclusion


Daily Crypto Market Update: While we have seen a bullish move in a form of upward channels yesterday, today we are seeing a breach from the downside. From this, I conclude that the correction to the downside is continuing and we are in for new lows.


Categories
Crypto Market Analysis

Daily Crypto Update 15.05.2018 – Indecisiveness


General Overview


Market Cap: $406,983,271,081

24h Vol: $22,745,382,371

BTC Dominance: 36.6%

Daily Cryptocurrency Update 15.05.2018

Since yesterday’s low at $386,345,000,000, the Cryptocurrency Market Capitalisation has been increasing rapidly and has reached $413B, from which it has retraced a bit to $407B, where it is now sitting.

As you would presume, the market is in green, with small exceptions on those cryptos that experienced a rise in price while everything was decreasing. Biggest gainers among top 100 are Zcash (44%), Salt (17%), Enigma (16%), and average increase is from 5-12% among the top 100.


News

Top stories that came out in the last 24 hours are extremely positive. These are some of the significant headlines:

HSBC Completes ‘World’s First’ Blockchain Trade Finance Deal, Ships Soybeans

UK-based banking giant HSBC has reportedly completed the world’s first ever trade finance transaction powered by blockchain, the Financial Times (FT) reported today, May 14.

New York City Wants To ‘Lead The Way In Blockchain’, Unveils Industry Initiatives

The President and CEO of the New York City Economic Development Corporation (NYCEDC) announced blockchain-related initiatives for the city today, May 14. The initiatives include the launch of the NYC Blockchain Resource Center and a public competition for blockchain apps to improve the public sector.

Forex Platform Serving Goldman Sachs and Morgan Stanley Adds Crypto Trading

Software developer Kx Systems has launched cryptocurrency trading on its white label forex (FX) trading platform Kx for Flow, the company reported in a blog post May 14. Starting today, Kx for Flow customers are able to conduct spot trading of Bitcoin (BTC), Ethereum (ETH), Bitcoin Cash (BCH), Litecoin (LTC), and Ripple (XRP).

CFO of Australia’s Commonwealth Bank Quits Role To Join EOS Token Developer Block.One

Rob Jesudason, the Chief Financial Officer (CFO) of Australia’s Commonwealth Bank (CBA), has left the bank to join a blockchain company, the Sydney Morning Herald reports May 14. Jesudason resigned with immediate effect in order to become the group president and chief operating officer of blockchain software firm Block.one.

CME Group Launches Ethereum Price Indexes In Partnership With Ethereum Futures Exchange

The Chicago Mercantile Exchange (CME Group) in partnership with Crypto Facilities, a UK-based digital asset exchange specializing in crypto futures, have launched the CME CF Ether-Dollar Reference Rate and Real Time Index, according to an announcement May 14. The indexes will provide users access to a real-time Ether (ETH) price in US dollars.

US: Seminole County Florida To Accept Crypto For Tax Payment

The Seminole County, Florida, tax collector Joel M. Greenberg announced May 14 that the county will begin accepting cryptocurrency for payment for various services this summer in order to eliminate heavy fees and improve payment accuracy and efficiency.

‘Global Blockchain Leader’ At Deloitte Resigns To Join Blockchain-Based Startup

Eric Piscini, former Global Blockchain Leader and Partner at one of the “Big Four” consulting firms, Deloitte, has left the company, Forbes reports May 14. Piscini, who helped build a $50 mln global blockchain practice, is joining the startup Citizens Reserve to move supply chain networks to a blockchain.

Taiwan: Taipei Bank Launches First Blockchain Payment System In The Country

Privately-held Taipei Fubon Commercial Bank has reportedly become the first bank in Taiwan to deploy a blockchain-based payment system, local media Taipei Times reports May 14. The bank announced that it deployed its blockchain-based payment system for restaurants and merchants near the National Chengchi University. Taipei Fubon Bank first revealed its plans to introduce a blockchain-based payment network in March 2017 when it signed a contract with the university to carry out “key technology and engineering R&D for [a] blockchain payment network.”

First Crypto Exchange Using Nasdaq’s Tech Announces Launch, Excluding US Customers

The first cryptocurrency exchange to use US stock market giant Nasdaq’s technology revealed it plans to launch next month in an exclusive with Finance Magnates Monday, May 14. Nasdaq, the second largest stock exchange in world by market capitalization after the New York Stock Exchange (NYSE), is providing the technology to power the new centralized crypto exchange, DX, according to the project’s CEO Daniel Skowronski. Skowronski called the upcoming exchange a “one-stop-shop” for “exchanging fiat and crypto, holding coins and as well as wallet services.”

Source: cointelegraph.com


Analysis


BTC/USD

Since yesterdays low at $8362, the price of Bitcoin has increased to $8726, which is a 4.28% increase.


Looking at the daily chart, we can see that the price is currently below the 50-day EMA with which it interacted with and bounced back, leaving a wick from the upside. Yesterday’s candle closed as a Doji with a higher wick from the downside which indicates buying pressure.


Zooming into the hourly chart, we can see that the price is currently in an upward channel that intersects the downward one. The price has broken the upper resistance line of the downward channel and retested it for support.


Market sentiment

Hourly chart technicals are on neutral.

Oscillators and moving averages are both on neutral.


Pivot points

S3 7381.8 
S2 7995.3 
S1 8333.0 

P  8608.8 

R1 8946.5 
R2 9222.3 
R3 9835.8

ETH/USD

From yesterday’s low at $695, the price of Ethereum increased by 4.71%, going to $728.


On the daily chart, we can see that the price interacted with its 0.618 Fibonacci retracement level yesterday, and has retraced since closing as a shooting star. Today’s candle is currently a doji which means indecision.


As in the case of Bitcoin, the price of Ethereum is in an upward channel on the hourly chart and is currently interacting with the support line.


Market sentiment

Hourly chart technical signal buy.

Oscillators are on neutral, and moving averages are signaling a buy in a 6:8 ratio.


Pivot points

S3 601.44 
S2 659.80 
S1 693.61 

P  718.16 

R1 751.97 
R2 776.52 
R3 834.88

XRP/USD

From yesterday’s low at $0.692, the price of Ripple has increased by 5.56% and is currently sitting at $0.73.


Looking at the daily chart, we can see that the price of Ripple interacted with its support at $0.7 and quickly bounced back, closing on a Doji yesterday. Since then the price is slightly up, as indicated by today’s green candle, but it hasn’t exceeded the 0.382 Fibonacci retracement level which serves as resistance.


Zooming into an hourly chart, we can see the interaction with the 0.382 Fibo level. The price is above 50 and 100 hourly EMA’s which look like they are about to cross in a bullish manner. The price action is currently forming an ascending triangle, which usually means that the price will drop the same hight as the triangle, which would be somewhere around $0.692 in this case.


Market sentiment

Hourly chart technicals signal a sell.

Oscillators are on sell, and moving averages on neutral in a 7:1:7 ratio.


Pivot points

S3 0.59291 
S2 0.65694 
S1 0.69195 

P  0.72097 

R1 0.75598 
R2 0.78500 
R3 0.84903

Conclusion


The corrective move is definitely over, but it may be only the first one, and we are seeing a retracement to the upside before more downfall. I am still bearish until I get a confirmation. And the confirmation would be if we see the evaluation of the cryptocurrency market cap above $470B levels, which would be a higher high than on the March 5. on which this downfall to $250B levels started. There is a lot of indecisiveness in the price action and a lot of uncertainty at the moment.


Categories
Crypto Market Analysis

Daily Crypto Update 14.05.2018 – Is The Correction Over?


General overview


Daily Crypto Update:

Market Cap: $394,117,066,327

24h Vol: $22,301,856,601

BTC Dominance: 36.6%

Yesterday’s cryptocurrency market cap started to rise up steadily from $385,301,000,000 to $410,338,000,000  which was the highest point this morning, after which the evaluation steeply declined to $386,345,000,000.


market cap

The market is currently in a mixture of green and red with a mean of 2% change.


News

There isn’t any significant news that came out during the weekend, but they are all positive in sentiment. These are some of the most significant headlines:

S. Korean Media: Electronics Giant LG Launches Own Blockchain Service ‘Monachain’

LG CNS, a subsidiary of South Korean LG Corporation that supplies information technology services, has recently launched its own blockchain-powered service, local Yonhap News Agency reports Sunday, May 13.

Source: cointelegraph.com


South Korea’s Top Financial Watchdog Joins Probe Into Cryptocurrency Exchanges

South Korea’s top financial regulator the Financial Services Commission (FSC) joined the ongoing probe into local cryptocurrency exchanges Sunday, May 13.

Source: cointelegraph.com


Chris Matta Walked Away from Goldman Sachs Position to Venture Into Cryptocurrency

The cryptocurrency industry attracts talent from all strides of life. Anyone with financial expertise may have a slight advantage to find a job in this booming sector.

Source: newsbtc.com


Another Wall Street Trader Moves to a Cryptocurrency Exchange, Talents Migrate

Wall Street is losing a lot of talented individuals in rather quick succession. Steve Hunt is the latest individual to join this growing list. He is the former CTO of Jump Trading and has been acquired by Kraken, the popular cryptocurrency exchange. It is not the first time talent is poached from Wall Street, nor will it be the last.

Source: newsbtc.com


Commonwealth Bank CFO Leaves Financial Sector in Favour of EOS

The financial sector is slowly becoming a career stepping stone rather than a final destination. A lot of people working in this industry eventually move on to completely different things. This has become especially apparent when it comes to the cryptocurrency industry. The CFO of Commonwealth Bank is now the COO and Group President of the EOS project.

Source: newsbtc.com


Analysis


BTC/USD

From yesterdays opening at $8410, the price of Bitcoin went to $8743 but is now back at the same levels as the opening, decreasing by 0.53% overall.


Looking at the daily chart, we can see that the price is below 0.382 Fibonacci retracement level, and the 50 day EMA.


Zooming into an hourly chart, we can see that the price of Bitcoin is in a downward channel and that the run-up to the $8743 level was stopped because of the channel’s resistance. The price is currently struggling, as indicated by the wicks, to find support below the Fibo level and the channel’s support line.


Market Sentiment

Hourly chart technicals signal a sell.

Oscillators are indicating neutral while moving averages a strong sell.


Pivot points

S3 7703.9
S2 8145.6
S1 8414.6

P  8587.3

R1 8856.3
R2 9029.0
R3 9470.7


ETH/USD

From the yesterday’s opening price, Ethereum has increased by 4.29%, from $674 to $702 where it is now.


On the daily chart, we can see that the price is above the 0.5 Fibo level and the 50, 100 EMA’s which is a bullish sign. What is also significant is that yesterdays candle’s close is above the opening of the candle on 11th of May.


On the hourly chart, the price is sitting on the 50 hours EMA and the wick from the downside indicate buying pressure.


Market sentiment

Ethereums is however still in a sell zone, as hourly chart technicals signal a sell.

Oscillators indicate a buy, and moving averages a strong sell.


Pivot points:

S3 568.58
S2 640.49
S1 684.63

P  712.40

R1 756.54
R2 784.31
R3 856.22


XRP/USD

In the last 24 hours, the price of Ripple has increased by 5.20% coming from $0.675 to $0.711 where it is now sitting.


The daily chart shows us that the price is sitting above the $0.7 support line, but above the 0.382 Fibonacci level and the EMA’s.


The hourly chart paints a clearer picture. The price broke out of the downward channel with a strong momentum from the downside, went back into the channel only to break out off it again, and is now back up for a retest.


Market sentiment

Ripple hourly technicals signal a sell.

Oscillators a buy, and moving averages a sell.


Pivot points:

S3 0.54100 
S2 0.62675 
S1 0.67714 

P  0.71250 

R1 0.76289 
R2 0.79825 
R3 0.88400

Conclusion

Daily Crypto Update: After the initial sell-off, we are seeing the first major stop and a move to the upside from which the prices retraced back slightly. It is uncertain if the correction is over, so we will need to monitor what happens closely at these levels, on which are the prices of the three major cryptocurrencies, but it definitely looks like the first support has been found. Can that support hold the momentum to the downside, we would just have to wait and see.

Categories
Crypto Market Analysis

Low Volatility In The Cryptocurrency Market

General overview:

Market Cap: $325,989,899,352

24h Vol: $15,576,816,007

BTC Dominance: 41.7%

Low volatility in the cryptocurrency market

In the last 24 hours market capitalization has fallen from 338,7B to 318,3B and has risen steadily since then to around 326B.

News:

There is no significant news that came out in the last day that can impact the market fundamentally. These are the most interesting once.

Mastercard Patents Blockchain Tech To Combat Fake Identity

Mastercard has registered a patent for a Blockchain system to save and verify identity data, in an application published by the U.S Patent and Trademark Office (USPTO).

Source: Marie Huillet, April 16. Cointelegraph.com

Crypto Investor Ian Balina Hacked for Millions of Ether During Livestream

Notable cryptocurrency investor and Youtube influencer Ian Balina ended a livestreamed ICO review last night when he realized he was being hacked. Balina seemed to realize something was amiss when he was required to sign back into Google to save changes to the spreadsheet he was using, saying “I have to get going” and ending the stream. Balina took to social media to ask for the support of his followers in tracing over $2 million worth of cryptocurrency being moved from his Etherscan wallets.

Source: Conor Maloney, April 16. Ccn.com

NASA Researches Ethereum Blockchain Tech for Deep Space Exploration

A research project funded and co-run by NASA is looking to leverage the Ethereum blockchain’s smart contracts technology to automate spacecraft maneuvering while avoiding space debris.

Source: Samburaj Das, April 16. Ccn.com

Analysis

BTC/USD

BTC/USD Cryptocurrency Market

Since yesterday the price of Bitcoin has decline by 5,07% coming from 8380$ to 8010$ where is now sitting.

sentiment for this cryptocurrency is slightly positive

The current sentiment for this cryptocurrency is slightly positive, meaning 69,15% from 389 mentions in total were positive.
Source: sentiment.io

Cryptocurrency Market Chart

On the hourly chart, we may observe that the price is close to the support line which served as resistance and was broken by a bull flag. Volatility is low, and there is not much going on.

Overall, hourly chart signals a buy, but it’s more like neutral.

hourly chart signals

Pivot points:

S3 4361
S2 5990
S1 6997.9
P 7619.
R1 8626.9
R2 9248
R3 10877

ETH/USD

ETHUSD-D

In the last 24 hours, Ethereum’s price has been bouncing in the range from 516$ to 502$. Looking at the daily chart, we observe that price has fallen below the 1.272 Fibonacci level (green line).

Ethereum’s price has been bouncing in the range from 516$ to 502$The current market sentiment for Ethereum is positive, meaning out of 133 mentions in total 77,44% were positive.

Source: sentiment.io

current market sentiment for Ethereum

Zooming into the hourly chart, we can see that price went slightly above the Fibo level and is now below it. Volatility is low as in the case of Bitcoin.

Pivot pointsOverall, hourly chart signals a buy, however, there are also nine neutral signals.

Pivot points:

S3 183.46
S2 327.57
S1 415.01
P 471.68
R1 559.12
R2 615.79
R3 759.90

XRP/USD

XRPUSD-D

In the last day, Ripple’s price has slightly declined from 0.68$ to around 0.66$ where is no sitting. Looking at the daily chart, we can see that the price has bounced off the 0.7$ level which may be serving as a psychological resistance level.

ripple sentiment todayThe current sentiment for Ripple is slightly positive meaning 62.71 out of 59 mentions in total are positive.
Source: sentimen.ioXRPUSD-H

Zooming into an hourly chart we can see that the rising wedge has been breached to the downside as it should have, and the price bounced off the 0.618 Fibonacci level which serves as a support.


Overall hourly chart signals a buy - Forex AcademyOverall hourly chart signals a buy.

Pivot points:

S3 0.13715
S2 0.37215
S1 0.50608
P 0.60715
R1 0.74108
R2 0.84215
R3 1.07715


Conclusion:

After the market capitalization surged in the last couple of days, we are experiencing a slight pullback. Volatility is low, and the prices of three coins that we’ve covered in this report are resting at the prior resistance levels, which is a good thing because the upward trajectory will be more sustainable in the long run.

Categories
Crypto Market Analysis

Market Capitalization Sligthly Up

General overview:

Market Cap: $327,852,350,305

24h Vol: $15,480,704,734

BTC Dominance: 42.1%

Total Market Capitalization

In the past 24 hours market capitalizations went up from slightly below 322B to around 338,703,000,000$. Currently, it is sitting around 329B.

News:

There was no significant news in the past 24 hours. However, three major headlines have stood out.


Lithuanian Central Bank Initiates Dialogue On Crypto Between Banks, Regulators, Traders

The Bank of Lithuania has reportedly begun looking into cryptocurrencies, initiating a dialogue between commercial banks, government regulators, and crypto traders, local news outlet.

Source: Molly Jane Zuckerman, April 16. cointelegraph.com

Malta Regulator Seeks Feedback On Proposed Crypto Financial Instrument Test

The Malta Financial Services Authority (MFSA) has released a consultation paper on the possible introduction of a “Financial Instrument Test” that would legally define virtual tokens, according to an April 13 announcement on their site.

The Financial Instrument Test, first proposed in a Nov. 30 paper on Initial Coin Offerings (ICO), virtual currencies, and related service providers, would determine whether a Distributed Ledger Technology (DLT) asset falls under EU and traditional financial regulations or Malta’s proposed Virtual Financial Assets Act (VFAA).

Source: Molly Jane Zuckerman April 16, cointelegraph.com

Mastercard Eyes Blockchain for Fighting Fake Identities

A newly published patent filing from Mastercard suggests that the payments giant is looking at blockchain as a way to safeguard identity data. In an application released by the U.S. Patent and Trademark Office (USPTO) last Thursday, Mastercard describes a system in which a semi-private or private blockchain would be used to receive and store identity data, the pieces of which could include a “name, a street address, tax identification number” and more.

Source: Annaliese Milano, April 16. Coindesk.com

Analysis

BTC/USD

BTC/USD chart

In the last 24 hours, Bitcoins price went from 8060$ to 8383$, and it has retraced since to 8042$ where is now sitting which is 3.62% drop. Looking at the daily chart, we can see that the price is still above the 0.618 Fibo level which is a good sign.

The current sentiment for Bitcoin is very positiveThe current sentiment for Bitcoin is very positive, meaning that 80% of the total 200 mentions are positive.
Source: sentiment.io

Bitcoins price went from 8060$ to 8383$

Zooming into the hourly chart, we can see that the price is finding support and is now resting at the levels of prior resistance.

hourly chart signals a sellOverall, hourly chart signals a sell

Pivot points:

S3 4361.0
S2 5990.0
S1 6997.9
P 7619.0
R1 8626.9
R2 9248.0
R3 10877.0

ETH/USD

Ethereum’s price went from 504$ to 533$

In the last 24 hours, Ethereum’s price went from 504$ to 533$ and has since pulled back to 507$ where is now sitting.

sentiment for Ethereum is positive meaning 75% of 136 mentions in total are positiveCurrent sentiment for Ethereum is positive meaning 75% of 136 mentions in total are positive.
Source: sentiment.io


price found resistance at the 1,272 Fibonacci level

Looking at the hourly chart, we can see that the price found resistance at the 1,272 Fibonacci level.

hourly chart signals

Overall, hourly chart signals a sell.

Pivot points:

S3 183.46
S2 327.57
S1 415.01
P 471.68
R1 559.12
R2 615.79
R3 759.90

XRP/USD

XRP/USD

Ripples price went from 0.64$ to 0.69$ and it has pulled back since to 0.65$ in the last 24 hours. Looking at the daily chart we can see that the price is heading down towards 0,618 Fibonacci level for a retest.

current sentiment is positiveThe current sentiment is positive, meaning 75% of 64 mentions in total are positive.
Source: sentiment.io

Ripples price went from 0.64$ to 0.69$
Zooming into an hourly chart we can see that the price has formed a rising wedge, from which is likely going to breakout downwards.

hourly chart signals a sell - forex academyOverall, hourly chart signals a sell.

Pivot points:

S3 0.13715
S2 0.37215
S1 0.50608
P 0.60715
R1 0.74108
R2 0.84215
R3 1.07715


Conclusion

All of the crypto pairs are pulling back after the price surge that we’ve seen in the last couple of days. This is a wave 2 out the 12345 impulse wave, and in order to see new highs, the price needs to find solid support, which is now happening in the market.

Categories
Forex Market Analysis

Mixed Performance in the Major Pairs

Hot Topics:

  • NZD – Kiwi falls 0.46% waiting for PPI data release.
  • AUD – Making a triangulation expecting RBA Minutes.
  • JPY – Nikkei rises and pull the USDJPY.

Main currencies daily performance.

NZD – Kiwi falls 0.46% waiting for PPI data release.

In the Oceanic Session, the Statistic New Zealand (Stats NZ) will release the Producer Price Index (QoQ). The analyst consensus expects a fall in the PPI input from 1% to 0.3%, and in PPI output from 1% to 0.4%. This PPI forecast is aligned with the last CPI (QoQ) that reached 1.6% in Q4, below the 1.9% registered in Q3.

In the pair NZDUSD, we are observing the minimum recorded in the last session, which coincides with the weekly pivot point (0.73538). If the Kiwi falls below the weekly pivot, we will look for short positions up to the first weekly support level (S1 = 0.72707), which is a potential profit of approximately 80 pips.

AUD – Making a triangulation while expecting RBA Minutes.

Today the minutes of the last meeting of the Board of the Reserve Bank were announced, they decided to keep the interest rate unchanged at 1.50%. The Aussie in the hourly chart is developing a triangulation structure; in case of falling below 0.78912, it could get to drop to 0.77943. On the contrary, if it breaks higher, the objective would be 0.80097.


JPY – Nikkei rises and pull the USDJPY.

In the first session of the week, the Nikkei 225 index rose by 0.48%, and by inverse correlation pulled the USDJPY pair. The decorrelation between both instruments was commented on in our Daily Abstract on February 16th, where we mentioned that “this divergence in the correlation between the Nikkei Index and the USDJPY should be eliminated again” to converge in favour of the major trend of the indexes.

In the short-term, we will maintain long positions if the USDJPY climbs above 106.906 with the objective at 108.26 and a maximum extension at 110.

© Forex.Academy