General Overview
Crypto Coin Market News:
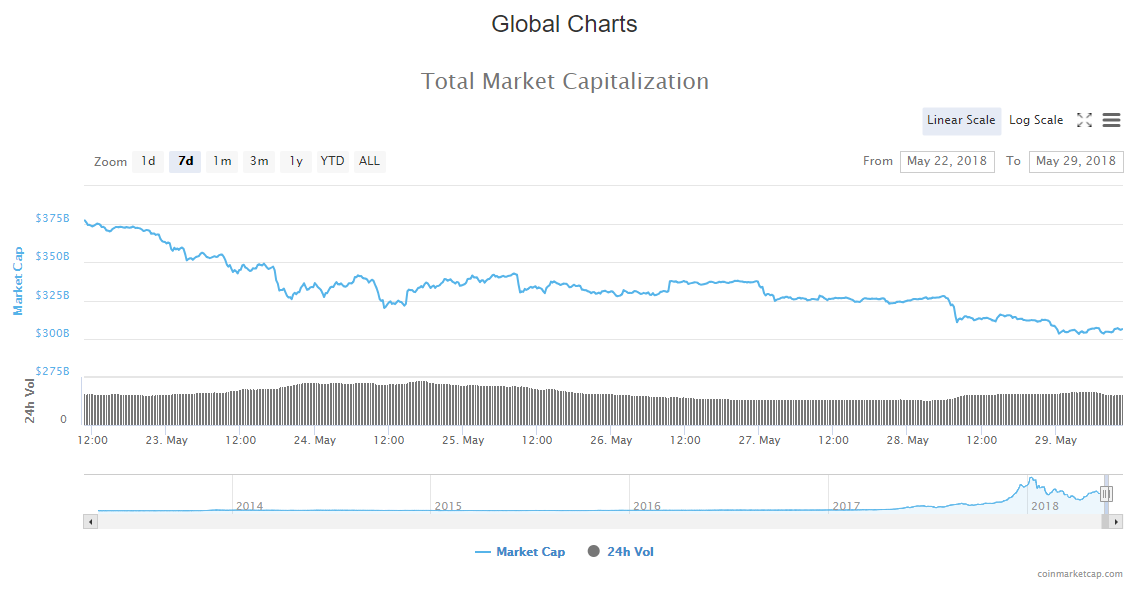
Market Cap: $306,776,676,366
24h Vol: $15,425,897,276
BTC Dominance: 39.8%
In the last 24 hours, cryptocurrency market capitalization has been declining steadily from $328,1B which was yesterdays high to $306B where it is currently sitting.
The market is mostly in red as you would presume, with an average decline of 3-4% among top 100 coins. There are some in green as well. For example, Cardano (ADA) is up by 6.4%, Icon by 2.16%, Golem by 5% and CyberMiles is the biggest gainer amongst the top 100, experiencing an increase of 21%.
Crypto Coin Market News
Top stories that came out in the last 24 hours are mostly about fundamentals and are analytical in nature. As far as sentiment is concerned, it looks like the tone is bullish reassuring.
Despite Hitting Monthly Price Lows, Bitcoin Network Fundamentals Keep Growing
While the crypto markets overall are seeing a downward trend, some of the fundamental Bitcoin indicators such as the hashrate and the number of the Segregated Witness (SegWit) transactions are growing steadily, indicating the continued development of the network.
Ethereum’s Price Drop Possibly Due To Large ETH Sell-Off By EOS, Report Says
Etherscan shows that wallet address marked as EOSCrowdsale still has around 200,000 ETH, and wallet address marked EOS-Owner around 916,000, together equaling over 1.1 mln ETH.
1090 DApps And 700 Tokens Launched on Ethereum Network in 2017, Analyst Says
In 2017, 1,090 decentralized applications (DApps) and more than 700 tokens have been deployed on the Ethereum (ETH) network, Finance Magnates reports May 28.
Bank of England: Central Bank Digital Currencies Can Jeopardize Commercial Banks
The Bank of England has issued a May 2018 staff working paper, which suggests that the adoption of central bank digital currencies (CBDCs) could pose a competition threat to commercial banks.
Source: cointelegraph.com
Analysis
BTC/USD
From yesterday’s open, the price of Bitcoin dropped by 3.23% going from $7343 to $7117 where it is currently sitting.
Looking at the daily chart we can see that the price is between the baseline support (black line) and the triangle support (blue line). After those, there is a third support level which is an unconfirmed baseline support 2 (dotted line). The price is likely heading down toward one of them, as the search for support continues.
Zooming into the hourly chart we can see that we are about $135 away from the triangle support line at around $7000 and that the price is going to meet that level. When the price does reach that level, I would be looking for either a sign of a trend reversal or trend continuation which is a more likely scenario from a probability standpoint. If the trend continues I am expecting the price of Bitcoin to fall to the dotted line which is an unconfirmed baseline support 2 at around $6600.
Market sentiment
- Bitcoin hourly chart technicals signal a sell.
- 9 oscillators are on neutral, and 11 moving averages signal a sell.
Pivot points
S3 6448.5
S2 6823.9
S1 6960.9

P 7199.3

R1 7336.3
R2 7574.7
R3 7950.1
ETH/USD
From yesterday’s open, the price of Ethereum has dropped by 7.68% from $568.9 to $522 where it is currently.
On the daily chart, we can see that the price bounced off of the 0.236 Fibonacci level, but judging by the hight of the candle the momentum behind the bounce was not strong enough to even come back to the prior support line which now serves as resistance at $539.5.
Zooming into the hourly chart, we can see that the price action is currently in a triangle from which it’s likely heading lower, and we are going to see a breakout from the downside.
Market sentiment
- Ethereum is in the sell zone.
- Oscillators are on buy, but with 9 on neutral, and moving averages signal a sell.
Pivot points
S3 363.16
S2 444.66
S1 478.32

P 526.16

R1 559.82
R2 607.66
R3 689.16
XRP/USD
In the last 24 hours, the price of Ripple has decreased by 4.83% – from yesterday’s open at $0.604 to $0.58.
Looking at the daily chart we can see that the price is interacting with the prior support which now serves as resistance at $0.573.
If we zoom into the hourly chart we can see that the price is above it, but we need to wait for the candle to close to be sure, as selling pressure can slap the price back below it, leaving a wick.
Market sentiment
- Ripple hourly chart technical signal a buy.
- Oscillators are on buy, and moving averages signal a buy.
Pivot points
S3 0.44321
S2 0.50486
S1 0.52601

P 0.56651

R1 0.58766
R2 0.62816
R3 0.68981
Conclusion
Crypto Coin Market News: Prices are getting pushed to new lows which may trigger some buying. That’s why I am expecting some short-term sideways movement, before another final drop. Bitcoin is near the support levels, Ethereum is in a triangle and Ripple is struggling to move back above the support line which means that price action is showing signs of a struggle. These are significant levels on which the prices of three major cryptos are at the moment and what happens today will affect what happens in the following days. If these lows trigger buying, we can see the prices bounce back to the prior high level, if not we are in for lower lows.
Related posts
 Daily crypto update 10.07.2018 – Panic selling
 Daily Crypto Review, Sept 11 – DeFi Sector Experiences Volatility; The Rest Of The Market Stable
 Daily Crypto Review, Sept 23 – Gold Pushing BTC Towards $9,500; XRP Bears Taking Over
 Daily Crypto Review, Sept 28 – XRP Exiting Bearish Structure and Aiming for $0.245; Bitcoin Eyeing $11,000