General Overview
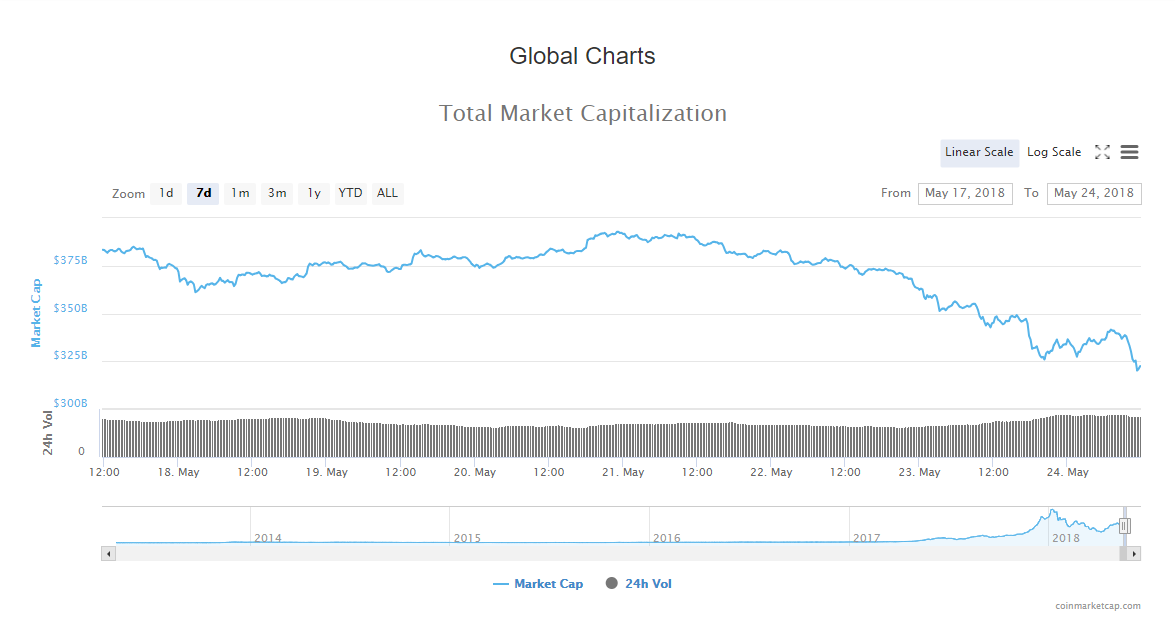
Crypto News Daily Updates:
   Market Cap: $323,628,725,976
       4h Vol: $20,747,314,659
BTC Dominance: 39.1%
In the last 24 hours, the cryptocurrency market cap evaluation has fallen from 363,2 billion dollars to 320,1 billion dollars, which is a 43,1 billion dollar decrease.
The market is in red with the biggest losers being around -10%. Only Steem +3,2% and 0x +9,1% are in green
Crypto Daily News
The top stories that came out in the last 24 hours are the following:
Coinbase Announces Launch of Coinbase Pro, Paradex Acquisition
Coinbase has announced Coinbase Pro, the new version of its trading platform GDAX, in a blog post Wednesday. The announcement comes on the same day as Coinbase’s acquisition of relay platform Paradex.
Bloomberg: US DOJ Opens Criminal Investigation Into BTC, ETH Price Manipulation
A criminal probe into Bitcoin (BTC) price manipulation by crypto traders has been opened by the U.S. Department of Justice (DoJ), Bloomberg reports today, May 24. Bloomberg cites four unnamed sources close to the matter as reporting that the criminal investigation – run by U.S. federal prosecutors and the Commodity Futures Trading Commission (CFTC) – will look into how traders could have engineered prices by illegal activities like spoofing and wash trading.
UN’s Project Services Arm Partners With IOTA to ‘Expedite’ its Mission With Blockchain
The United Nations signed a “memorandum of understanding” with blockchain platform IOTA to explore how the technology can increase efficiency, the two parties confirmed May 22. In a press release about the partnership, which features the United Nations Office for Project Services (UNOPS), the organization said the focus was on cutting intermediaries using blockchain.
Source: cointelegraph.com
Analysis
BTC/USD
From yesterday’s, open the price of Bitcoin has decreased by 7.67% from $7954 to $7355 where it is currently.
Looking at the daily chart the most important thing we see is that the price is currently interacting with the baseline support 1 which was the main support line from 14.07.2017, and held pretty strong in the past. Below that baseline is another unconfirmed which may serve as support if this one is broken.
Zooming into an hourly chart we can see the interaction with the support baseline, and that the price is currently below it. That doesn’t mean that the price is going further below, as this has happened twice before, the price interacted with that baseline support. We will see how today’s candle closes, but I am expecting a wick on the daily chart.
Market sentiment
- Bitcoin is in the sell zone.
- Oscillators are 9 on neutral, and moving averages signal a sell.
Pivot points
S3 6404.6
S2 7021.9
S1 7258.3
 P 7639.2
R1 7875.6
R2 8256.5
R3 8873.8
ETH/USD
In the last 24 hours, the price of Ethereum has dropped by 9.6% – from $649 to $586.5 where it is now.
Looking at the daily chart, we can see that the price is below 0.382 Fibonacci level and is looking for support at the levels of prior range resistance. As you can see from the wick, there was a good amount of buying pressure which propelled the price in an upward trajectory. The price went above 0.382 Fibo level again for a while but has retraced since leaving a wick, which indicates the equal amount of selling pressure from above.
On the hourly chart, you can see that the price touched the prior resistance at $539.5 and bounced quickly, but it looks like now its entering seller’s territory.
Market sentiment
- Ethereum hourly chart technical signal a sell.
- Oscillators are 9 on neutral, and moving averages signal a sell.
Pivot points
S3 425.88
S2 511.34
S1 544.12
 P 596.80
R1 629.58
R2 682.26
R3 767.72
XRP/USD
In the last 24 hours, the price of Ripple has dropped from $0.637 to $0.573 where it found temporary support and is now sitting at $0.615 which an overall decrease of 3.36%.
Looking at the daily chart, we can see that the price fell below 0.236 Fibonacci retracement level with strong momentum.
Zooming into an hourly chart we can see where the price found support, and it was on the levels of prior range resistance at $0.573. As you can see currently the price is up again, but on the same levels from which it has fallen before, which means that sellers are near, so we can expect another drop from these levels.
Market sentiment
- Ripple is in the neutral zone.
- Oscillators and moving averages are signaling a neutral.
Pivot points
S3 0.46433
S2 0.53360
S1 0.56156
 P 0.60287
R1 0.63083
R2 0.67214
R3 0.74141
Conclusion
As prices of three major cryptocurrencies only made a quick dip toward their first support from which they bounced back to the prior high, I am expecting to see some short-term upside movement in the form of an upward channel after which the prices are likely to be heading down again for another low for a proper retest.
