General Overview
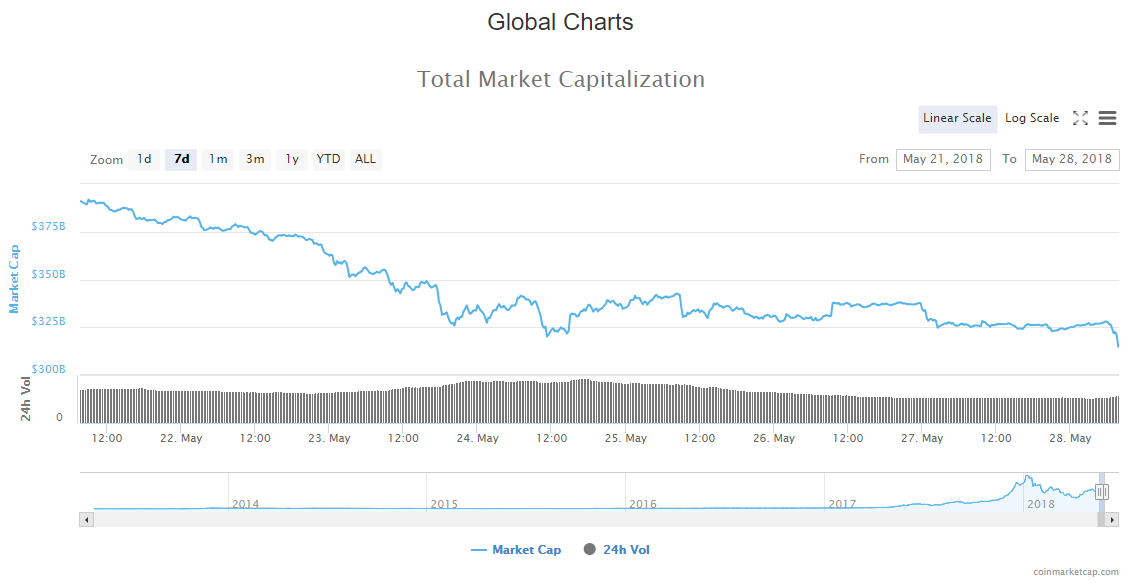
Market Cap: $312,693,245,353
24h Vol: $15,021,077,612
BTC Dominance: 39.3%
Over the weekend, cryptocurrency market capitalisation has been bouncing in a range from $325B to $336B, and weeks low has at around 321 billion dollars. This morning the market cap has dropped below what seems as support level at $325B, in a straightforward manner.
 The market is currently in red, with approximately 4-8% decrease among top 100 cryptocurrencies. Biggest losers are Augur -10%, Fusion 14.23% and Centrality 10.86%. There are some in green like All Sports +25% and MyBit Token +24%, but they are newly introduced coins to the market.
Crypto Market News
There aren’t any significant stories that came out over the weekend and in the last 24 hours. As the market plummets, many are analytical in nature and have a bearish tone. These are some of most notable headlines:
Bitcoin and Crypto on Continuous Decline: Major Factors and Trends
Analyst Says Bitcoin May Drop to $5,500 Before New Upside In Q3/Q4 2018
Spanish Central Bank Governor Perceives Cryptocurrency Risks, Distributed Ledger Technology Potential
Buy Bitcoin, Sell Your Altcoins, Says Pioneering Wall Street Blockchain Analyst
Analysis
BTC/USD
In the last 24 hours, the price of Bitcoin has dropped by 1.56% coming from 7326$ to 7212$ where it is currently sitting.
The most significant thing that we see on the daily chart is that the price has fallen below the baseline support, and is now heading to the second one which intersects the ending point 0 of the Fibonacci retracement.
Zooming into an hourly chart we can see the interaction with the baseline support. The price oscillated above and below it, struggling to find stable support, and the wedge prior support served as stronger resistance which repealed the price and pushed it lower.
Market sentiment
- Bitcoin hourly chart technicals signal a sell.
- Oscillators are on neutral, and moving averages on a strong sell.
Pivot points
S3 6896.8
S2 7111.1
S1 7225.4
P 7325.4
R1 7439.7
R2 7539.7
R3 7754.0
ETH/USD
From yesterdays open until now, the price of Ethreum has decreased by 8.94%, and that’s not the lowest its been. The price went from 585$ to 503$ but quickly bounced from there to 532$ where it is currently sitting.
Looking at the daily chart we can see that the price went to touch the 0.236 Fibonacci level and left a wick below it which is the mentioned drop to 503$.
Looking at the hourly chart, we can see the interaction with the support at 539.5$. The price is currently on an upward trajectory heading back to that support for a retest.
Market sentiment
- Ethereum is in the sell zone, as hourly chart technicals signal a sell.
- Oscillators are on neutral, and moving averages on a strong sell.
Pivot points
S3 492.75
S2 532.10
S1 550.55
P 571.45
R1 589.90
R2 610.80
R3 650.15
XRP/USD
In the last 24 hours, the price of Ripple has dropped by 5.64% coming from 0.608$ to 0.57495$ where it is now sitting.
On the daily chart, we can see that the price is below the 0.236 Fibonacci level and is currently sitting on the support which was the prior range resistance.
Zooming into the hourly chart we can see the interaction with the support level, and judging by the momentum behind the down move, the price is likely to be heading down further.
Market sentiment
Ripple is a sell, as hourly chart technicals signal.
Oscillators are on buy, and moving averages on a strong sell.
Pivot points
S3 0.57247
S2 0.58842
S1 0.59624
P 0.60437
R1 0.61219
R2 0.62032
R3 0.63627
Conclusion
Crypto Market News: As seen on the charts, major support lines have been crossed below and the prices are now heading even further down as the strong momentum behind the down move has to find strong buying pressure in order to see a trend reversal.
