General overview
Daily Crypto Update:

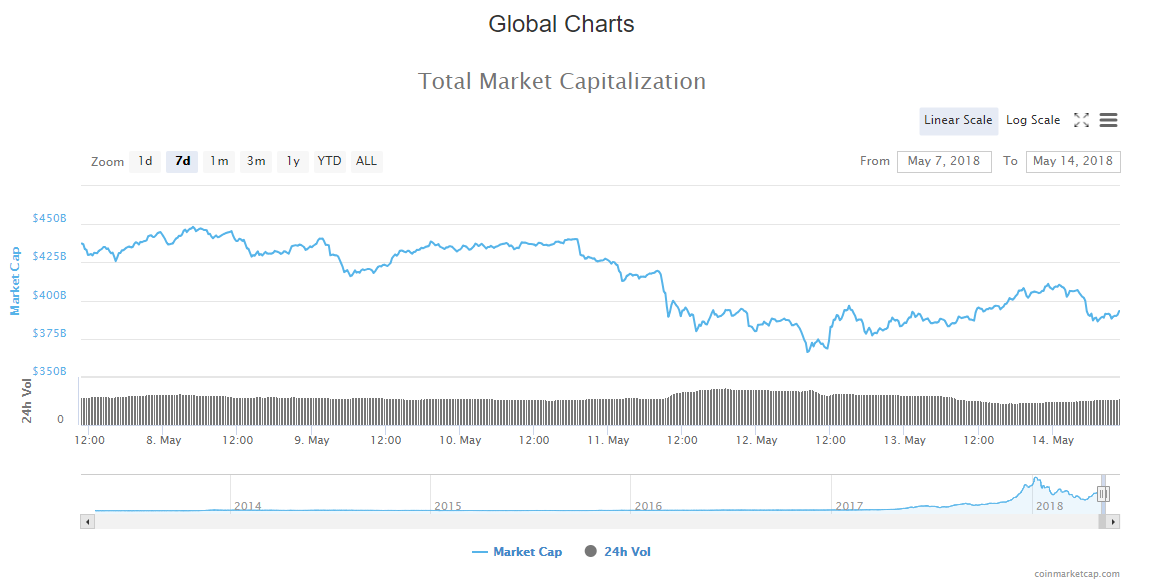
Market Cap: $394,117,066,327
24h Vol: $22,301,856,601
BTC Dominance: 36.6%
Yesterday’s cryptocurrency market cap started to rise up steadily from $385,301,000,000 to $410,338,000,000 which was the highest point this morning, after which the evaluation steeply declined to $386,345,000,000.
The market is currently in a mixture of green and red with a mean of 2% change.
News
There isn’t any significant news that came out during the weekend, but they are all positive in sentiment. These are some of the most significant headlines:
S. Korean Media: Electronics Giant LG Launches Own Blockchain Service ‘Monachain’
LG CNS, a subsidiary of South Korean LG Corporation that supplies information technology services, has recently launched its own blockchain-powered service, local Yonhap News Agency reports Sunday, May 13.
Source: cointelegraph.com
South Korea’s Top Financial Watchdog Joins Probe Into Cryptocurrency Exchanges
South Korea’s top financial regulator the Financial Services Commission (FSC) joined the ongoing probe into local cryptocurrency exchanges Sunday, May 13.
Source: cointelegraph.com
Chris Matta Walked Away from Goldman Sachs Position to Venture Into Cryptocurrency
The cryptocurrency industry attracts talent from all strides of life. Anyone with financial expertise may have a slight advantage to find a job in this booming sector.
Source: newsbtc.com
Another Wall Street Trader Moves to a Cryptocurrency Exchange, Talents Migrate
Wall Street is losing a lot of talented individuals in rather quick succession. Steve Hunt is the latest individual to join this growing list. He is the former CTO of Jump Trading and has been acquired by Kraken, the popular cryptocurrency exchange. It is not the first time talent is poached from Wall Street, nor will it be the last.
Source: newsbtc.com
Commonwealth Bank CFO Leaves Financial Sector in Favour of EOS
The financial sector is slowly becoming a career stepping stone rather than a final destination. A lot of people working in this industry eventually move on to completely different things. This has become especially apparent when it comes to the cryptocurrency industry. The CFO of Commonwealth Bank is now the COO and Group President of the EOS project.
Source: newsbtc.com
Analysis
BTC/USD
From yesterdays opening at $8410, the price of Bitcoin went to $8743 but is now back at the same levels as the opening, decreasing by 0.53% overall.
Looking at the daily chart, we can see that the price is below 0.382 Fibonacci retracement level, and the 50 day EMA.
Zooming into an hourly chart, we can see that the price of Bitcoin is in a downward channel and that the run-up to the $8743 level was stopped because of the channel’s resistance. The price is currently struggling, as indicated by the wicks, to find support below the Fibo level and the channel’s support line.
Market Sentiment
Hourly chart technicals signal a sell.
Oscillators are indicating neutral while moving averages a strong sell.
Pivot points
S3 7703.9
S2 8145.6
S1 8414.6

P  8587.3

R1 8856.3
R2 9029.0
R3 9470.7
ETH/USD
From the yesterday’s opening price, Ethereum has increased by 4.29%, from $674 to $702 where it is now.
On the daily chart, we can see that the price is above the 0.5 Fibo level and the 50, 100 EMA’s which is a bullish sign. What is also significant is that yesterdays candle’s close is above the opening of the candle on 11th of May.
On the hourly chart, the price is sitting on the 50 hours EMA and the wick from the downside indicate buying pressure.
Market sentiment
Ethereums is however still in a sell zone, as hourly chart technicals signal a sell.
Oscillators indicate a buy, and moving averages a strong sell.
Pivot points:
S3 568.58
S2 640.49
S1 684.63

P  712.40

R1 756.54
R2 784.31
R3 856.22
XRP/USD
In the last 24 hours, the price of Ripple has increased by 5.20% coming from $0.675 to $0.711 where it is now sitting.
The daily chart shows us that the price is sitting above the $0.7 support line, but above the 0.382 Fibonacci level and the EMA’s.
The hourly chart paints a clearer picture. The price broke out of the downward channel with a strong momentum from the downside, went back into the channel only to break out off it again, and is now back up for a retest.
Market sentiment
Ripple hourly technicals signal a sell.
Oscillators a buy, and moving averages a sell.
Pivot points:
S3 0.54100
S2 0.62675
S1 0.67714

P  0.71250

R1 0.76289
R2 0.79825
R3 0.88400
Conclusion
Daily Crypto Update: After the initial sell-off, we are seeing the first major stop and a move to the upside from which the prices retraced back slightly. It is uncertain if the correction is over, so we will need to monitor what happens closely at these levels, on which are the prices of the three major cryptocurrencies, but it definitely looks like the first support has been found. Can that support hold the momentum to the downside, we would just have to wait and see.
