Pivot Points
Pivot Points (PP) are maybe the most straightforward and accessible trading approach or technique. The objective of this article is to show how to find trade opportunities using Pivot Points. We won’t make any explanation regarding the different Pivot Points trading strategy, i.e., Camarilla, Woodie, Fibonacci, or DeMark.
A Pivot Points framework is a mathematical method based on the previous N-period calculation, where N could be hourly, daily, weekly, monthly, or even, yearly. The most common timeframes to compute pivots are daily and weekly. In the short-term -Intraday trading- traders use mostly daily pivots; in the mid-long-term – Swing trading- they tend to use weekly or monthly pivots.
The Pivot Point calculation formula uses the High (H), Low (L) and Close (C) prices of the period:
Different supports and resistance levels are determined as follows:
THE STRATEGIES
First Strategy, Objective Levels:
- Consider taking “long” positions if the price is over the PP, and “short” positions in the opposite case.
- First target: R1, second target: R2. If price gains momentum, consider R3 as a final target. Another possibility is to trade from R1 to R2 (see figure 1 and 2).
- An order stop should be placed below the low of the Pivot Point.
In figure 1, we observe the trade in AUDUSD. In this case, the long position went from R1 to R2, and it was based upon the bullish bias that started on the 2nd of June’s session and still holding on the 6th of June. Figure 2 shows the result of the trade, closed at R2

Figure 1: Trade from R1 to R2.
Source: Personal Collection.

Figure 2: Result of the trade from R1 to R2
Source: Personal Collection.
Second Strategy, Potential Reversal Level:
This strategy is riskier because sometimes it could signal counter-trend trades. In this case, the idea is:
- Consider going “short” when the price reaches R2 or R3. Go long when the price goes down to S2 or S3 levels.
- If a trade is taken from R3, the first objective is R2, and the next target is R1. The “V” Pattern is not frequent, but it’s feasible to find it on volatile sessions (see figure 3).
- When trading a swing long at S3, SL (stop loss) should be placed slightly below the low of the day; or conversely, a swing short requires an SL above the daily high.
In figure 3, the GOLD (XAUUSD) opens the Asian and European session with a bullish bias, but when the price rises to R3, the volatility drives prices back to the PP of the day (blue line). Under this scenario, there is a definite possibility to enter a short position at the next candle open, once the price has confirmed the change in intraday trend.

Figure 3: R3 as Potential Reversal Level.
Source: Personal Collection.
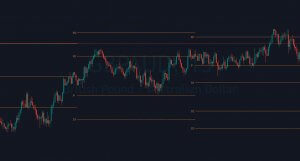
Third Strategy: The Power of Confluence.
In trading, a confluence is the convergence of two or more levels. A confluence of two or more pivot levels improves the possibility of them being a consistent support/resistance level compared to a single pivot level. In figure 4, we observe some confluences in GBPNZD; the reader should keep in mind that a confluence defines a zone, not an individual level, and price action must validate every zone or pivot level. Confluences also could be used with different timeframes, for example, weekly pivots with monthly pivots as shown in figure 5.

Figure 4: Confluences.
Source: Personal Collection.

Figure 5: Confluences.
Source: Personal Collection.
A personal study based on the price movements between Daily Pivot Points levels applied to the Aussie, where the objective is to use the support/resistance levels as objectives or reversal zones, has revealed the results shown in figure 6. As we can see, the price movements draw a kind of Gaussian Bell shape, where most of the price movements are concentred between S1 and R1. Another observation is to consider R3 as a Potential Reversal Level.

Figure 6: Range of Movements between Pivot Points.
Source: Personal Collection.
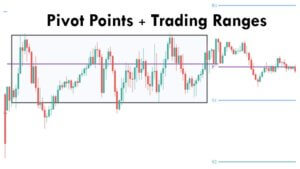
Finally, I’ll tell you about my personal experience using daily pivot points. Some days, when a session moves within a narrow range, the price is moving between the daily pivot, and therefore between S1 and R1 (see figure 7). Then, it’s highly likely that the next session shows an explosive movement or a highly volatile session, maybe due to a relevant news or economic data release. In this case, the potential move expected could be from PP to R2 (or S2).

Figure 7: Narrow Range Session and Volatile Session Movements.
Source: Personal Collection.
SUGGESTED READINGS
- Duddella, S. (2007). Trade Chart Patterns Like The Pros.
- Person, J. L. (2007). Candlestick and Pivot Point Trading Triggers: Setups for Stocks, Forex and Futures Markets. New Jersey: John Wiley & Sons, Inc.
©Forex.Academy