General overview
Crypto Daily Update:
Market Cap: $377,526,863,027
24h Vol: $15,782,191,998
BTC Dominance: 37.6%
From yesterday’s high at 391,920,000,000$ crypto market cap has decreased to $377,1B steadily.
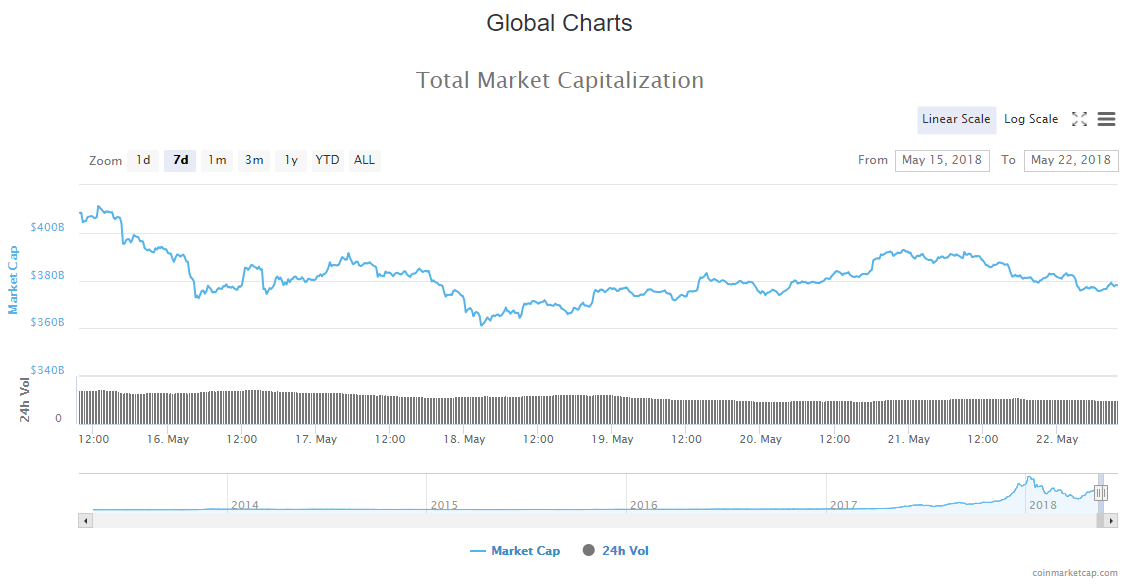
The market is in red, with approximately 3%-5% average decrease in value from top 100 cryptocurrencies.
News
Top stories that came out in the last 24 hours are mostly positive, however, there are no significant news that can impact the market. These are the most significant headlines:
Polish Finance Ministry Rolls Back Crypto Tax, Promises Smarter Regulation
Poland’s Ministry of Finance will temporarily suspend tax collection for cryptocurrencies, the Polish Press Agency (PAP) reported May 18. The Ministry says it will conduct an “in-depth analysis” of the crypto space to inform better regulation and taxation policies going forward.
Japan’s Largest Bank and Cloud Delivery Giant Akamai Announce Blockchain Payment Network
The Mitsubishi UFJ Financial Group (MUFG) has partnered with major U.S.-based cloud delivery platform Akamai Technologies to release a global payment network based on blockchain, Cointelegraph Japan reports today, May 21.
Walmart Files Patent for Blockchain-Based Customer Marketplace
Walmart has filed a patent for a blockchain-based marketplace for reselling purchased products, according to a US Patent and Trademark Office USPTO patent filing from May 17.
Thai SEC Holds Focus Group to Clarify New Crypto, ICO Regulations
Thailand’s Securities and Exchange Commission (SEC) held a focus group on cryptocurrency regulation today, May 21, streamed on Facebook Live. The hearing focused on the SEC’s approach to crypto-related businesses and fundraising through Initial Coin Offerings (ICO), local news outlet Siam Blockchain reports.
Germany’s BaFin Visits National Bank of Georgia to Discuss Crypto Regulations
One of the largest financial supervisors in Europe met with the National Bank of Georgia (NBG) and other members of the finance sector to discuss cryptocurrency regulation, according to a post on the NBG’s site May 18.
Bank of England Issues Working Paper on Central Bank Digital Currencies
On May 18, the Bank of England released a staff working paper, laying out various scenarios of possible risks and financial stability issues of central bank digital currencies (CBDCs).
Analysis
BTC/USD
From yesterday’s open at 8525$ the price of Bitcoin has decreased by 3,18% dropping to 8253$ where it is currently sitting.
Looking at the daily chart we can see that the price fell below 0,382 Fibonacci retracement level and is currently at the levels of the opening of the day before yesterday’s candle, which was a green candle, which broke out from the wedge pattern.
Zooming into an hourly chart we can see clearly what happened at the Fibonacci level. As you can see the momentum behind the move was strong, and the price is likely heading back to the wedge resistance for a retest.
Market sentiment
- Bitcoin hourly chart technical signal a strong sell.
- Oscillators are signaling a sell, and moving averages a strong one.
Pivot points
S3 7781.1
S2 8116.0
S1 8257.8

P 8450.9

R1 8592.7
R2 8785.8
R3 9120.7
ETH/USD
In the last 24 hours, the price of Ethereum has decreased by 4,2% coming from 715$ to 685$ where it is currently sitting.
Looking at the Ethereum daily chart we can see that the price was repealed by the resistance at 712$ and that from there the price only fell further.
Zooming into the hourly chart we can see that the price fell even further, but quickly bounced back to the support levels on which it’s currently sitting. The price found some temporary support, but judging by the momentum behind the move, that support won’t hold again.
Market sentiment
- Ethereum hourly chart technicals signal a sell.
- Oscillators are on buy, but moving averages signal a strong sell.
Pivot points
S3 632.57
S2 666.63
S1 681.38

P 700.69

R1 715.44
R2 734.75
R3 768.8
XRP/USD
From yesterday’s open at 0.6991$ the price of Ripple has decreased by 4,56% dropping to 0,6673$.
On the daily chart, things haven’t changed much, the price is still in the range between 0,382 and 0,236 Fibonacci retracement levels, and after a move up it has retraced to the start of that move, looking for support.
On the hourly chart, we can see that the price was repealed by the resistance of the triangle from which it tried to burst but failed which propelled the price in a downward trajectory.
Market sentiment
- Ripple is still in the sell zone.
- Oscillators are on buy, and moving averages signal a strong sell.
Pivot points
S3 0.61103
S2 0.64647
S1 0.66073

P 0.68191

R1 0.69617
R2 0.71735
R3 0.75279
Conclusion
Crypto Daily Update: As I have projected in my weekly forecast, the correction is still in play and we are in for new lows. The prices failed to break resistance at prior highs, and as they entered sellers territory the selling has begun.
