Categories
Crypto Guides

Understanding Market Speculations In The Cryptocurrency Market

Introduction

Market speculation is a term that can put you in a bad light if discussed with a casual investor. People often relate speculation to the irresponsible behavior of the banks and financial institutions. To a layman, this term is nothing but a synonym for gambling. The only difference being, in gambling, personal money is used, not investor money.

The concept of speculation is misunderstood by many. Agreed that investing is all about balancing the risk to reward ratio, but speculation is no different. It is an anticipation that the risk on the investment is going to be well worth the risk. In this article, we shall be clearly understanding the concept of market speculation and determine if it is evil to the cryptocurrency market.

What is Speculation?

Trading and investing involve the managing of risk and return. Speculation is that space that fits in the area opposite of guaranteed investors, like bonds and other safe havens. Be it any type of investment; there involves risk. The risk cannot be completely eliminated but surely be reduced. Typically, an investment with low-risk yields low returns. Similarly, investments with relatively high risk, the payout is equally high. And speculation work with the latter principle.

Myth – Speculation is Gambling

There are still a lot with the conception that speculation is no different from gambling. Gambling could involve some skill elements but certainly cannot cut off the risk on it. It is basically like a game of dice. Considering the die to be unbiased, the probability of a predicted number coming up always remains 1/6. Speculation, on the other hand, involves high research in the background, where the speculator studies and analyses all the risks involved in it, and then take actions accordingly. Also, when they bet on something involving high risk, they try making sure that the odds are in their favor.

Cryptocurrency Speculation

Cryptocurrency speculation is mostly inclined towards Bitcoin as it was the first cryptocurrency in the market. Back then, only a handful of people predicted the exponential rise of Bitcoin from a few cents to thousands of dollars. However, there was a good number of investors who made a fortune off this move. In the ocean of investors, there are the ones who anticipate a high return from a small investment, in short, the speculators.

Cryptocurrencies are those that seem like they are specifically made for speculative purposes. And these cryptocurrencies are unlike the tulip bulbs of old that would turn out to be a scam. Bitcoin, for example, is a cryptocurrency known for its security and trust as it backed up blockchain technology. Since the cryptocurrency market is fresh and new relative to others, speculators can consider it a great opportunity to bet on their chosen coins.

Conclusion

Market speculators from the very beginning have earned a bad name. This misconception is still in the air. As a trader/investor, you have to be conservative, but it does not mean you cannot be a risk-taker. Taking risks during the right times and on the right securities can turn out to be a moneymaker. And this is what successful are onto.

Categories
Crypto Guides

‘Whales’ & Their Impact On The Cryptocurrency Market!

Introduction

Whales are a metaphor for individuals with high-worth in the capital and have the capability to persuade the market in their preferred direction. In this article, we shall understand how the whale’s actions impact the cryptocurrency market.

Whales’ typical move is to create a wave in the market. They cause the market to artificially appreciate or depreciate so that they can get the best price to make their purchase and ride in profit. Now let’s see how they create this illusion in the market.

How do the Whales work?

We know that the job of Whales is to create a wave in the market. And the amount needed to create it depends on the market cap of the instrument. So, a bigger ocean would require bigger whales to produce a considerate wave.

To produce a wave, the whales place a large number of sell orders at a low price such that there are not as many buy orders as their sell orders. With these sell orders, the exchange has no other option but to execute the order. In doing so, a wave will be brought into the market, which will drive the prices lower and lower in a very short period of time. Once prices drop, the whales begin to buy at these lower prices.

If the number of orders of the whales is not as large as the number of buyers, and they still place sell orders at low prices, there would be enough buyers to fill those sell orders. Hence, only a young market with a small market cap is prone to these whale waves.

For instance, BearWhale was able to bring and hold the prices of Bitcoin to as low as $300 only for a few hours. Because there were a large number of buyers to consume the entire sell orders of the whales. However, it did bring a sudden drop to the Bitcoin prices, but the impact is relatively lesser than smaller markets.

Price Suppression

As mentioned in the previous example, the Whales use their powers to create waves to make strategic lows so that they can buy the cryptocurrency at great discounts. They use this strategy repeatedly, placing orders at low prices, wait for the price to drop, remove their sell order, and buy for the reduced price. For example, the NEO coin with a very small market cap fell from $37 to $4 in just one day. And the responsible ones were none other than the waves.

On the contrary, there price pumping, where the whales, instead of placing sell orders, place enormous buy orders to inflate the market higher. When the prices appreciate all of a sudden, they get off with their buy orders and prepare to take short positions.

Conclusion

A sudden appreciation or depreciation in the prices can not only cause by Whales but other factors as well. This becomes difficult for traders to predict if the sudden rise and fall are real or not. Unfortunately, such activities cannot be put to a stop until the market-cap of cryptocurrency grows to the extent that such manipulations cannot be played.

Categories
Crypto Market Analysis

Daily Crypto Review, Dec 26 – Youtube censoring crypto-related videos; content creators have spoken

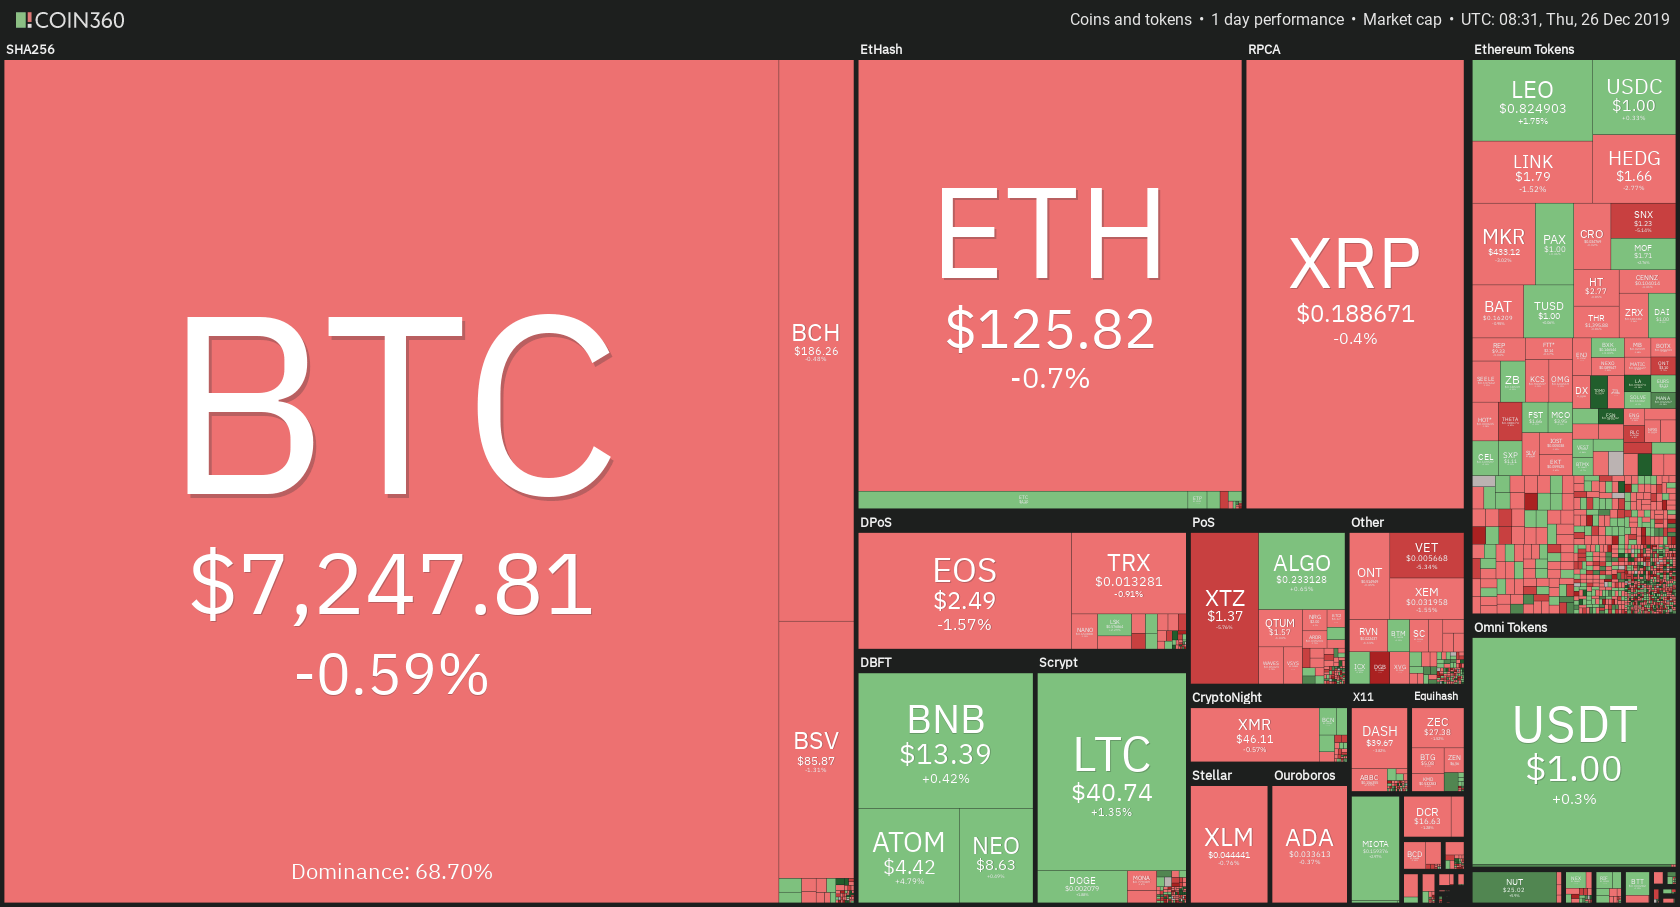
Bitcoin, along with the rest of the cryptocurrencies, didn’t move much during Christmas. The price tanked a bit due to a lack of volume, but the price drops are sporadic and negligible. Bitcoin’s price went down by 0.59% on the day. It is trading for $7,247 at the time of writing. Meanwhile, Ethereum lost 0.7%, while XRP lost 0.4%.

Tomo Chain gained 21.44% on the day, making it the biggest daily gainer. The biggest loser of the day was Silverway, which lost 7.88% of its value when compared to yesterday.

Bitcoin’s dominance gained half a percent during Christmas time. Its dominance is now at 68.7%, which represents an increase of 0.5% from when we last reported.

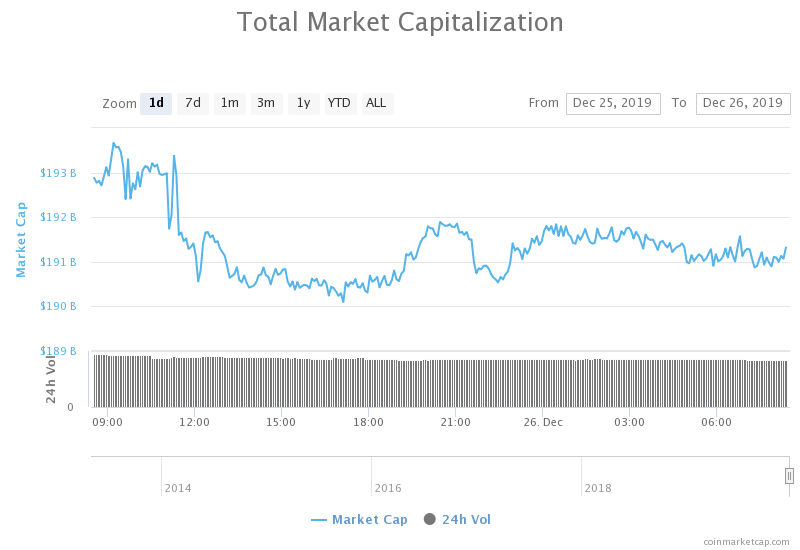
The cryptocurrency market capitalization lost around four billion dollars during Christmas. It is currently sitting at $191.32 billion at the time of writing. This represents a decrease of $3.69 billion when compared to the value it had 24 hours ago.

What happened in the past 24 hours

YouTube, the biggest video-sharing social media platform, has unexpectedly started to delete cryptocurrency-related content from the platform. Both big and small content creators are affected.

Countless Twitter and Reddit threads popped up, all about YouTube suddenly deleting a number of crypto-related videos Dec. 23. On top of the video deletion, YouTube sent out an official warning to content creators in the form of a “strike.” When the account gets “struck” 3 times, it gets shut down.

YouTube has yet to respond on why it censored these videos.

_______________________________________________________________________

Technical analysis

_______________________________________________________________________

Bitcoin

Bitcoin spent Christmas losing some value, but the loss is almost insignificant. Its price did fall under the 38.2% Fib retracement line of $7,260. After falling under the support level which now turned resistance, Bitcoin seems to have consolidated near the top of the range.


Bitcoin’s volume was quite low, which can be explained by the holidays. Its RSI was quite stable and around the middle of the value range.

Key levels to the upside                    Key levels to the downside

1: $7,260                                           1: $6,940

2: $7415                                            2: $6,640

3: $7,525                                           3: $6,415


Ethereum

Ethereum also spent Christmas losing some of its value. The price is still contained within the resistance of $128.1 and support of $122.5. The price is now consolidating in the middle of the range.


Ethereum’s RSI level is currently on the rise, with the volume being on the lower end of the spectrum.

Key levels to the upside                    Key levels to the downside

1: $128.1                                             1: $122.07

2: $130                                               2: $117

3: $141.15


Ripple

XRP’s broke a key support during Christmas. Its price dropped below $0.19 and could not make it back above. It is now consolidating just below this level, which currently acts as resistance. XRP has quite a free fall if it decides to drop in price. The next support level is at $0.178.


XRP’s volume is, just like Ethereum’s and Bitcoin’s, pretty low. This is, again, most likely due to fewer traders being involved with the market during the holidays. The key level of $0.19 is now acting as resistance.

Key levels to the upside                    Key levels to the downside

1: $0.19                                              1: $0.178

2: $0.198                                            2: $0.1678

3: $0.2058

Categories
Crypto Market Analysis

Today´s Crypto Events 30.07.2018

Here you can find all the news about the upcoming hard fork, releases, exchange listings, updates, conferences, new launches, etc. We gather the most relevant events and conferences for you to pick from.

Today´s Crypto Events 30.07.2018


  • BitBay (BAY) — Web Marketplace Beta Version
  • FuzeX (FXT) — CoinBene Exchange Listing
  • 0x (ZRX) — CoinX Exchange Listing
  • OriginTrail (TRAC) — AMA on YouTube
  • Triggers (TRIG) — AMA Session
  • SureRemit (RMT) — SureRemit App Launch
  • Level Up Coin (LUC) — Сlosed Alpha Testnet
  • ClearPoll (POLL) — New Side Project Announcement
  • Refereum (RFR) — Bibox Exchange Listing
  • Delphy (DPY) — Snapshot for Monthly Airdrop
  • Dock (DOCK) — Binance Exchange Listing
  • Everus (EVR) — Peer-to-Peer Microfinancing
  • TRON (TRX) — Virtual Machine Testnet Launch
  • Metal (MTL) — Crumbs App Soft Launch
  • Linker Coin (LNC) — Token Burning
  • Everus (EVR) — Multi Currency Payment Gateway Launch
  • LBRY Credits (LBC) — Live-Video Contest
  • LockTrip (LOC) — Integration of a Middle Layer App
Categories
Crypto Market Analysis

Cryptocurrencies and Manipulation

Cryptocurrency Market Manipulation

Cryptocurrency Market Manipulation

It’s a well-known fact that cryptocurrency market manipulation is caused by many factors. But so is every other market in the world. So why are cryptocurrencies so much more volatile in the times of manipulation?

Why Does Manipulation Affect Cryptos So Much?

Cryptocurrencies, and mainly Bitcoin are extremely susceptible to manipulation. The reason for that is the big growth crypto movement had in the past years. If you think about it more, market cap certainly does not reflect the total money that went into the crypto markets. Another reason would be the youth of the market and the general mentality of an average crypto investor.

Overleveraged Dollar Value

Early investors could buy Bitcoin for as low as $400 not so long ago. And as the value of a cryptocurrency is just as much about what the next person is willing to pay, with more adoption and speculation, the price rose. With the price, market cap rose too. That made every dollar put in become overleveraged and worth a lot more, for both up and down moves. In trading, this means that less actual money is needed to bring a market up or down. People brought markets down, and rose it up for several billion market cap wise, with only several million dollar orders.

Average Investor Mindset

If we look at an average crypto market investor, it does not match the profile of a traditional markets investor. A traditional investor is in his mid-40s or 50s, middle class and calm. On the other hand, an average crypto investor is young, without much knowledge of the markets, financially dependent and very susceptible to fear of missing out and fear of losing. That’s why the reactions of crypto investors are much more linear, both to the up and down side.

This creates a problem as an already overleveraged market cap of cryptocurrencies gets shook by multi-million dollar manipulative order, and that creates unreasonable fear with the investors. And since our average investor is young and does not handle stress well, he buys or sells in excess, which further accentuates the move. This happens in both a downturn and an upswing.

Conclusion

Cryptocurrencies will remain volatile for a couple more years until the profile of an average investor changes. When investors become more mature, the market will follow. This, however, will not happen in a month or two. Market maturity is a process that every tradable asset needs to go through.

Categories
Crypto Market Analysis

Daily Crypto Update 21.06.2018 – Permanent Indecision

The market is moving sideways today and there is not a real direction we can say it is going in right now. Most of the cryptos in the market have a lot of barriers to break in order to consolidate prices. Only 27 of the top 100 cryptos appears in green which is showing us that we are more likely to see a move down today.


 General Overview


Market Cap: $286.905.409.179

24h Vol: $11.907.725.991

BTC Dominance: 40.1%


News


Korean Government Details Regulatory Plans After Multiple Crypto Exchange Hacks
Following multiple hack reports, the South Korean government explains how it will strengthen the regulatory framework for cryptocurrency exchanges. A bill has already been submitted which imposes multiple new obligations on crypto exchanges.

Source: bitcoin.com

US Congressional Members Ordered to Disclose Crypto Holdings
The House Ethics Committee has informed all US Congress members that they must disclose any investment worth more than $1,000 as of June, 18

Crypto Mining Mogul Hits the Big-time with Portable Mining Containers
Serial crypto entrepreneur Valery Vavilov of Bitfury has struck gold again with his latest venture by solving two of the main hurdles in mining cryptocurrency with some big black boxes.

Litecoin Futures are a Go on UK Crypto Exchange
Litecoin (LTC) derivatives are a go in the UK. Trading platform Crypto Facilities announced that as of Friday, June 22, their new dollar-denominated service will allow investors to trade in futures contracts which have Litecoin as the underpinning collateral, with weekly, monthly and quarterly maturities.

Source: newsbtc.com


Analysis


XRP/USD

The price of XRP has lost 1.14% in the last 24 hours and is trading above $0.53 after having rebounded in the EMA-50 in this 4 H chart. The pair is bearish in the last hours since the sellers have pressed hard and the attempts to exceed $0.54 have been unsuccessful. The price could continue to fall and reach $0.5286 (61.8% Fibonacci).


Market sentiment

4-H chart technicals signal a sell sentiment.

Oscillators are showing sell signals and pointing down.


Pivot points

R3 0.5809
R2 0.5653
R1 0.5525
P 0.5375
S1 0.5244
S2 0.5093
S3 0.4962

LTC/USD

Litecoin hasn’t been able to recover the $100 level and has been repeatedly bouncing in the EMA-50. The price will have to beat several lines in order to go for the $100 again, such as $97, very close to the Central Pivot Point. If the $100 level is achieved the bulls would have a good opportunity to look for higher levels such as $107 and then $110.


The next strong support is S1 Pivot Point in $95.93. Below that, there are no more barriers until the S2 Pivot at $93.96.


Market sentiment

4-Hourly chart technicals signal bearish.

Oscillators are showing sell signals and pointing down.


Pivot points

R3 102.87
R2 100.91 
R1 99.37 
P 97.44 
S1 95.90 
S2 93.97 
S3 92.41

BTC/USD

BTC has lost 0.85% in the last 24 hours and is moving right now at $6,717, trying to break the Central Pivot Point at $6.710. The buyers are trying with no success to get the $6,800 but this is a very important number because a break above this can send the price towards the $7,000. We can see here in this 1H chart a contracting triangle formed with support at $6,684 and resistance close $6,770.


The price is approaching both break lines of the triangle and I think the price will break below $6,700 to look for the S1 Pivot at $6.606.


Market sentiment

1-Hourly chart technicals signal bullish.

Oscillators are showing mixed signals.


Pivot points

R3 7.124
R2 6.970 
R1 6.865 
P 6.710 
S1 6.605 
S2 6.451 
S3 6.346

Conclusion 


The market continues indecisive but with a more downward trend in the pairs analysed today. There is a weekend coming where we must be very attentive to maybe strong movements, mainly bearish. However, many investors will be hoping for an upward trajectory that has not been seen in months.

Categories
Crypto Market Analysis

Daily Crypto Update 19.06.2018 – Green Market But Some Uncertainty

The market is in green again and after the unexpected positive movement in all the charts yesterday, there is a question in the air and it is; how manipulable is the market and where these unexpected movements come from when it is evident that there is no important fundamental news especially in BTC which is the currency that moves the others?


General Overview


Live Crypto News:
Market Cap: $293.010.746.832
24h Vol: $13.905.498.839
BTC Dominance: 39.8%


marketCap19.06 - Live Crypto News:
marketCap19.06

The capitalization of the market continues to rise as well as the daily volume, this may mean that we could have a continuation of the increases if there is a strong enough push in the buyers.


Live Crypto News


TRON [TRX] the only double-digit gainer among top 50 [24 hrs].
Source: ambcrypto

‘Flaws’ in Japan’s Biggest Crypto Exchanges Will See Regulator’s Warnings
A handful of major Japanese exchanges including bitFlyer, Japan’s biggest and best-funded crypto trading platform, are facing business improvement orders from the country’s financial regulator and watchdog.
Source: ccn.com

‘A Moral Hazard’: Bank of Korea Opposes Central Bank Digital Currency
The Bank of Korea (BoK) has revealed it is against the idea of issuing a central bank digital currency following a feasibility review.
Source: ccn.com

Active Blockchain Projects in Use? Logistics is Overtaking Finance
Many predicted that finance would be among the first innovators in the blockchain. Harvard Business Review concluded that education about blockchain is no longer lacking in finance as it is in industries like manufacturing, predicting we’ll see finance projects finished first.
Source: ccn.com


Analysis


ETH/USD

Ethereum responded positively to the markets rise yesterday which represents gains of 7.37% in the last 24 Hours, after the breakout of the critical resistance of $520 the pair reached pivot R1 in $540 and at this moment is trying to cross this line. Nevertheless, the EMA of 100 periods is a little lower doing its job as strong resistance at this time. The RSI is in the overbought area as well as the Stochastic so the buyer impulse may be weakened in the next hours.


Market sentiment

ETH 4h chart bullish.

Oscillators are on the overbought zone.


Pivot points

R3 629.1 
R2 584.3 
R1 540.6 
P 494.7
S1 451.1 
S2 406.5 
S3 362.2

TRON/USD

TRON has gained 16.32% in the last 24 hours, apparently due to the negotiations that have already been made public about reports that founder Justin Sun is up to close a deal to acquire BitTorrent.


Now TRX is trading at $0.049, up from $0.041 from yesterday; the price has crossed the pivot R1 and now is trying to beat the EMA-100 after crossing the upper line of the descendant channel. If buyers pressure is strong enough the price should stay above the R1 for the next hours, waiting for a trend change that is not yet confirmed, the RSI and Stochastic indicators are in an overbought area which could send the price back to the channel.


Market sentiment

TRX 4H chart is showing Bullish.

Oscillators are on the overbought zone.


Pivot points

R3 0.0599 
R2 0.0545 
R1 0.0484 
P 0.0428
S1 0.0369
S2 0.0313 
S3 0.0252

ADA/USD

ADA has gained 4.55% in the last 24H but has been moving within a narrow range in the last week, the price has not reacted to the latest news that says Cardano has been added to a tradable asset on eToro.


The support at $0.155 has been tested several times while the immediate resistance is at $0.1721. My appreciation for the pair is of a bearish continuation in the medium term, even though the indicators have already left the overbought area.


Market sentiment

ADA 4H chart is showing Bearish.

Oscillators are pointing up in and over the 50 level.


Pivot points

R3 0.2194 
R2 0.2003 
R1 0.1804 
P 0.1614
S1 0.1414
S2 0.1224 
S3 0.1029

Conclusion


Live Crypto News: Difficult levels were overcome in the short term for many pairs but nothing is certain for the next sessions. Most of the cryptocurrencies are in green due to the unexpected yesterdays rise, but there is a lack of clarity about these movements and very likely the tendencies that were strong in the main pairs will be recovered; but if capital continues to enter the market it will help the main Cryptocurrencies to recover all the critical levels lost the last week.

Categories
Crypto Market Analysis

Weekly Crypto Update 18.06.2018

A quite negative week for Bitcoin and the whole market of cryptocurrencies. The dominance of BTC continues with 40% of the market but we are facing a very difficult time where the bears took more than $30 billion despite some good news from the SEC. There is a widespread fear of a loss of the important support at $6,000, which would be catastrophic for all cryptocurrencies because we would probably see a minimum of the main currency close to $3,000.


General Overview


Market Cap: $277,355,449,832

24h Vol: $9,920,627,425

BTC Dominance: 40.0%

From last Monday, the market capitalization in cryptos has decreased from $294,759,000,000 to $276,905,000,000 so, 18B has gone out of the market.


Analysis


BTC/USD

BTC starts the week above the support of $6,400 but as I’ve said previously, if there is a confirmed breakout below $6,000 this week or in the following weeks, it would be bad enough for those who keep their coins static or those called “Coinhoders”; and as we have seen, there is a direct connection or correlation between the BTC and the altcoins, so the market would be a complete red spot.


In this daily chart, I keep maintaining the position of last week where the most feasible scenario is the case of breakout below $6,400, targets to be met would be the ones marked here $5,533 and $4,711. To consider a return of the bulls, the price would have to return above $ 8,000, we’ll see what happens this week.


Market sentiment

Bitcoin daily chart showing sell.

Oscillators are on oversold zone and EMAS pointing down.


Pivot points

R3 7639.1 
R2 7277.4 
R1 6866.4 
P 6504.60.8
S1 6414.7 
S2 5715.5 
S3 5304.4

XRP/USD

Ripple lost 25% of its value in the last week. Since yesterday it has been moving in a narrow range between $0.5194 and $0.5384, in a quite calm weekend for the three main pairs of the top 10 of the market. We will see if the buyers try a positive rescue in the pair this week, although I see enough resistances to beat on the road.


Market sentiment

XRP 4H chart is showing neutral.

Oscillators are on oversold zone and EMAS pointing down.


Pivot points

R3 0.6804 
R2 0.6409 
R1 0.5828 
P 0.5434
S1 0.4859
S2 0.4462 
S3 0.3902

ETH/USD

ETH has lost 19.1% since last Monday and 30% in the last month. This is not encouraging for short-term investors who have seen the pair touch two months minimums after a significant recovery that raised it to $835 last May 5.


This week begins with lateral movements in the pair and the Bollinger bands are narrowing quite a bit. We should expect an important break to one of the sides although looking at the indicators there is more chance of a downward movement than the opposite. The Asian Session just starts and we are looking forward to an interesting week in the charts.


Market sentiment

ETH 4H chart is showing Bearish.

Oscillators are pointing down near 50.


Pivot points

R3 638.99 
R2 590.86 
R1 544.43 
P 496.90
S1 450.4
S2 402.94 
S3 355.41

 Conclusion


As the market is quite battered, investors are waiting for what may happen this week and if the market is going to recover in the short term, there is a lot of fear for a possible drop continuation in Bitcoin which as we know could generate a completely red market. Panic Selling could be the next word to use if the week starts bearish for the cryptocurrencies.

Categories
Crypto Market Analysis

TODAY’S CRYPTO EVENTS 15.6.2018

TODAY’S EVENT 15/6/2018


This is the Cryptocurrency events calendar. All the news about the upcoming hard fork, releases, exchange listings,  updates, conferences, new launches, etc.


GoldCoin (GLD) – Cryptolina 2018

SpaceChain (SPC) – Cryptolina 2018

Storiqa (STQ) – DMFX Financials

Flash Token (FTOKEN) – Online Store Launch

Viuly (VIU) – Beta Release

Digital Money Bits (DMB) – Masternode Swap

Docademic (MTC) – Monthly Airdrop
Lightning Bitcoin [Futures]

(LBTC) – Listing on FUBT

AppCoins (APPC) – Aptoide with Side-Chain

Particl (PART) – Livestream

Pylon Network (PYLNT) – Seoul Presentation

LUXCoin (LUX) – Mercury v5.0
Civic (CVC) – Webinar

WePower (WPR) – Community AMA

Apex (CPX) – Listing on BitZ

Hydrogen (HYDRO) – Community AMA

StarCash Network (STARS) – New Website Release

Aion (AION) – Community AMA

Bigbom (BBO) – Listing on Kyber Network

DADI (DADI) – Community AMA

Humaniq (HMQ) – Community AMA

QuarkChain (QKC) – Korea Meetup

Odyssey (OCN) – Seoul Meetup

Vice Industry Token (VIT) – Livestream

Decred (DCR) – Listing on Huobi

Bitcoin God (GOD) – Livestream

Categories
Crypto Market Analysis

Daily Crypto Update 14.06.2018 – The Market Is Stressed

The market is trying to take a break in its drop and Technical Indicators seem to be pointing to a bullish movement for some of the most important currencies, some greens are now in the charts after some important support levels were touched yesterday. The drop, however, has not been declared as finished and all the accumulated drops of the week need big buying efforts to call the following days positive for the different pairs.


General Overview


Cryptocurrencies: 1628
Market Cap: $274.212.015.277
24h Vol: $16.658.912.029
BTC Dominance: 40.1%

Market capitalisation has moved down but just by 2 billion dollar which indicates the Capital Outflow has decreased and the market seems ready to receive buyers.


News


Thailand SEC Eyes Approval of 5 ICOs out of 50 Applicants This Month
Thailand’s Securities and Exchange Commission (SEC), the country’s capital markets authority, is reportedly expecting to approve five initial coin offerings (ICOs) this month.

India’s Central Bank Banned Cryptocurrency with Zero Research or Consultation
The Reserve Bank of India has responded to a query seeking explanations for its reasons to ban banks from dealing with the cryptocurrency industry, admitting it conducted no research prior to its prohibitive action.

$250,000 to $20 Million: Coinbase Launches Index Fund for Large Investors
Coinbase has officially launched its new cryptocurrency index fund, a product specifically catered to large investors, enabling access to all five cryptocurrencies listed on the platform.

Bitcoin Price Bounces From $6,100 to $6,500, Market Buys Breathing Room
The bitcoin price has demonstrated a short-term corrective rally from $6,100, rebounding to $6,500 over the past 24 hours, rising by around 6.5%. Small cryptocurrencies and tokens followed the price movement of bitcoin on the upside.

ICOs are Securities, ‘Don’t Know How Much More Clear I Can Be’: SEC Chairman
The SEC held a public forum on June 13, “Investing In America: Atlanta Town Hall Meeting.” The town hall was highly anticipated because regulators planned on speaking about cryptocurrency regulations and innovation. The session was open to the public and streamed live on the SEC website.

Source: cnn.com


Analysis


ETH/USD

ETH/USD Has gained 9.61% in the last 24 hours, the price reached $494 showing what would be a good rebound signal and quickly weakened sending the price to $463, then came a big and unexpected buyers movement that sent the price over the immediate resistances and its moving right now at $516, just over the 100-EMA .


With this movement, the indicators changed to point up, which indicates that there may be a good upward journey.


 Market sentiment

1-hour chart Technical indicator show Bullish Momentum.


Pivot Points

R3 554.7 
R2 528.5 
R1 502.2 
P 476
S1 449.7 
S2 424.1 
S3 397.9

TRON/USD

The price of TRON reports an increase of 4.10% today, Thursday, bouncing strongly in the pivot R1 in this 4H chart and its current price is $0.0413. TRON continues its Bearish trend and it seems that it wants to stay in the middle of the Bearish Channel.


For now, the Central Pivot Point is holding the price but a breakout of this could take it to the bottom of the channel, On the positive side we see that indicators are leaving the oversold area and pointing up. What can keep the price above the Central Pivot Point?


Market sentiment

4-hour chart Technical indicators pointing up, Bearish.

Moving averages separated and pointing down, showing sell signs.


Pivot points

R3 0.0511
R2 0.0477
R1 0.0443
P 0.0408
S1 0.0375
S2 0.0340
S3 0.0306

XRP/USD
The price of the XRP reports a slight increase of 1.73% in the last 24 hours without showing a significant recovery and remains below $0.55, the price did not reach in its short recovery at the R1 Pivot in this 4-hour chart and its moving now at $0.5484. This level is important to maintain as it would avoid more losses in the short term.


 The resistance of $0.55 in R1 is quite strong and there must be a significant buyer impulse to take it above $0.56.


Market sentiment

4-hour chart Technical indicators pointing up, Bearish.

Moving averages crossing possible bearish movement.


Pivot points

R3 0.6176
R2 0.5899 
R1 0.5601
P 0.532 
S1 0.5016
S2 0.4739
S3 0.4431

Conclusion


The market is stressed after the long drops of the current week, buyers should appear in any moment to take advantage of the minimums in many pairs.

Categories
Crypto Market Analysis

XMR/USD You Can Still Catch The Sell-Off


Monero (XMR)


Monero Market Cap: $2.16B

Circulating Supply: 16.12M XMR

 Max Supply: 0 XMR

Volume (24h) $36.49M


Technical Analysis


 The cryptocurrency could extend the sell-off in the upcoming period after the crucial breakdown.  The rate passed below a major support area signalling that the bears are in full control. Right now it remains to be seen if the rate will come back to retest the broken zone or it will drop further without a rebound.

Monero drops as all the major cryptocurrencies have started another bearish momentum. The crypto market could resume the major downtrend.


You can see that the rate has made a valid breakdown below the first warning line (WL1) of the ascending pitchfork, it has retested the lower median line (lml) of the other ascending pitchfork and now is trading much below the 150.00 psychological level.

It has also retested the uptrend line failing to close on it, so the current drop is natural and was expected. If you read the latest trade setup on this crypto, you’ll notice that I’ve talked about a significant drop after the rate will make a valid breakdown below the 150.00 level and below the 145.810 low.

XMR/USD could be attracted by the confluence area formed between the 250% Fibonacci line (descending dotted line) with the 150% of the ascending pitchfork.


Conclusion


If you want to go short on this you should place your Stop Loss above the 177.78 high. Personally, I still believe that the rate could move towards the first warning line (wl1) of the minor descending pitchfork. A further drop will be confirmed only by a valid breakdown below the 250% line and below the 150% lines.

Categories
Crypto Market Analysis

NEO Could Hit The Floor


NEO (NEO)


Market Cap: $3.39B

Circulating Supply: 65M NEO

Max Supply: 100M NEO

Volume (24h) $79.80


Technical Analysis


NEO/USD is trading in the red and seems determined to extend the current drop. It has failed to stay higher and now moves towards important support levels. The major cryptocurrency drops as the crypto market is in the red again.

It could drop further in the upcoming days if Bitcoin, Ethereum, etc. will resume the bearish momentum. Several false breakdowns and some rejections have signalled that the crypto pair could drop further in the short term.


The price has escaped from the ascending pitchfork’s body and now could drop towards the 50.00 psychological level. The drop was confirmed by the false breakout above the lower median line (lml) of the ascending pitchfork and after the valid breakdown below the sliding line (sl) of the ascending pitchfork.

Right now we need a confirmation that the crypto will drop further. It has slipped below the SL of the major descending pitchfork and below the 150% Fibonacci line of the ascending pitchfork. Only a valid breakdown below the mentioned lines and below the upside 50% Fibonacci line of the minor descending pitchfork will signal and will really confirm a drop towards the UML of the major descending pitchfork and towards the sliding line (sl1) of the minor descending pitchfork.

I’ve drawn a descending pitchfork to show you that the rate is trapped within a down channel. A further drop could be invalidated only by a valid breakout above the upside sliding line (sl) of the minor descending pitchfork.


Conclusion


NEO/USD will drop further if it will close below the 51.81 yesterday’s and today’s low and could reach the sliding line (sl1) and the median line (ml). The Stop Loss could be placed somewhere above the sl2.

Categories
Crypto Market Analysis

Cryptocurrencies Mirage

The crypto market total capitalisation has reached the $345,848,996,562 level and a $15,093,140,340 daily volume, much lower compared to January 2018. Nowadays everyone wants to make huge profits by trading or investing in the cryptocurrencies. There are all kinds of economists and specialists that continue to sustain that the cryptocurrencies should drop much deeper because they are overstated. You should know that what happened on Bitcoin won’t happen again because the conditions have changed and there are a lot of factors that influence the market.

Source: investing.com

Also, the crypto market is very volatile because the traders and investors are more cautious and they prefer to trade on the short term after last month’s major corrective phase. Last year’s amazing rally is history now, so we need to focus on what could happen in the upcoming period and maybe we’ll catch other important movements in the short to the medium term.

The high volatility makes trading very risky because the market could turn against you very fast and you can suffer a heavy loss.

In this editorial, I want to talk about the EOS because this crypto has become one of the most important and most traded cryptocurrency.


EOS/USD Analysis


As you can see on the Daily chart, EOS/USD rallied aggressively and reached fresh new highs in the last months. It has increased from 3.8723 on March 18, 2018, to 23.0290 level on 29 April 2018. So, EOS increased sharply and has brought amazing profits to those that have invested in it. That’s why more and more people want to trade or to invest in the crypto market. We still have great opportunities despite all the rumours and even if the market is very volatile. I’ve said in another editorial that the cryptocurrencies should be treated like any other speculative assets and that’s exactly what you should do if you don’t want to have any surprises.

EOS/USD plunged after reaching the 23.0290 top and now has found a strong support and a bottom on the median line (ml) of the ascending pitchfork, and right below the 61.8% retracement level. The two false breakdowns below the 61.8% retracement level have sent the rate higher again.

EOS/USD still has a huge potential if it stays above the median line (ml) of the ascending pitchfork, but you should know that only a valid breakout above the upper median line (uml) and above the 250% Fibonacci line will confirm another significant upside movement. The major target remains at the 23.0290 historical high.


Conclusion


You should know that there will be a lot of opportunities in the crypto market despite the high volatility and despite the bearish bias. If you’ll make a great analysis you may find cryptocurrencies with important potential, but you should take into consideration all the factors that could ruin your scenario and your expectations.