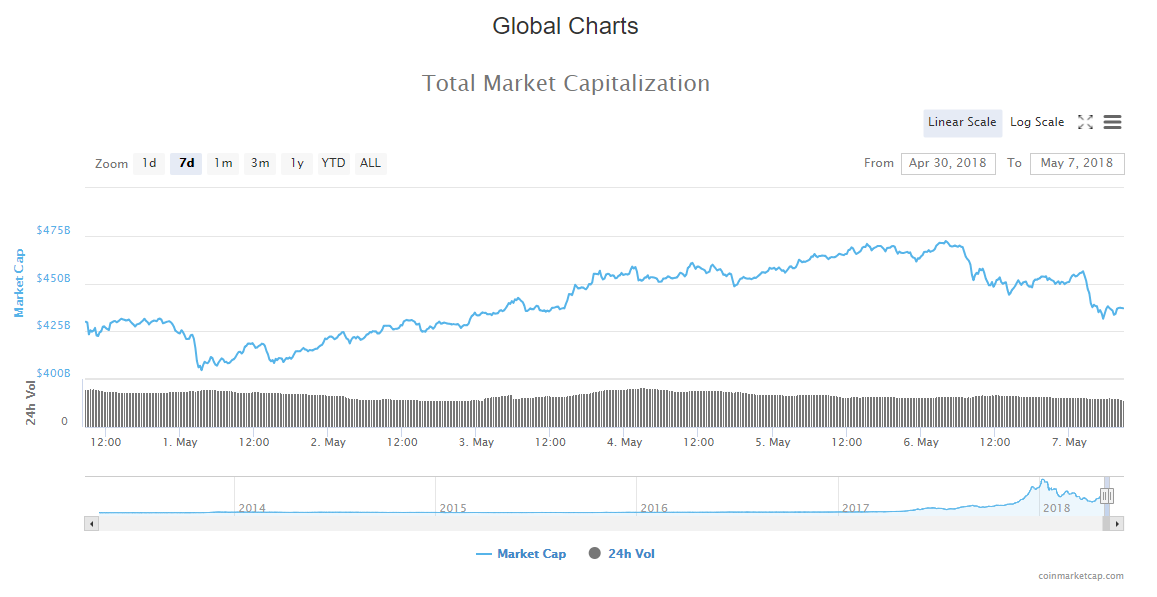
General overview
Market Cap: $435,421,093,161
24h Vol: $22,446,339,237
BTC Dominance: 36.5%
In last 24 hours, cryptocurrency market cap has fallen from 471,210,000,000$ to 435,421,000,000$ where is now sitting.
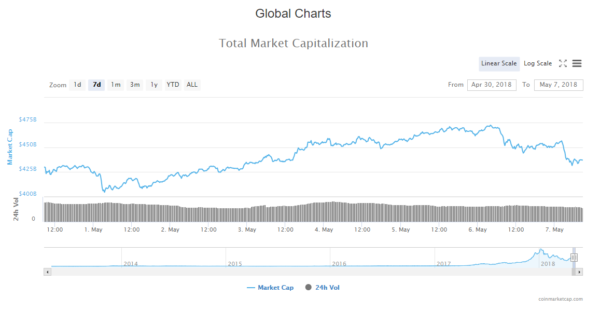
The market is mostly in red, with the average drop in price by 6% for top 100 cryptocurrencies.
News
News that came out in the last 24 hours isn’t responsible for the decrease in market capitalization, as news is mostly positive in nature.
New Head Of South Korean Financial Regulator Notes ‘Positive Aspects’ Of Crypto
The newly appointed governor of South Korea’s Financial Supervisory Service (FSS) said that he sees “some positive aspects” to cryptocurrencies in a press conference today, May 6. The governor also said the FSS will be working on crypto regulatory “issues” in collaboration with other regulators, local news outlet The Korea Times reports.
Source: cointelegraph.com
Azerbaijan’s Taxes Ministry Says Crypto Revenue Is Subject To Taxation
Revenue from crypto-to-fiat transactions will be subject to taxation in Azerbaijan, local news outlet Trend reported Saturday, May 5. Nijat Imanov of the country’s Taxes Ministry outlined the new measures during the second Finance and Investment Forum (FIF 2018) in Baku Saturday.
Source: cointelegraph.com
Japan’s Financial Watchdog Sets Out New Requirements For Crypto Exchanges
Japan’s financial watchdog, the Financial Services Agency (FSA), has laid out yet further regulatory stipulations for domestic crypto exchanges, Cointelegraph Japan reports today, May 6.
Source: cointelegraph.com
“It Never Was a Security”: Ethereum Under The Regulatory Spotlight
The cryptocurrency is subject to a looming enquiry by the US Securities and Exchange Commission (SEC) as well as the Commodity Futures Exchange Commission (CFEC) for its token presale in 2014. According to the Wall Street Journal, regulators are taking a close look at the cryptocurrency and whether it should be classed as a security, as set out in the Securities Act 1933. The major point of concern is the presale of ETH tokens in 2014. In total, 31,000 BTC were raised by the Ethereum Foundation to fund the development of Ethereum – worth around $18.3 mln at the time (and about $300 mln at press time).
Source: cointelegraph.com
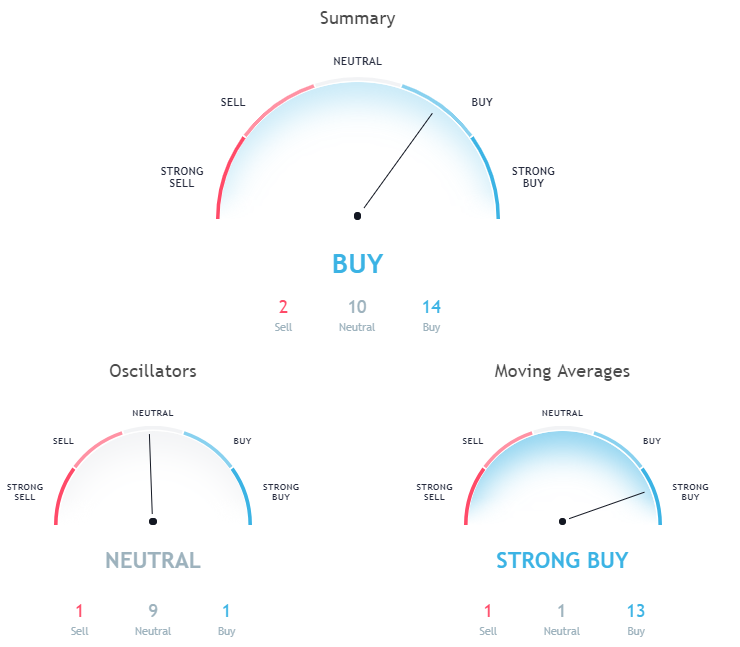
Analysis
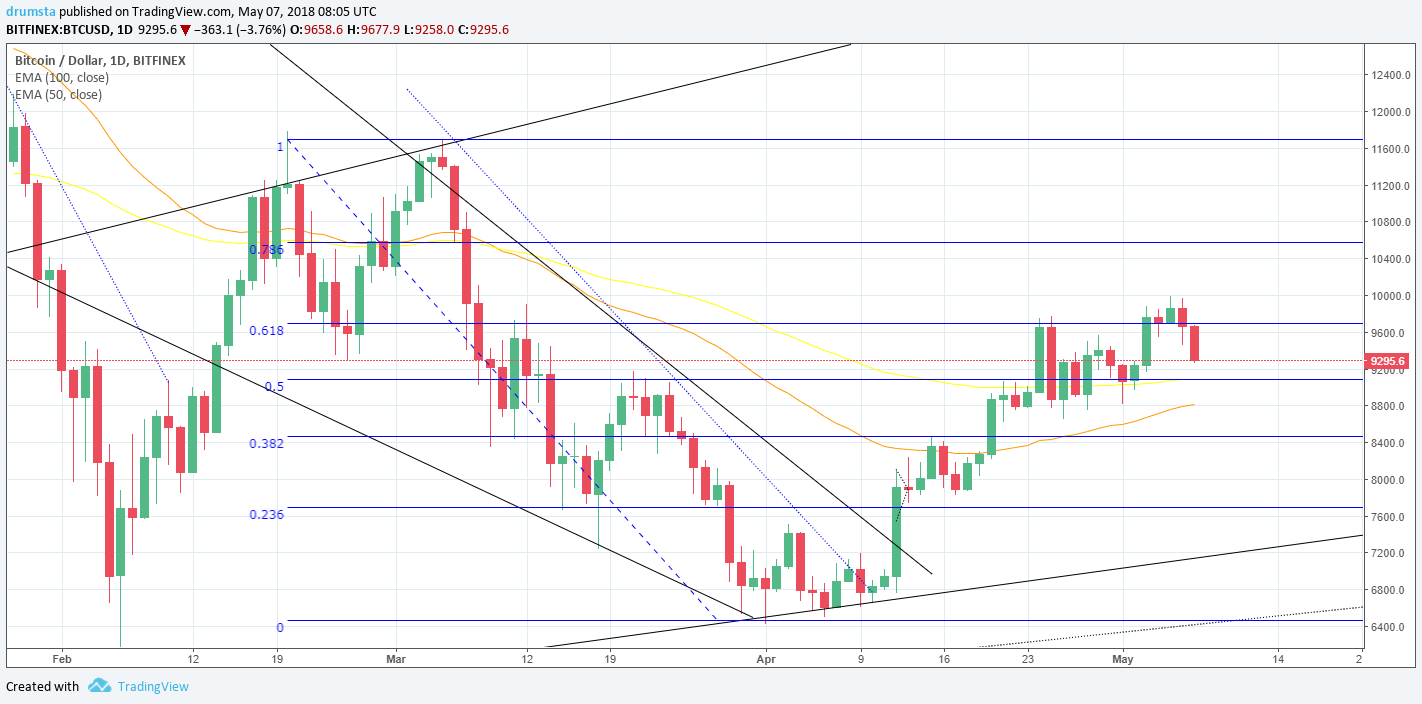
BTC/USD
From yesterdays opening, the price of Bitcoin has dropped by 6,78% coming from 9960$ to 9286$ where it is now sitting.
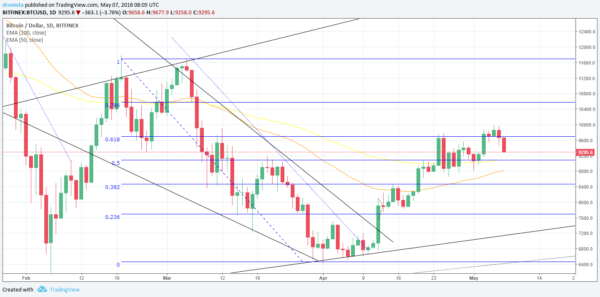
Looking at the daily chart we can see that the price went above 0.618 Fibonacci level, retested it for support, but it didn’t hold and is now below it. The price is, however, still above the 100-day EMA.
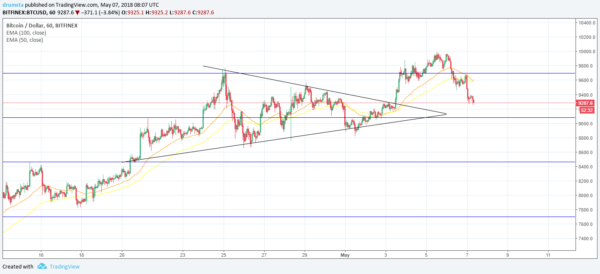
Zooming into an hourly chart, we can see the momentum behind the drop, and it was the same strength as the prior rise from the triangle pattern.
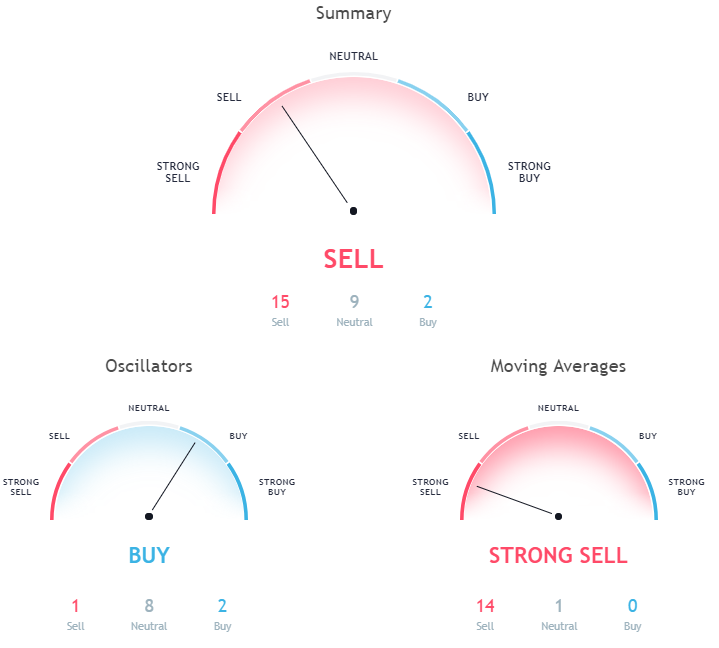
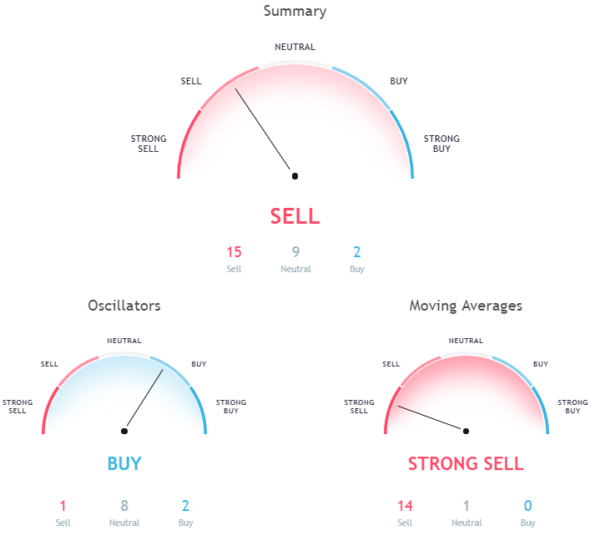
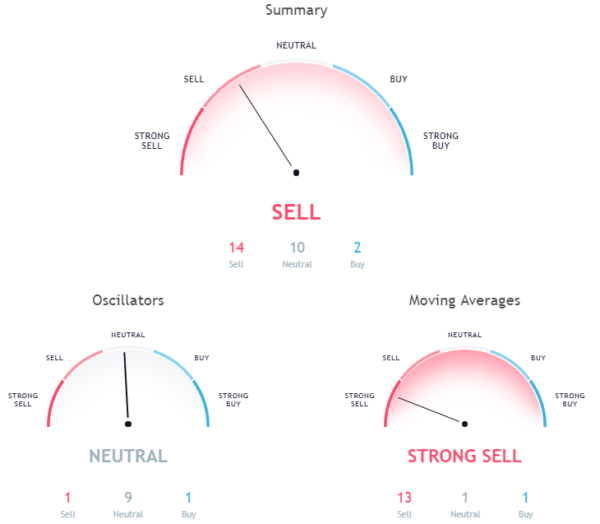
Hourly chart signals a sell.
Pivot points
S3 8672.2
S2 9182.2
S1 9420.5
P 9692.2
R1 9930.5
R2 10202.2
R3 10712.2
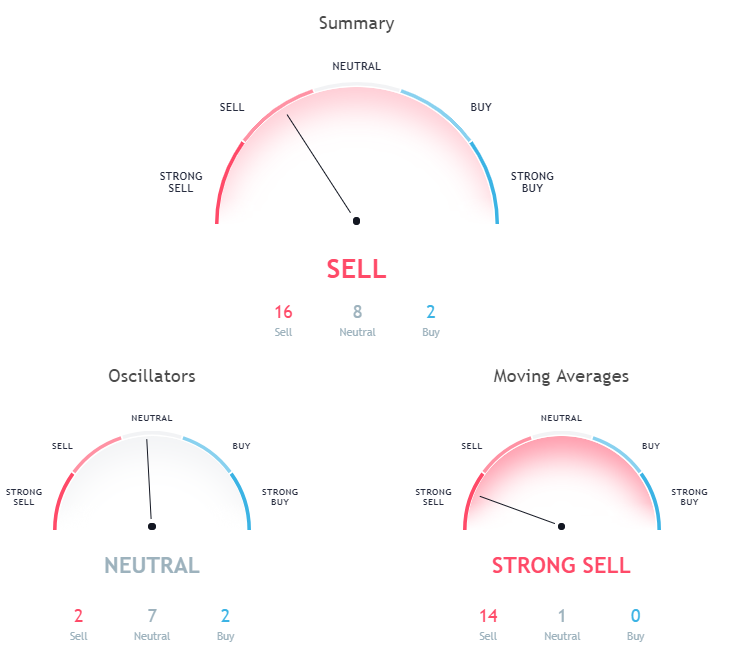
ETH/USD
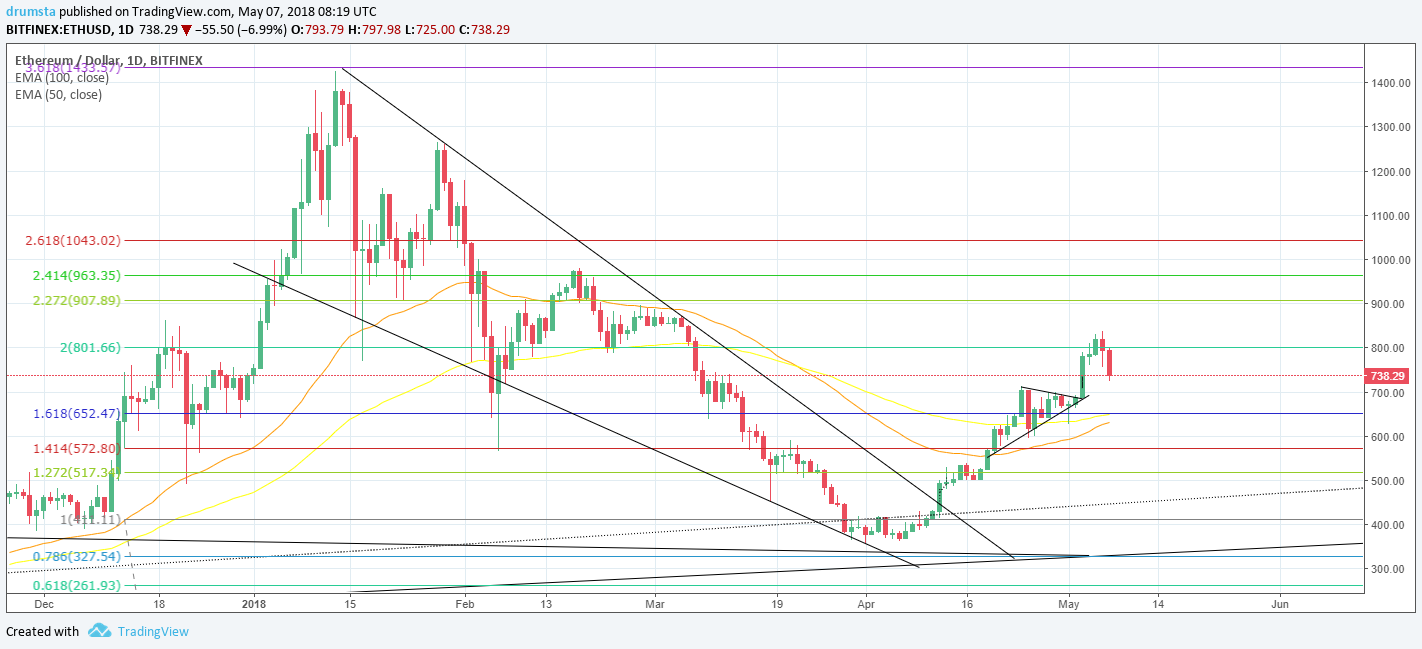
In the last 24 hours, the price of Ethereum has dropped by 12,66% coming from 838$ to 733$ where it is now sitting.
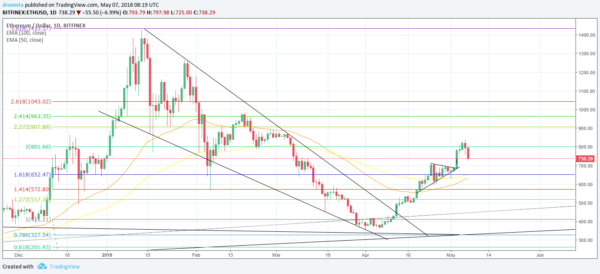
Looking at the daily chart we can see that as in the case of Bitcoin, Ethereum’s price has reached the upper Fibo level, before being repealed by it, and is now in a downward trajectory.

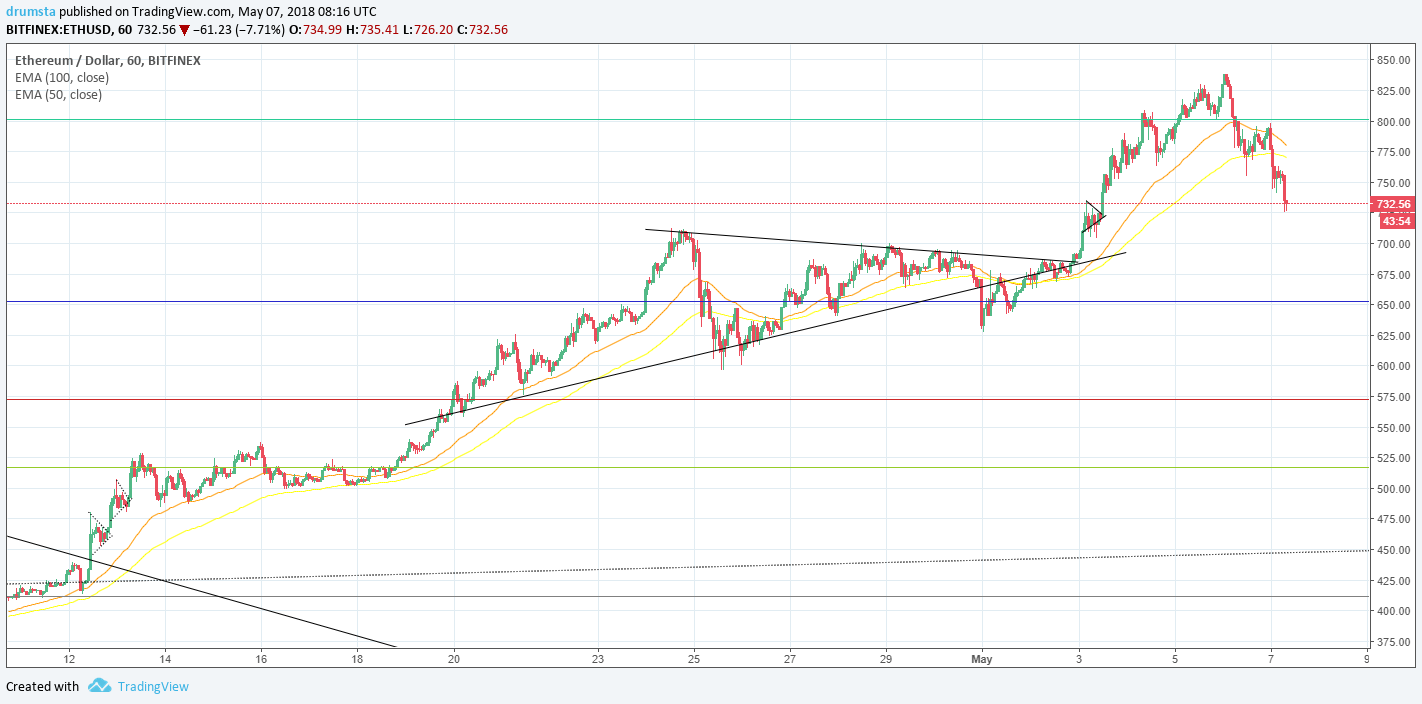
Zooming into an hourly chart we can see the similarities with Bitcoin – the momentum is equally strong as is was when the price was rising, and because of this, the head and shoulders pattern is being formed, with the head slightly sticking out from above the 2 Fibonacci level.
That’s why hourly chart signals a sell.
Pivot points
S3 629.13
S2 712.33
S1 753.06
P 795.53
R1 836.26
R2 878.73
R3 961.93
XRP/USD
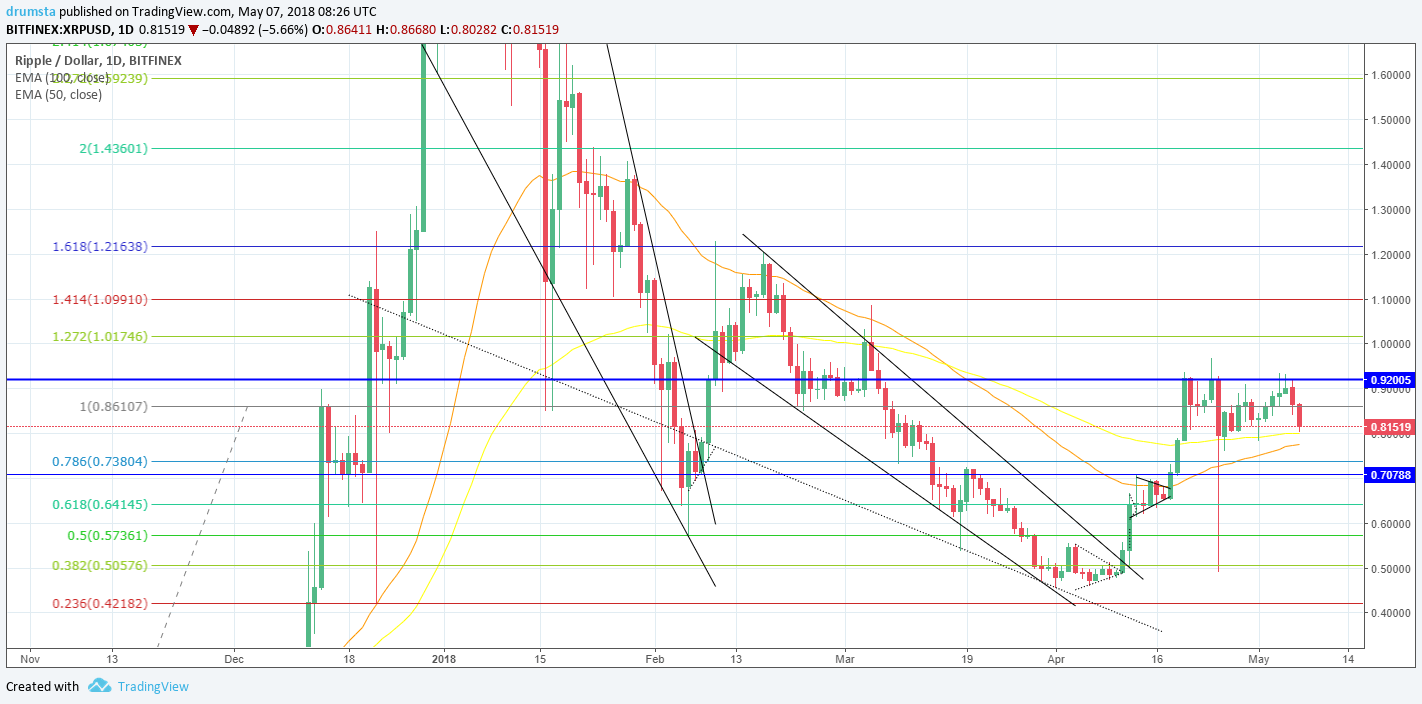
Ripple’s price has dropped by 12,57% coming from 0.926$ to 0.814$ in the last 24 hours.
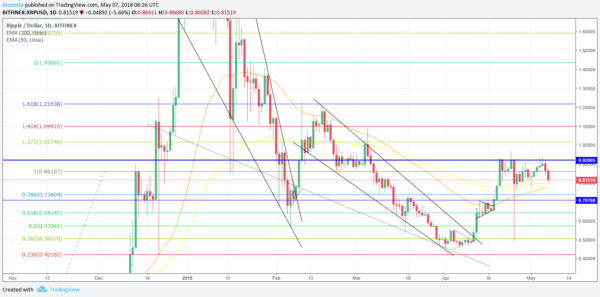
On the daily chart, we can see that once again the price failed to break the key resistance level at 0.92, and was repealed by it, pushing it down significantly. It is now sitting at the 100 day EMA which serves as support.
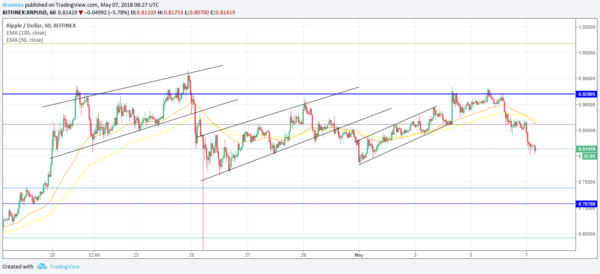
Looking at the hourly chart, we can see that the price is at the same levels as it was at the beginning of the three consecutive upward channels, looking for support.
Hourly chart signals a sell.
Pivot points
S3 0.71843
S2 0.79646
S1 0.83029
P 0.87449
R1 0.90832
R2 0.95252
R3 1.03055
Conclusion
As stated in the last daily update on Friday 4. May, the prices have reached the key resistance levels and were likely going the get repealed by them, as the momentum behind the upward move was starting to get exhausted, which could be seen from price action. That was, in fact, the case. After the surge in price, we are experiencing a first serious pullback in the cryptocurrency market.
©Forex.Academy