
Introduction
BNB/USD is the abbreviation for the cryptocurrency pair Binance coin against the US dollar. This pair is quite volatile to trade compared to coins like Bitcoin, Ether, Ripple, and Litecoin. It has a market capitalization of 2.76B. Because of its volatile nature, this pair is usually traded in cryptocurrency exchanges than forex brokers.
Understanding BNB/USD
The market price of BNB/USD represents the value of the US Dollar equivalent to one Binance coin. It is quoted as 1 BNB per X USD. For example, if the value of BNB/USD is 17.541, then we can say that each Binance coin is worth 17.541 US dollars.
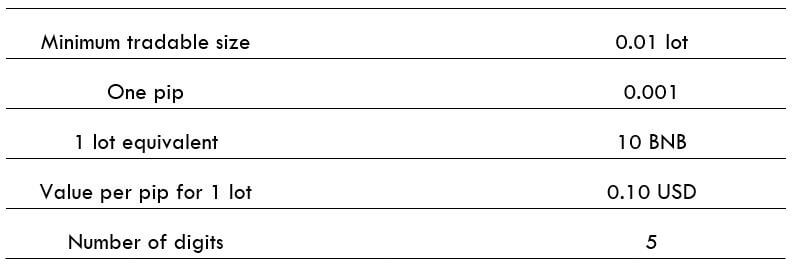
BNB/USD specifications
Spread
Spread is the difference between the bid and the ask price that is set the exchanges. Below are the spread values of the BNB/USD currency pair in both ECN & STP accounts.
ECN: 45 pips | STP: 53 pips
Fee
For every position a trader opens, the broker charges some fee for it. Traders must know that this fee is applicable only on ECN accounts and not on STP accounts.
Slippage
Slippage is the difference between the price required by the trader for execution and the price at which the broker executed the price. There is this difference due to the high market volatility and slower execution speed.
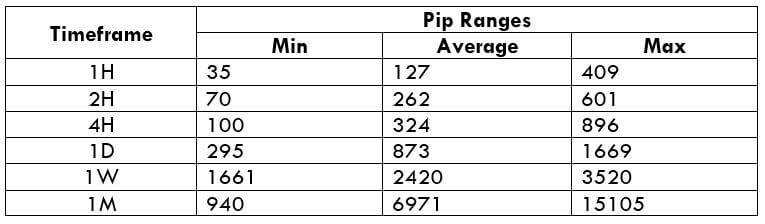
Trading Range in BNB/USD
A trading range is the representation of the volatility in BNB/USD in different timeframes. The values are extracted from the Average True Range indicator. One may use the table as a risk management tool as it determines the profit/loss that a trader is possessed towards.
Procedure to assess Pip Ranges
- Add the ATR indicator to your chart
- Set the period to 1
- Add a 200-period SMA to this indicator
- Shrink the chart so you can assess a large time period
- Select your desired timeframe
- Measure the floor level and set this value as the min
- Measure the level of the 200-period SMA and set this as the average
- Measure the peak levels and set this as Max.
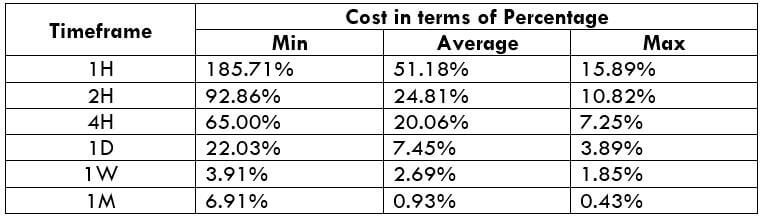
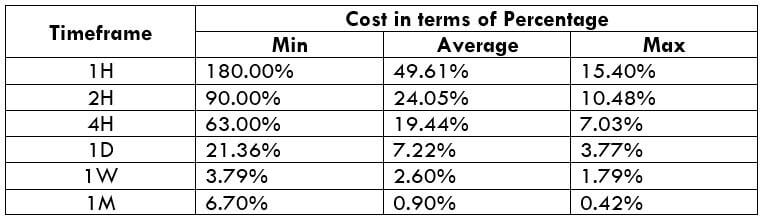
BNB/USD Cost as a Percent of the Trading Range
The total cost of the trade varies based on the volatility of the market. So, we must figure out the times when the costs are less to position ourselves in the market. Below is a table representing the variation in the costs based on the change in the volatility of the market.
Note: The percentage values only depict the relative magnitude of costs and not the actual costs on the trade.
ECN Model Account
Spread = 45 | Slippage = 10 |Trading fee = 10
Total cost = Slippage + Spread + Trading Fee = 10 + 45 + 10 = 65
STP Model Account
Spread = 53 | Slippage = 10 | Trading fee = 0
Total cost = Slippage + Spread + Trading Fee = 10 + 53 + 0 = 63
Trading the BNB/USD
Volatility and Cost are the two factors traders take into account for trading any security in the market. With the assistance of the above tables, let’s analyze these two factors to ideally trade the BNB/USD.
Volatility
In every timeframe, we can see that the pip difference is significantly high between the minimum volatility and the average volatility. As a day trader, our aim is to make money from the movement of the market. But, if there is hardly any movement in the price, then it becomes challenging to extract some money out from the market. Hence, it is ideal to trade when the volatility is at least at the average value.
Cost
The cost increases as the volatility decrease. They are inverse to each other. In other terms, highly volatile markets have the least costs. However, it is quite risky to trade markets with extreme volatility though the costs are low. Hence, to maintain a balance between the cost and volatility, traders may find trading opportunities when the volatility is around the average values or a little above it.
Bonus
Traders can also bring down their total costs by placing orders as ‘limit’ instead of ‘market.’ This will entirely cut the slippage on the trade and therefore reduce the total cost. In the above example, the total cost would decrease by ten pips, which quite a decent reduction for just changing the type of order execution.