Introduction
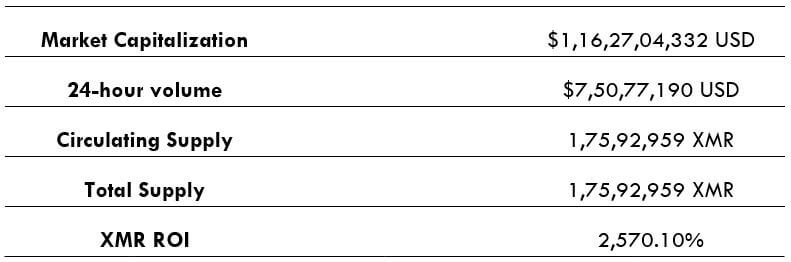
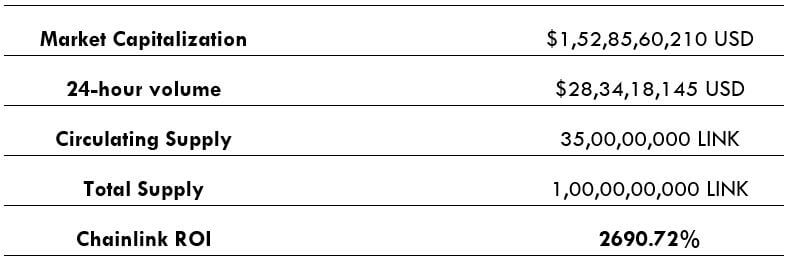
Chainlink is a decentralized oracle network whose purpose is to connect smart contracts with the real world. LINK is its native digital currency, which is used to node operators on the Chainlink decentralized oracle network. LINK has a market capitalization of $1.5 billion and stands 14th on CoinMarketCap. LINK can be bought using fiat currency as well as traded against other cryptocurrencies like BTC and ETH.
Understanding LINK/USD
The price of LINK/USD depicts the value of the US Dollar equivalent to one Chainlink. It is quoted as 1 LINK per X USD. For example, if the market price of LINK/USD is 4.36166, then each LINK will be worth so many dollars.
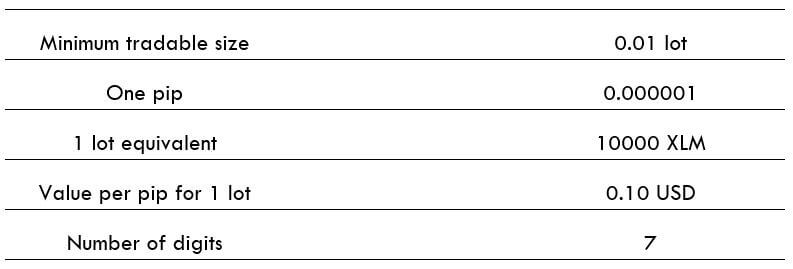
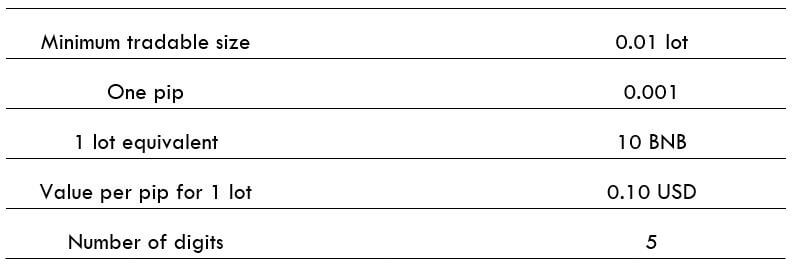
LINK/USD specifications
Spread
Spread is nothing but the arithmetic difference between the buying and selling price of the cryptocurrency. Unlike forex brokers, these prices are decided by the traders and not the exchange. Hence, the spread constantly varies in exchange as well as across exchanges.
Fee
Typically, there are three types of the fee charged by exchanges including
- Execution fee (Taker or Maker) – twice, for opening and closing the trade
- 30-day trading volume fee
- Margin opening fee, if applicable
Example
- Long 1,000 LINK/USD at $4.45509
- 30-day volume fee is $0
- Order is executed as Taker
- With Leverage
Total cost of the order = 1,000 x $4.45509 = $4455.09
Assuming the taker fee to be 0.26%, the opening fee will be – $4455.09 x 0.26% = $11.58
The margin opening fee of 0.02% is charged for opening the position using leverage – $4455.09 x 0.02% = $0.89
If the order is closed at $4.50000, the total cost of closing will be – 1,000 x $4.50000 = $4500.00. And the fee for closing will turn to be – $4500.00 x 0.26% = $11.70
Thus, the total fee will be the sum of all the fees – $11.58 + $0.89 + $11.70 = $24.17
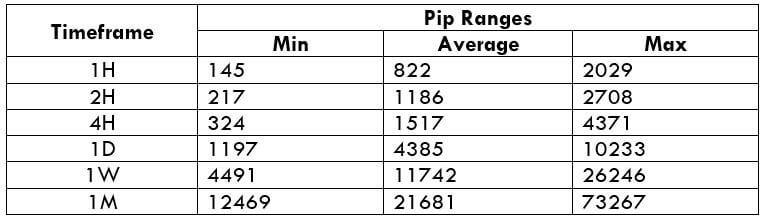
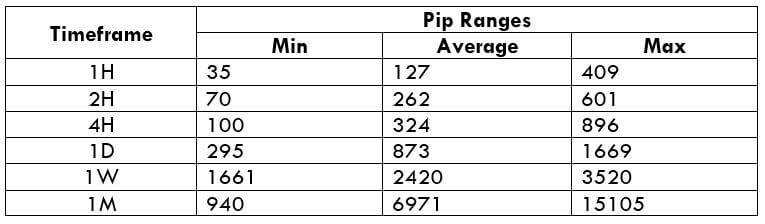
Trading Range in LINK/USD
Chainlink is traded in cryptocurrency exchanges and not forex brokers. So, there is no concept of pip and pip value. Instead, the value of the crypto is directly taken into account.
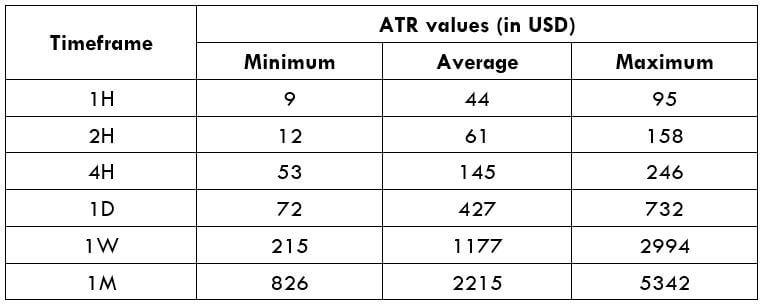
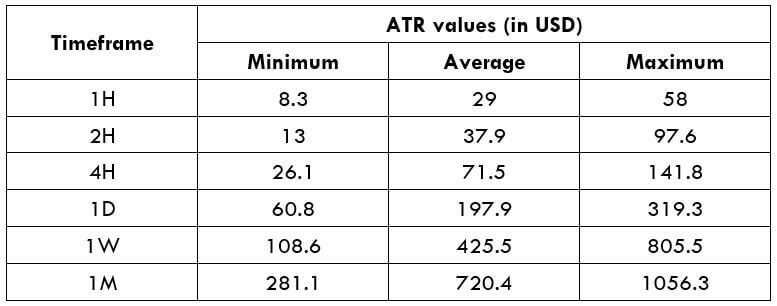
A trading range is the tabular representation of the approximate value movement of the pair, which is obtained through the Average True Range (ATR) indicator. In layman terms, the numbers in the table depict the amount of US dollars a trader will gain or lose in a given time frame. The following table shows the value of the price movement for 1,000 quantities LINK/USD.
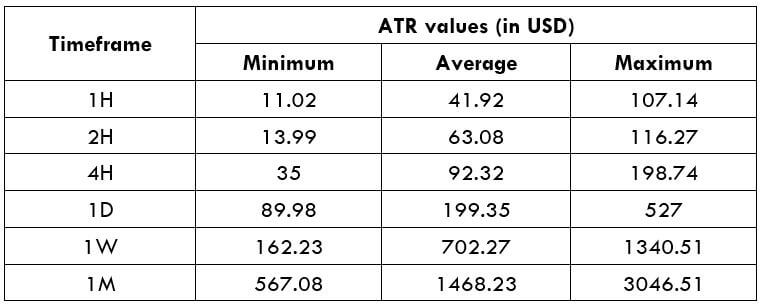
Note: the above values are for trading 1,000 units of LINK/USD. If X units of the pair are traded, then the ATR values will be,
(ATR value from the table / 1,000) x X units
Procedure to assess ATR values
- Add the ATR indicator to your chart.
- Set the period to 1
- Add a 200-period SMA to this indicator.
- Shrink the chart so you can assess an extensive period
- Select your desired timeframe
- Measure the floor level and set this value as the min
- Measure the level of the 200-period SMA and set this as the average
- Measure the peak levels and set this as Max.
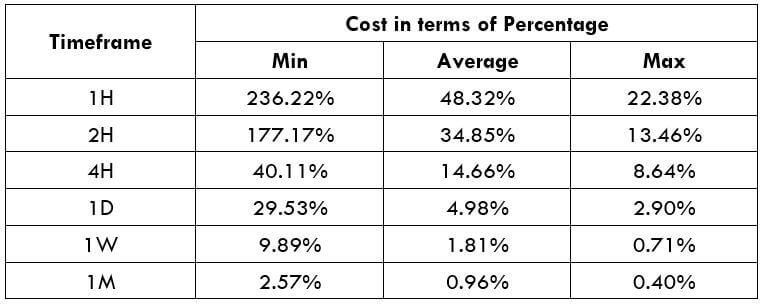
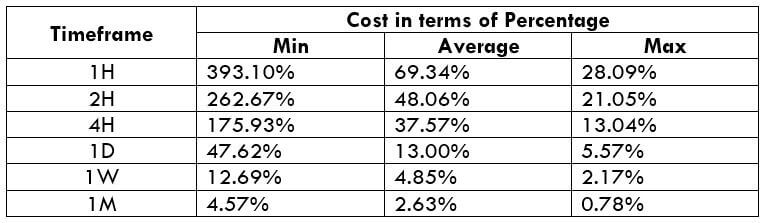
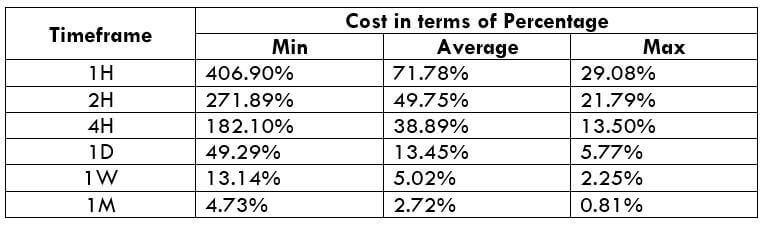
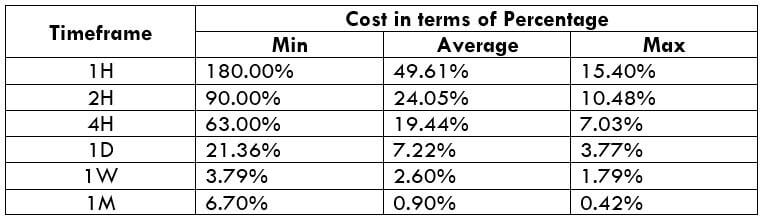
LINK/USD Cost as a Percent of the Trading Range
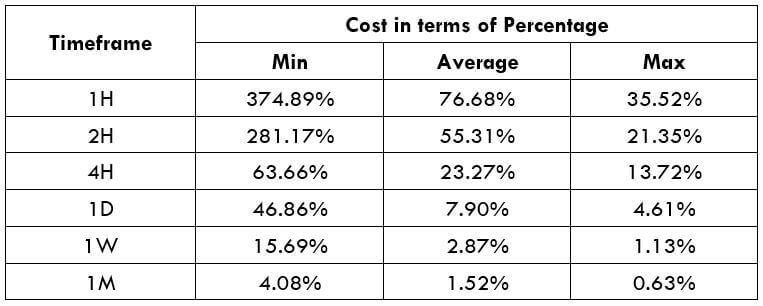
Below are two tables representing cost variations for different time frames in terms of a percentage for taker execution and maker execution.
Taker Execution Model
Opening = $11.58 | Margin fee = $0.89 | Closing = $11.70 | 30-day volume = $0
Total fee = Opening + Margin fee + Closing + 30-day volume = $11.58 + $0.89 + $11.70 + $0 = $24.17
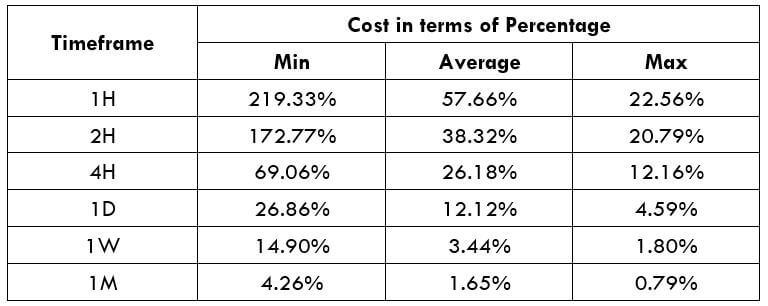
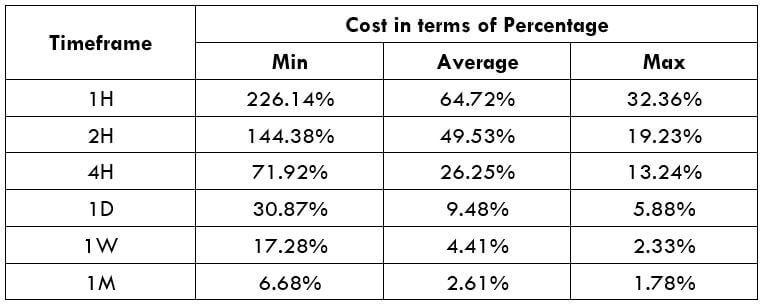
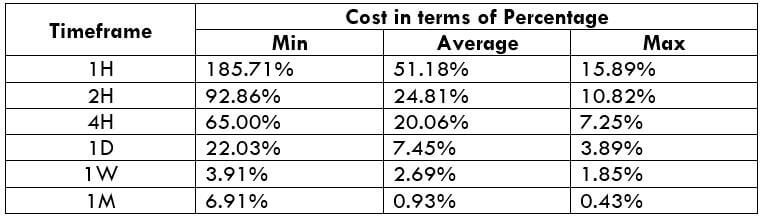
Maker Execution Model
Opening = $7.12 | Margin fee = $0.89 | Closing = $7.2 | 30-day volume = $0
Total fee = Opening + Margin fee + Closing + 30-day volume = $7.12 + $0.89 + $7.2 + $0 = $15.21
*Assuming maker fee to be 0.16% the trade value.
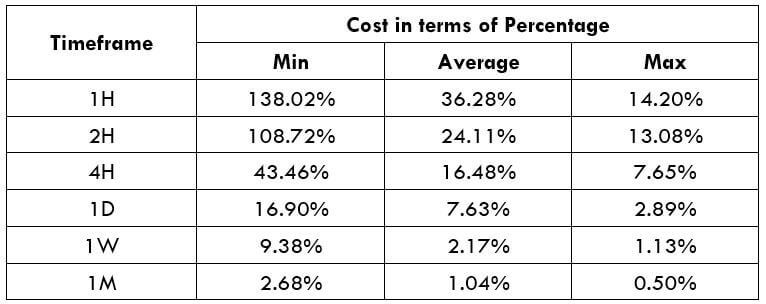
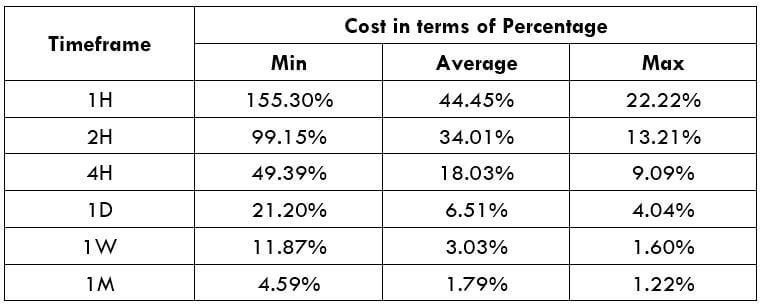
Interpretation of Cost as a Percent of the Trading Range
Let us directly understand the table with an example.
1H time frame
ATR value = 41.92
Cost percentage = 57.66%
4H time frame
ATR value = 92.32
Cost percentage = 26.18%
Comparing ATR values, we infer that more profit can be generated in the 4H time frame ($92.32) than in the 1H time frame ($41.92). But, a critical point to note is that the cost is the same for both the trades. A fee that is paid to gain $92.32, the equal fee must be paid to gain $41.92. This difference is represented using the cost percentage. Thus, the percentage in the 1H time frame is higher than that in the 4H time frame, indicating that the relative costs are higher.
Trading the LINK/USD
LINK can be traded against USD and few cryptocurrencies as well. However, LINK/USD is seen to have the highest trading volume. Comparing the liquidity with other cryptocurrency pairs like BTC/USD, ETH/USD, and XRP/USD, LINK/USD is less liquid.
From the above comprehension of the cost percentage, we understood that the costs remain the same irrespective of the time frame you trade. Thus, to relatively reduce the costs, we must focus on the columns of the table. The effective way to trade this pair is to enter the market when the volatility is at or above the average values. For example, if you are a day trader who trades the 1H time frame, you must make sure that the volatility is above the average level. In doing so, you will be able to extract more from the market for the same total fee. Cheers!