
Introduction
XLM is the abbreviation for Stellar. This cryptocurrency was founded in 2014 by Jed McCaleb. Stellar is also a payment technology that was created mainly to connect financial institutions and reduce the costs for cross-border transfers.

Stellar is actively traded in the market against fiat currencies and other cryptocurrencies. In this article, we shall be analyzing Stellar against the US dollar, abbreviated as XLM/USD.
Understanding XLM/USD
The price of XLM/USD depicts the value of the US Dollar that is equivalent to one Stellar. It is quoted as 1 XLM per X USD. For example, if the value of XLM/USD is 0.073264, then each stellar is worth 0.073264 US dollars.
Note: The price is considered from coinbase exchange.
XLM/USD Specifications
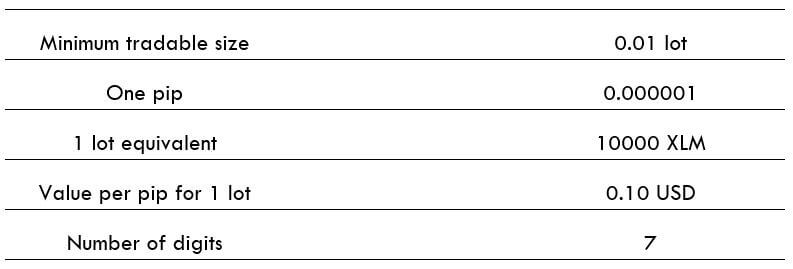
Spread
It is the athematic difference between the bid and the ask price managed by exchanges. It varies based on the type of execution model used by exchanges.
Spread on ECN: 450 pips
Spread on STP: 520 pips
Fee
A Fee is nothing but the commission on the trade. It is charged only on ECN accounts, and there is no fee on STP accounts.
Slippage
The difference between the trader’s intended price and the broker’s executed price is called slippage. It varies based on the volatility of the market and the exchange’s execution speed.
Trading Range in XLM/USD
The trading range is simply the illustration of the pip movement in a pair for different timeframes. With these values, a trader will know how long they have to wait for their trade to perform. Also, they can calculate approximate profit/loss on a trade beforehand.
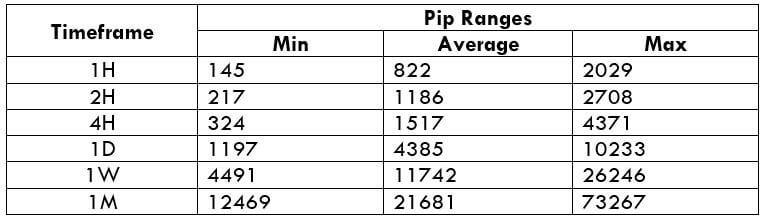
Procedure to assess Pip Ranges
- Add the ATR indicator to your chart
- Set the period to 1
- Add a 200-period SMA to this indicator
- Shrink the chart so you can assess a large time period
- Select your desired timeframe
- Measure the floor level and set this value as the min
- Measure the level of the 200-period SMA and set this as the average
- Measure the peak levels and set this as Max.
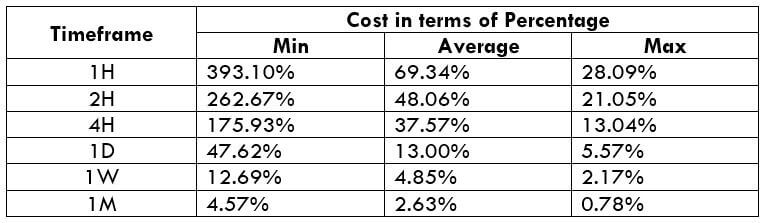
XLM/USD Cost as a Percent of the Trading Range
The following tables represent the total cost variations for ECN and STP accounts. It represents how the costs vary with the change in volatility.
ECN Model Account
Spread = 450 | Slippage = 70 |Trading fee = 50
Total cost = Slippage + Spread + Trading Fee = 70 + 450 + 50 = 570
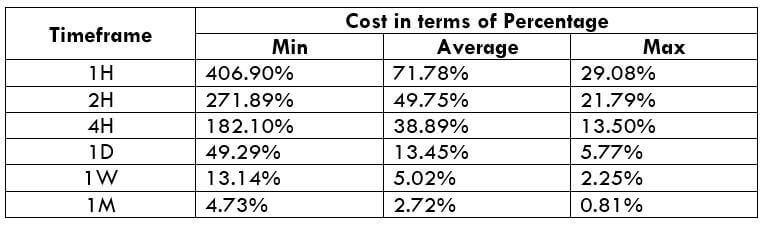
STP Model Account
Spread = 520 | Slippage = 70 | Trading fee = 0
Total cost = Slippage + Spread + Trading Fee = 70 + 520 + 0 = 590
Trading the XLM/USD
It is a known fact that cryptocurrency is a 24-hour market and is traded even during the weekend. However, this does not mean we can enter any time to pull out a trade from it. Though many traders do this, it is not a professional approach. Using the volatility and cost variation values, we can determine the ideal times to trade this pair.
The pip values seem to look really large, but it doesn’t indicate high volatility. This pair is as volatile as other major cryptocurrencies. From the cost table, it can be ascertained that the values are large for lower volatilities that decease as the volatility increases. So, traders who are concerned with high costs can trade during the times when the volatility high. However, they must be cautious about the risk involved in it. On the other hand, traders who wish to have an equilibrium between the two, then they may trade when the volatility is around the average values.
Furthermore, trading via limit and stop orders also reduces costs by a good number. In doing so, the slippage will be taken off of the total costs. So, in our example, the total cost would reduce by 70, which is quite a decent reduction.