Introduction
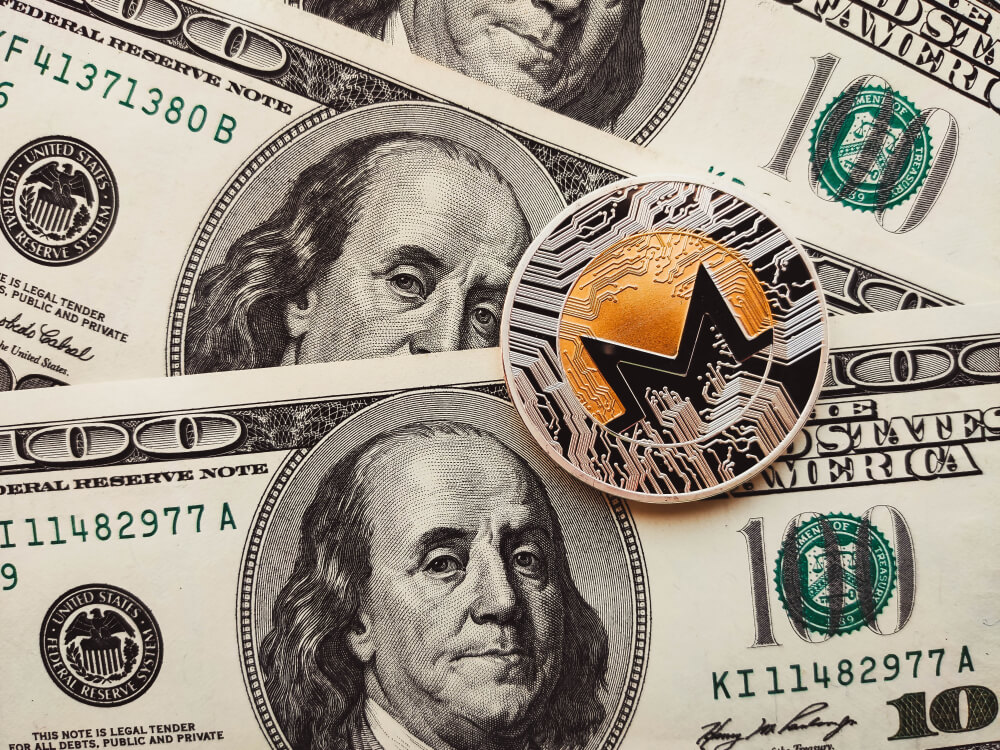
Monero is a private and secure cryptocurrency that was launched 18th of April 2014 as a fork of ByteCoin. It is an open-source digital currency built on a blockchain, making it opaque. With Monero, the holder will have full control over their investment and funds, and nobody will have access to their balance and transactions.
Monero is traded in exchanges under the ticker XMR. It is under the top 20 in terms of market capitalization according to data from CoinMarketCap. It can be traded against USD as well as for cryptocurrencies Bitcoin, Ethereum, Tether, etc.
Understanding XMR/USD
The price of XMR/USD depicts the value of the US Dollar equivalent to one Monero. It is quoted as 1 XMR per X USD. For example, if the market price of XMR/USD is 64.67, then each XMR will be worth about 65 dollars.
XMR/USD specifications

Spread
Spread is the basic difference between the bid and the ask price of the cryptocurrency. These prices are put up by the clients and not exchange. Thus, the spread constantly varies in and across exchanges.
Fee
The types of fees in cryptocurrency exchanges vary from that of equity broker and forex brokers. Most crypto exchanges charge the following fees:
- Execution fee (Taker or Maker) – twice, for opening and closing the trade
- 30-day trading volume fee
- Margin opening fee, if applicable
Example
- Short 100 XMR/USD at $64.82
- 30-day volume fee is $0
- Order is executed as Taker
- With Leverage
Total cost of the order = 100 x $64.82 = $6482
Assuming the taker fee to be 0.26%, the opening fee will be – $6482 x 0.26% = $16.85
Since the trade is opened with leverage, there is 0.02% of margin opening fee collected – $6482 x 0.02% = $1.29
If the position is squared off at $60.00, the total cost of closing will be – 100 x $60.00 = $6000. The fee for the same can be calculated as – $6000 x 0.26% = $15.60
The algebraic sum of all the fee will yield the total fee as –
$16.85 + $1.29 + $15.60 = $33.74
Trading Range in XMR/USD
A trading range is the number of units the cryptocurrency pair moves in a specific time frame, represented in US dollars as the quote currency for the pair is USD. The values basically depict the volatility in different time frames.
The following table is the trading range for 100 quantities of XMR/USD.

Note: the above values are for trading 100 units of XMR/USD. If X units of the pair are traded, then the ATR values will be,
(ATR value from the table / 1,000) x X units
Procedure to assess ATR values
- Add the ATR indicator to your chart.
- Set the period to 1
- Add a 200-period SMA to this indicator.
- Shrink the chart so you can assess a large time period
- Select your desired timeframe
- Measure the floor level and set this value as the min
- Measure the level of the 200-period SMA and set this as the average
- Measure the peak levels and set this as Max.
XMR/USD Cost as a Percent of the Trading Range
This cost as a percent represents relative the fee on the trade by considering the volatility and time frames. The percentage values are calculated by finding the ratio of each ATR value and the total fee.
Taker Execution Model
Opening = $16.85 | Margin fee = $1.29 | Closing = $15.60 | 30-day volume = $0
Total fee = Opening + Margin fee + Closing + 30-day volume = $16.85 + $1.29 + $15.60 = $33.74

Maker Execution Model
Opening = $10.37 | Margin fee = $1.29 | Closing = $9.6 | 30-day volume = $0
Total fee = Opening + Margin fee + Closing + 30-day volume = $10.37 + $1.29 + $9.6 + $0 = $21.26
*Assuming maker fee to be 0.16% the trade value.

Trading the XMR/USD
XMR is ranked 16 in market capitalization with a denominator over a thousand. It offers enough liquidity and volume for retail traders to participate in this pair. However, it is comparatively lesser than coins like Bitcoin, Ethereum, Ripple, Bitcoin Cash, etc.
As far as the analysis for this pair is concerned, it is no different from analyzing other cryptocurrencies and forex pairs. Hence, you can confidently apply those concepts in Monero as well.
The cost percentages in the above tables represent how expensive or cheap trade is going to be based on the profit you make or the loss you incur. The larger the percentage, the higher is the fee. Note that we are referring to the relative fee, not the absolute fee. Irrespective of the time frame and volatility, the fee will be the same but will vary relatively. For example, a short-term trader who makes $50 on trade must pay the same fee as a long-term trader who makes $1000.
Thus, to effectively reduce your relative costs, you must understand the volatility of the market. The concept is simple; one can make money only if there is enough movement in the market. Thus, before taking a trade, you must know the current volatility of the market using the ATR indicator. If the values are above the average, then you’re good to go. But, values near the minimum value indicates that there is not much movement in the market, and it could not reach your target point within the expected time.


