The cryptocurrency markets are trying to find a balance point to consolidate at. After Bitcoin’s spike upwards above $8,000, other cryptocurrencies quickly followed. However, after reaching the RSI oversold territories, almost every one of the top cryptocurrencies declined in order to consolidate. Bitcoin has lost 0.37% on the day, while Ethereum went up by 0.33% and XRP by 0.79%. Out of the top10 cryptocurrencies by market capitalization, only Binance Coin and Stellar are in the green, besides Ethereum as mentioned earlier and XRP.
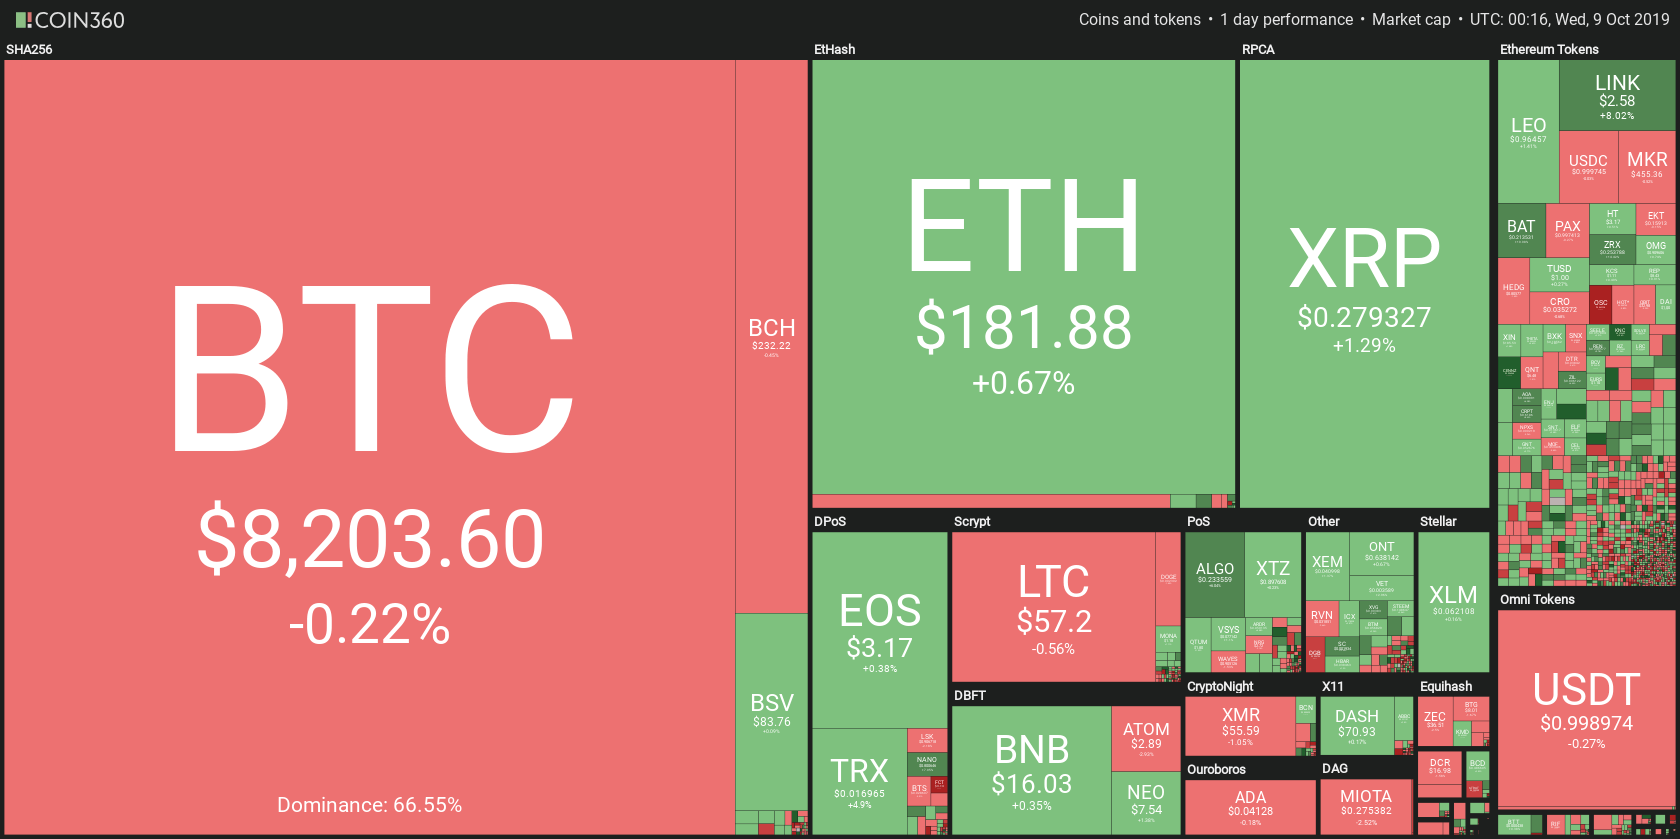
Figure 1- Heat Map of the crypto sector
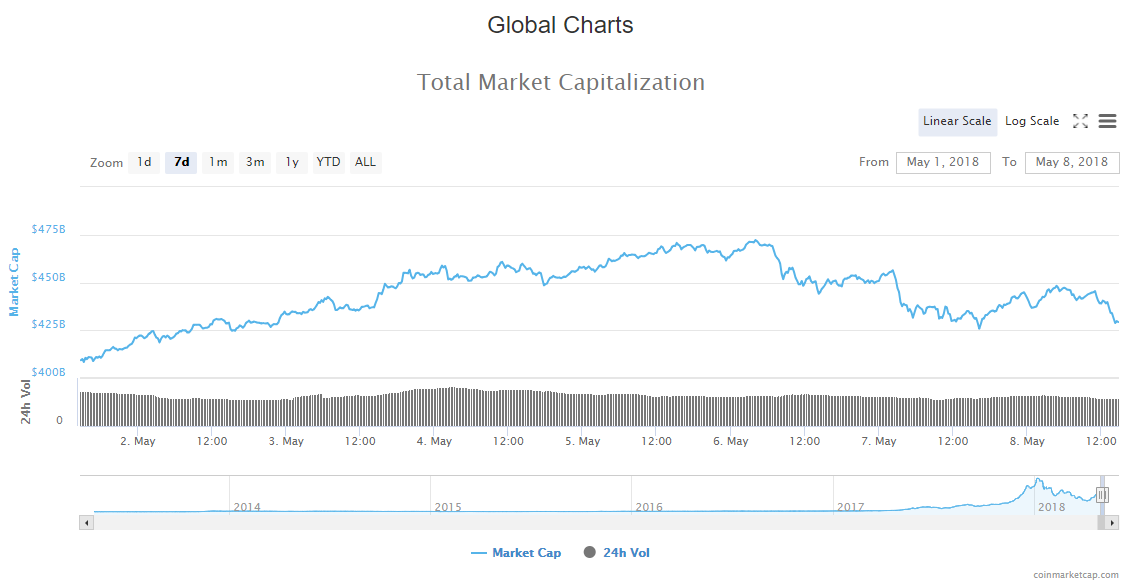
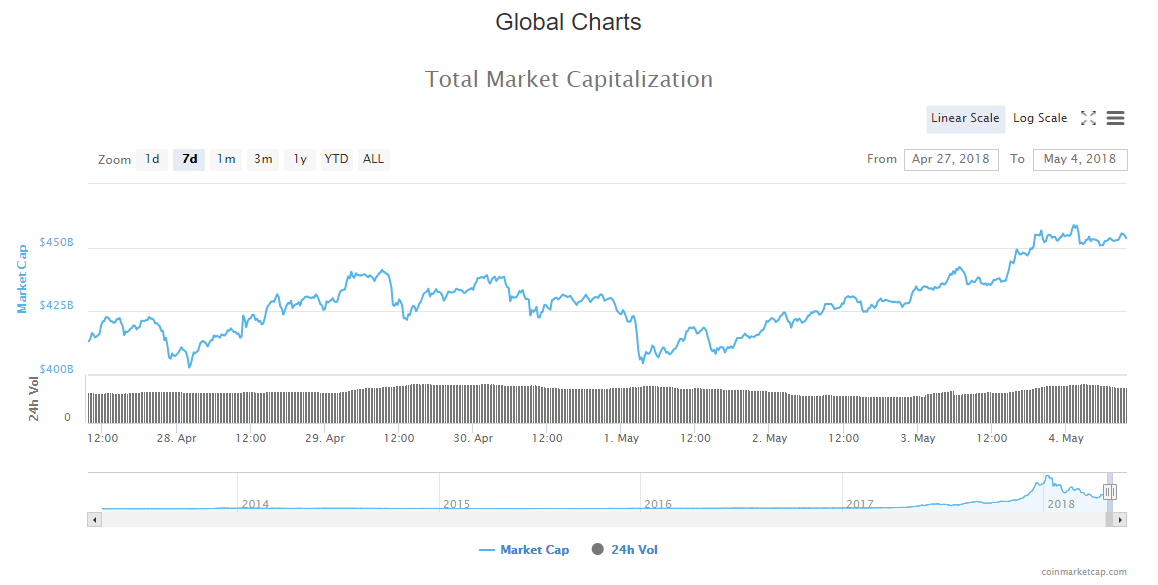
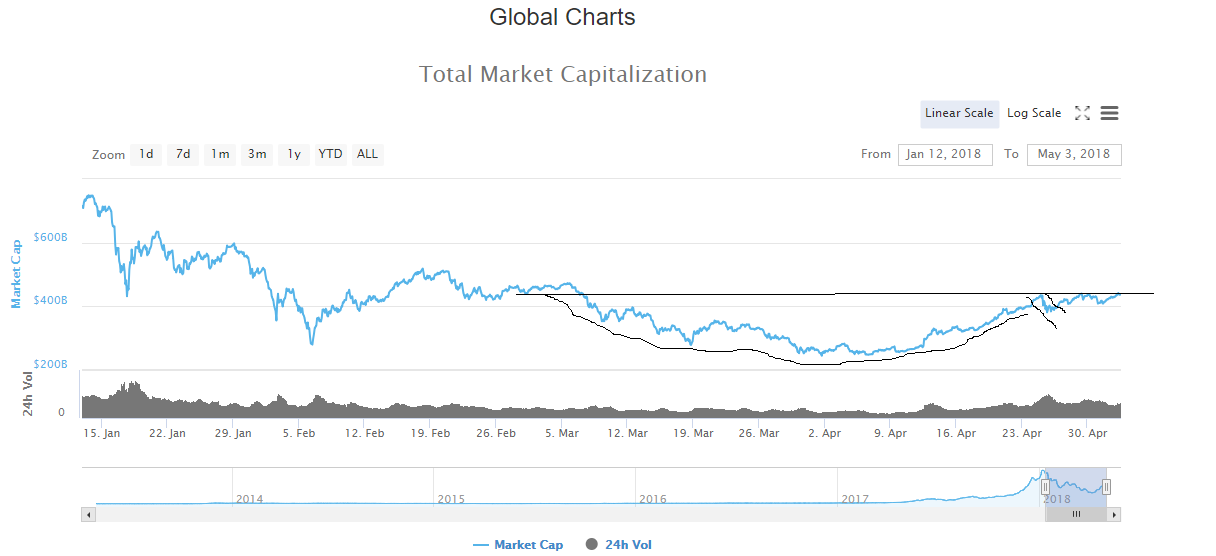
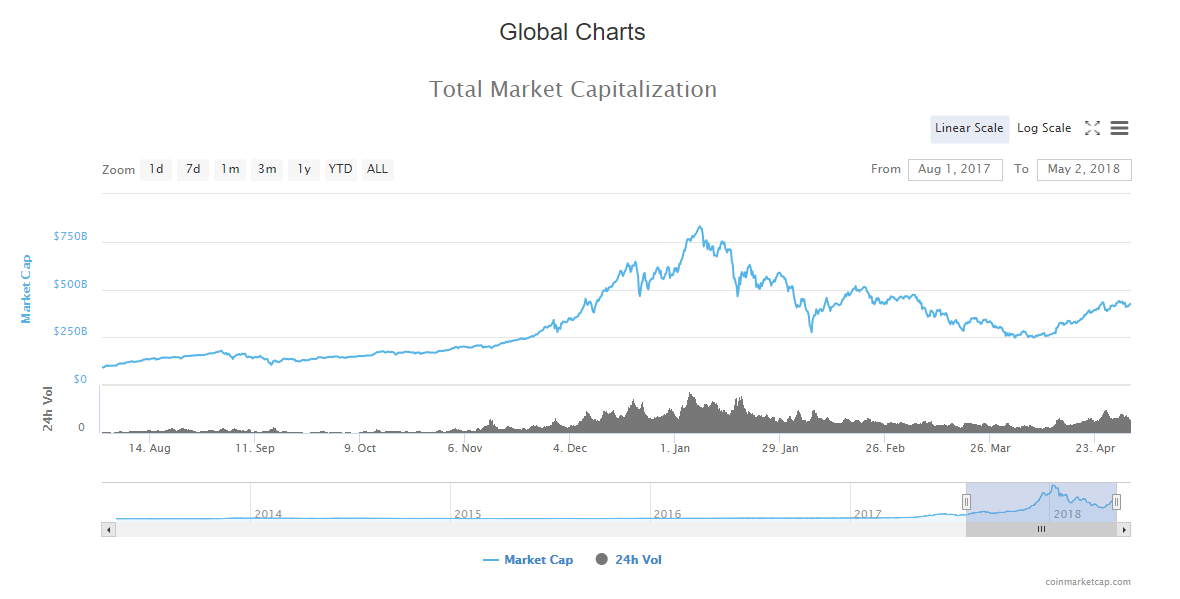
When it comes to the Bitcoin dominance in the cryptocurrency sector, altcoins are getting slight momentum. However, Bitcoin is only losing fractions of a percent of market dominance. The market capitalization of the crypto markets increased by around $200 million over the past 24 hours and is now standing at $222.86 billion.
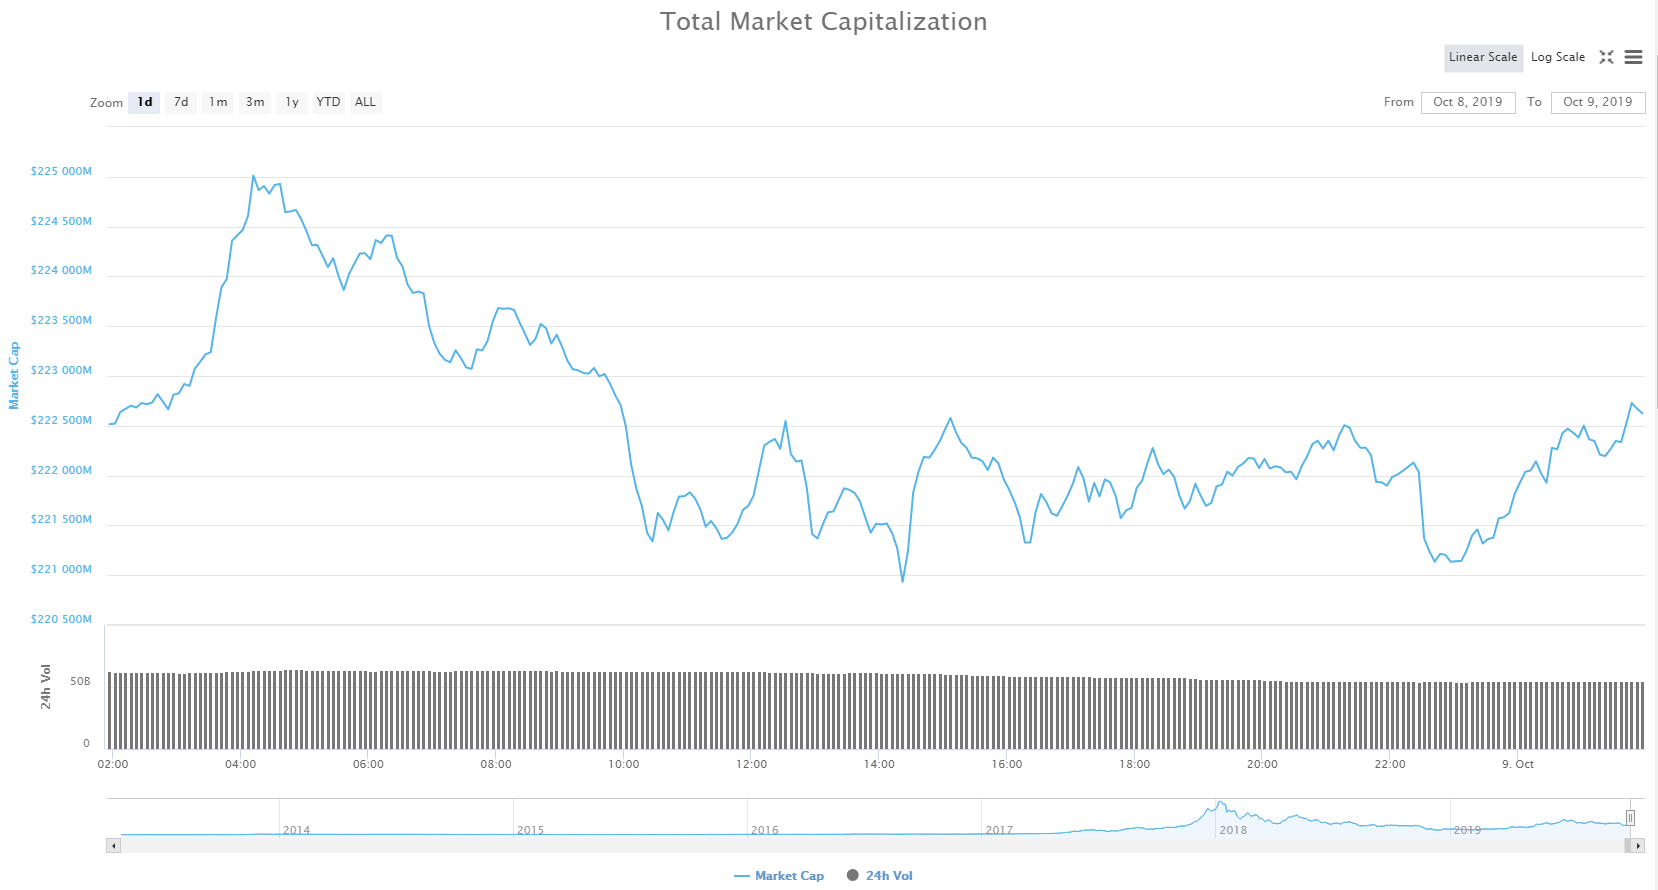
Figure 2- 24H market capitalization and Traded Volume
What happened in the past 24 hours
Cryptocurrency markets have had a great upwards boost fueled by Bitcoin’s price, not falling below the $7,700 support line. This move alone made the cryptocurrency market thrive for a moment or two. However, as the momentum dies down, prices need to find equilibrium and a place to consolidate, which is precisely what is happening right now. Where the cryptocurrencies will consolidate and how far will they drop from their recent highs will be shown in the next couple of days.
Technical analysis
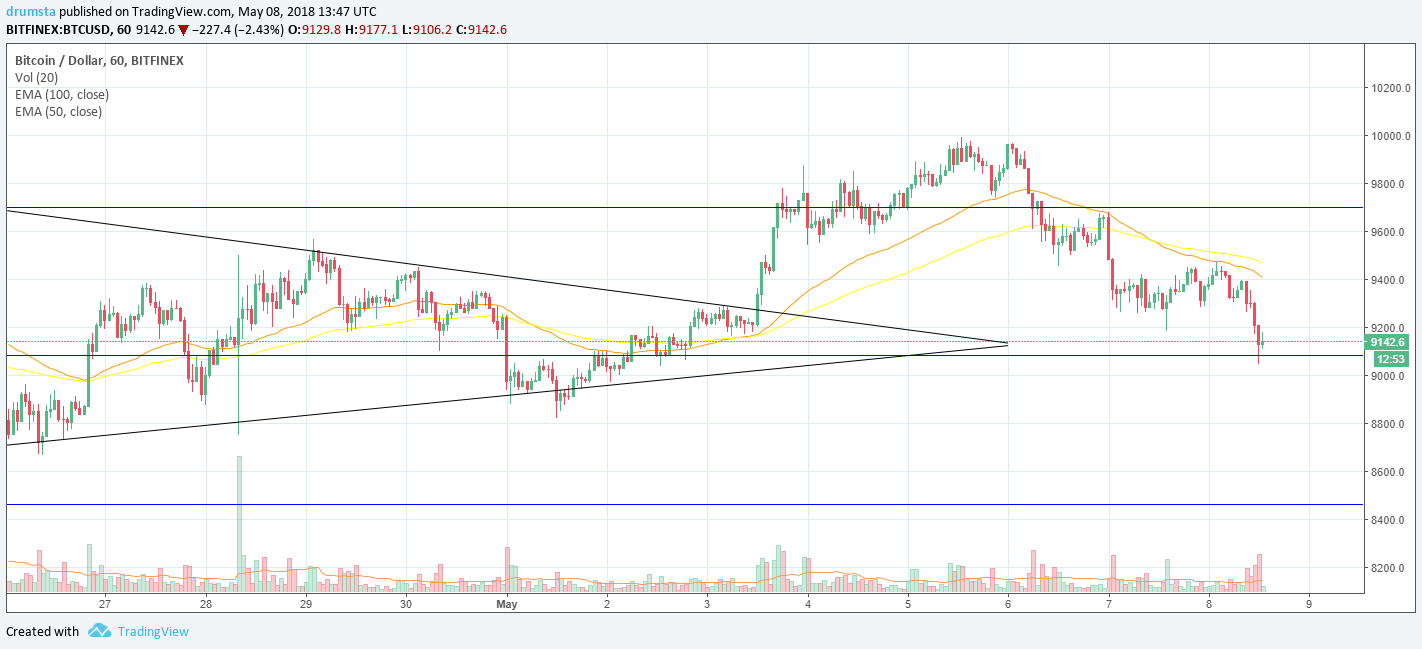
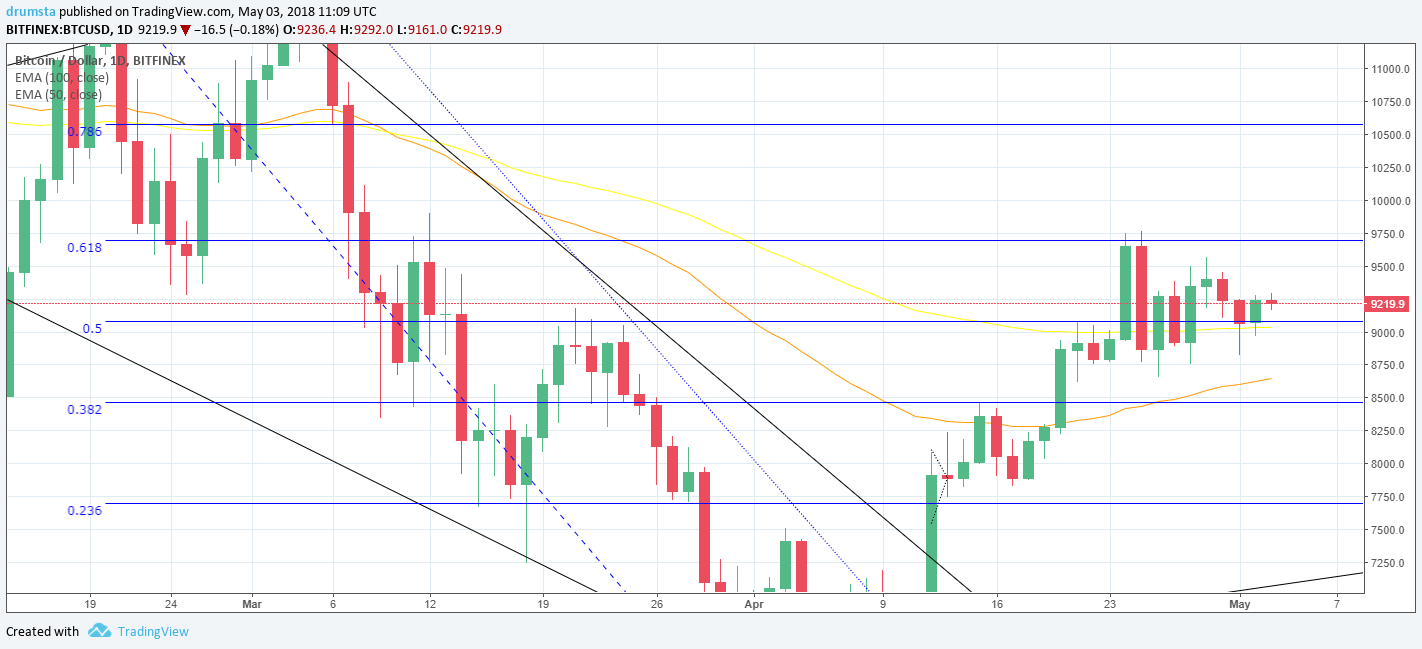
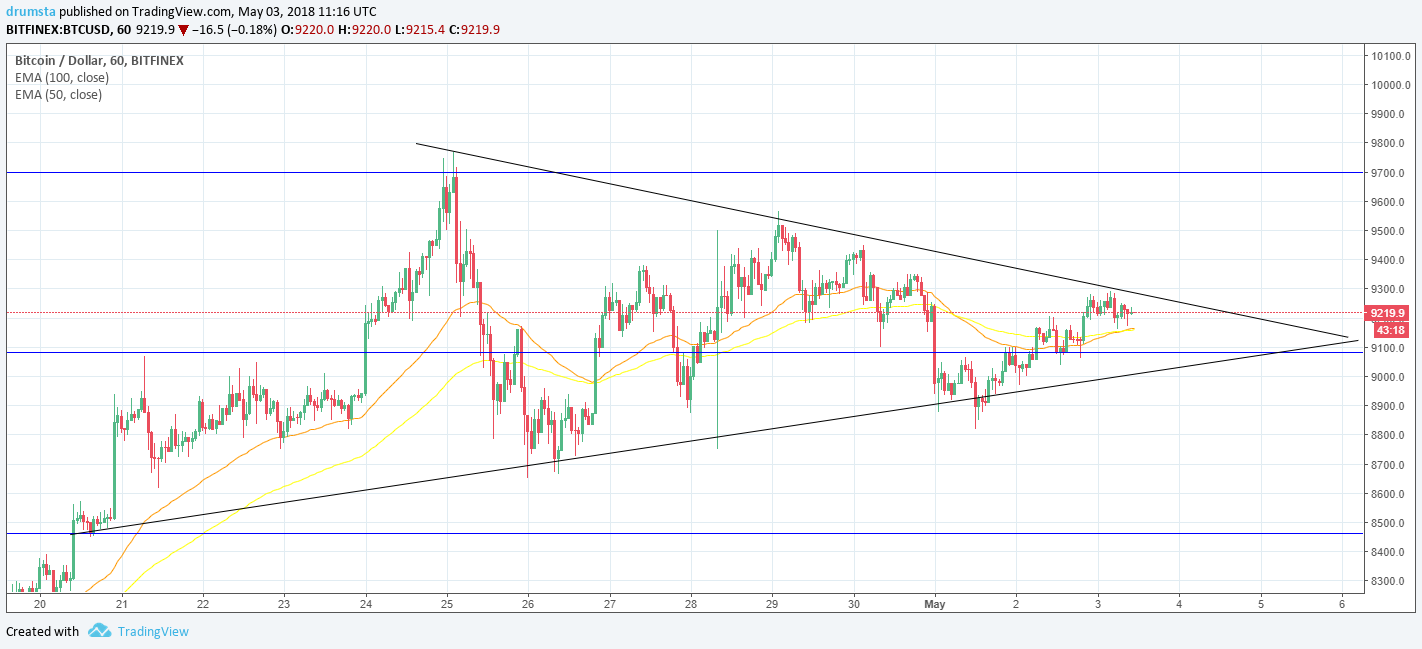
Bitcoin
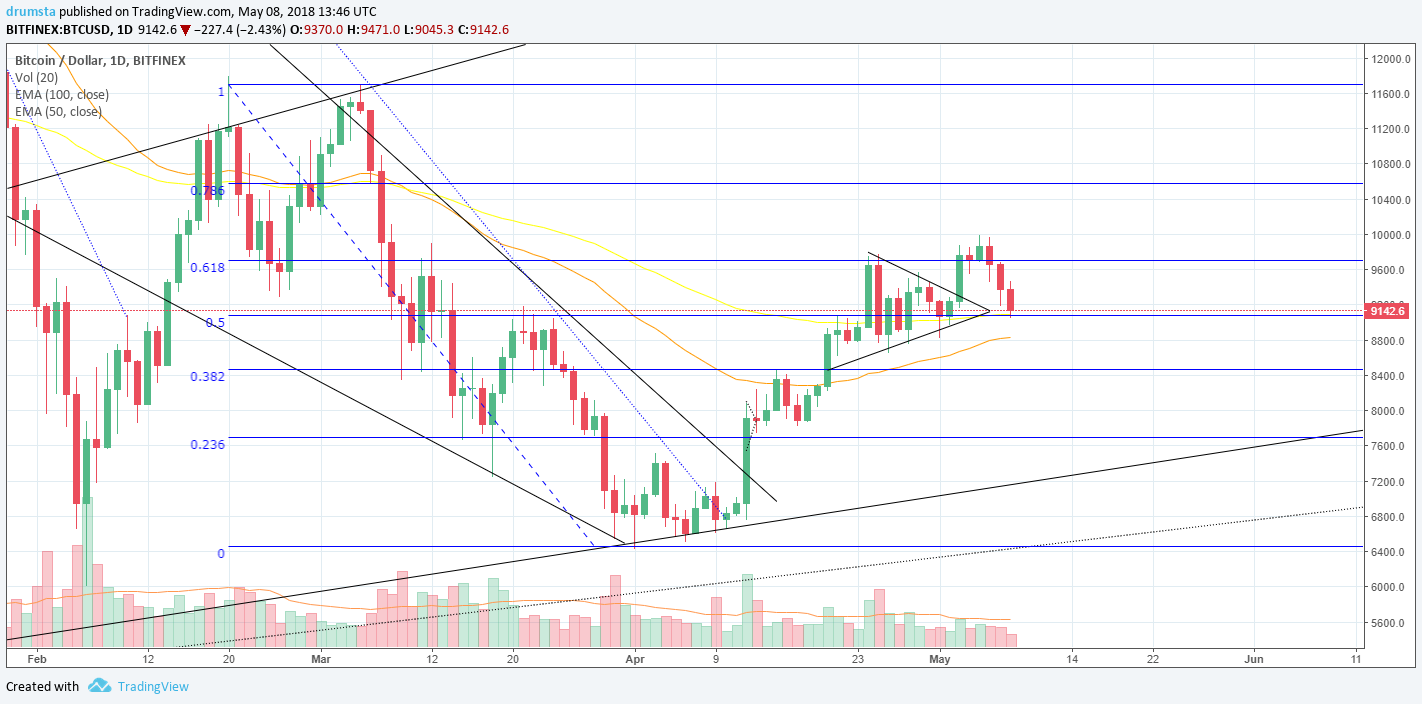
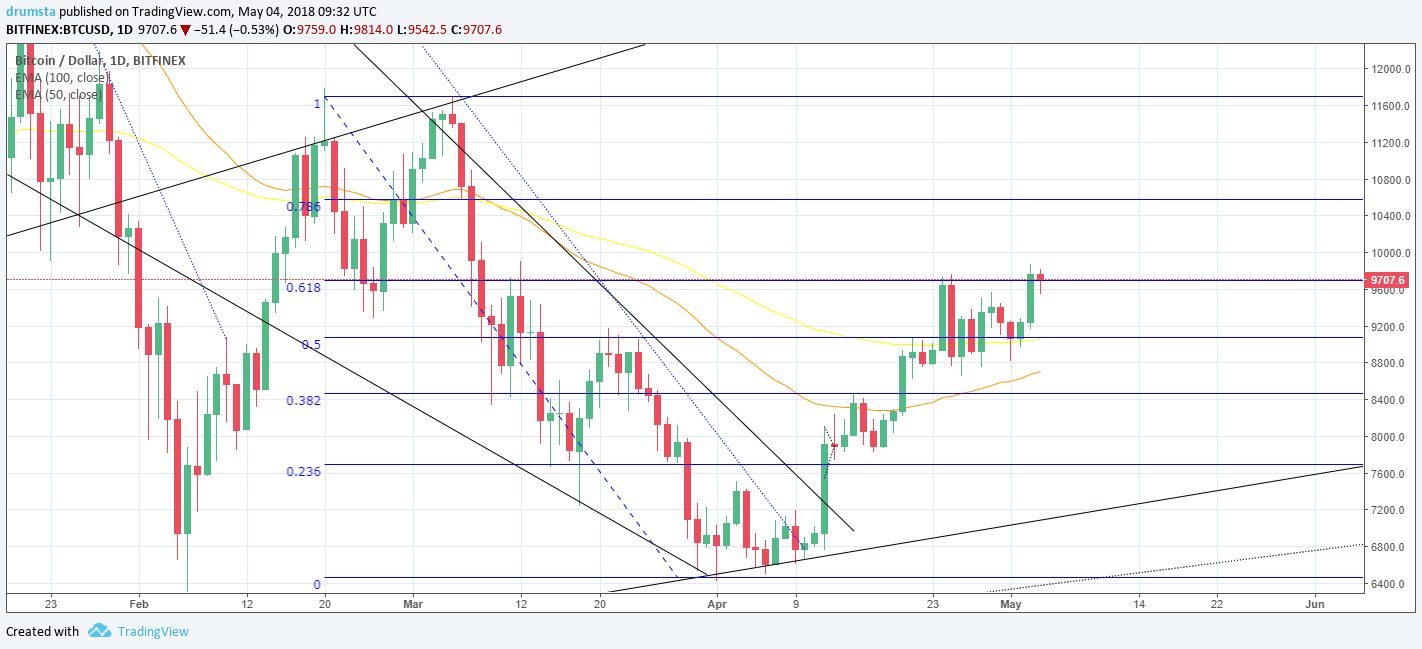
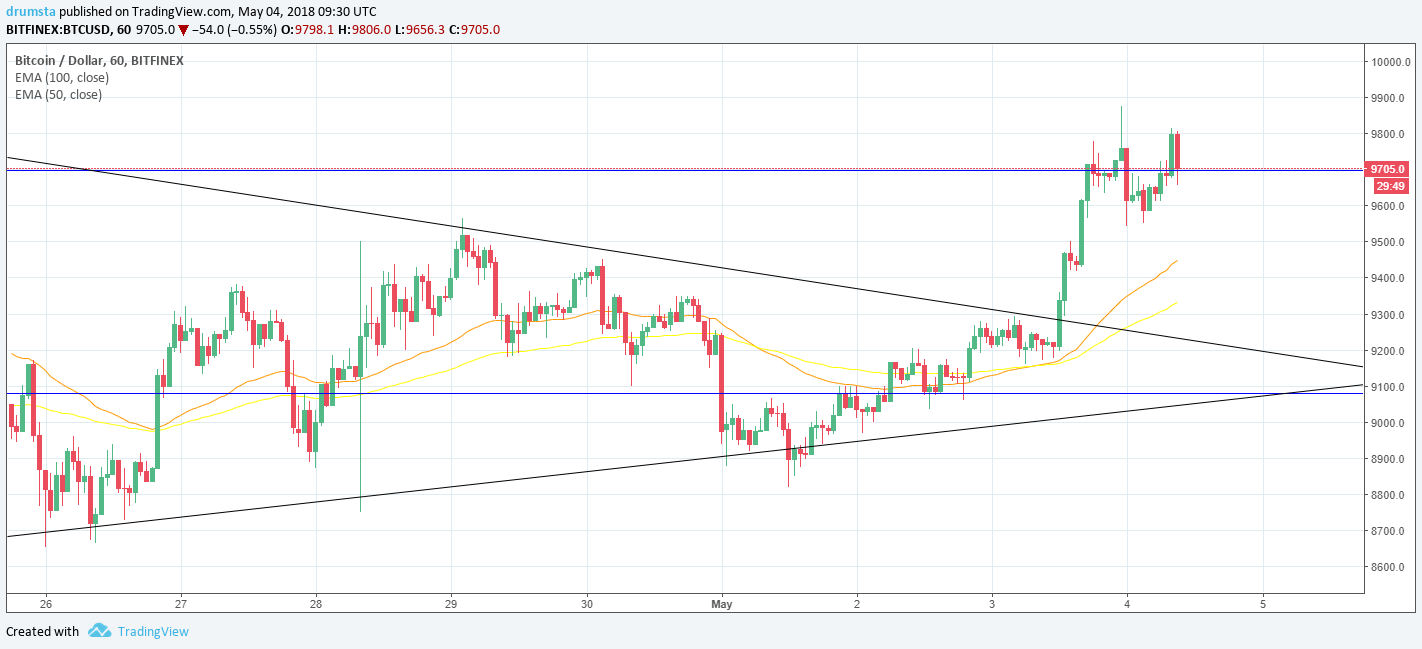
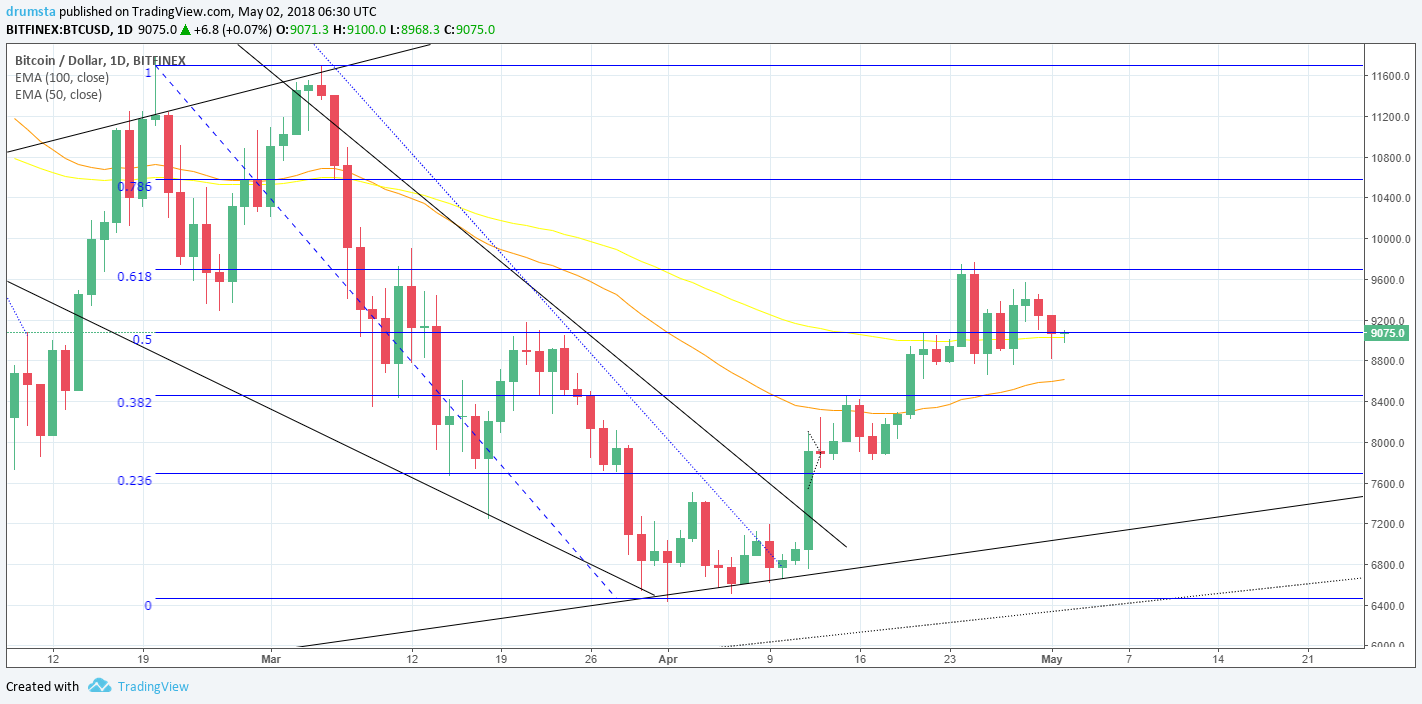
After reaching the price of $8,350, Bitcoin started to show signs of a possible retracement. RSI reaching overbought territory further proved the case. Even though Bitcoin did not retrace much yet, it kept making lower highs as well as lower lows throughout the day. At one point, price broke the 38,2% Fib retracement line downwards but quickly recovered. At the moment, Bitcoin is trying to move above the 23,6% Fib retracement line, which sits at $8217, but the upward momentum is not strong enough, and the price keeps getting rejected.
If we take a look at the volume, we can see that there has been no rise at all. The volume is stagnant and low, which further proves the point of a consolidation being at play here.
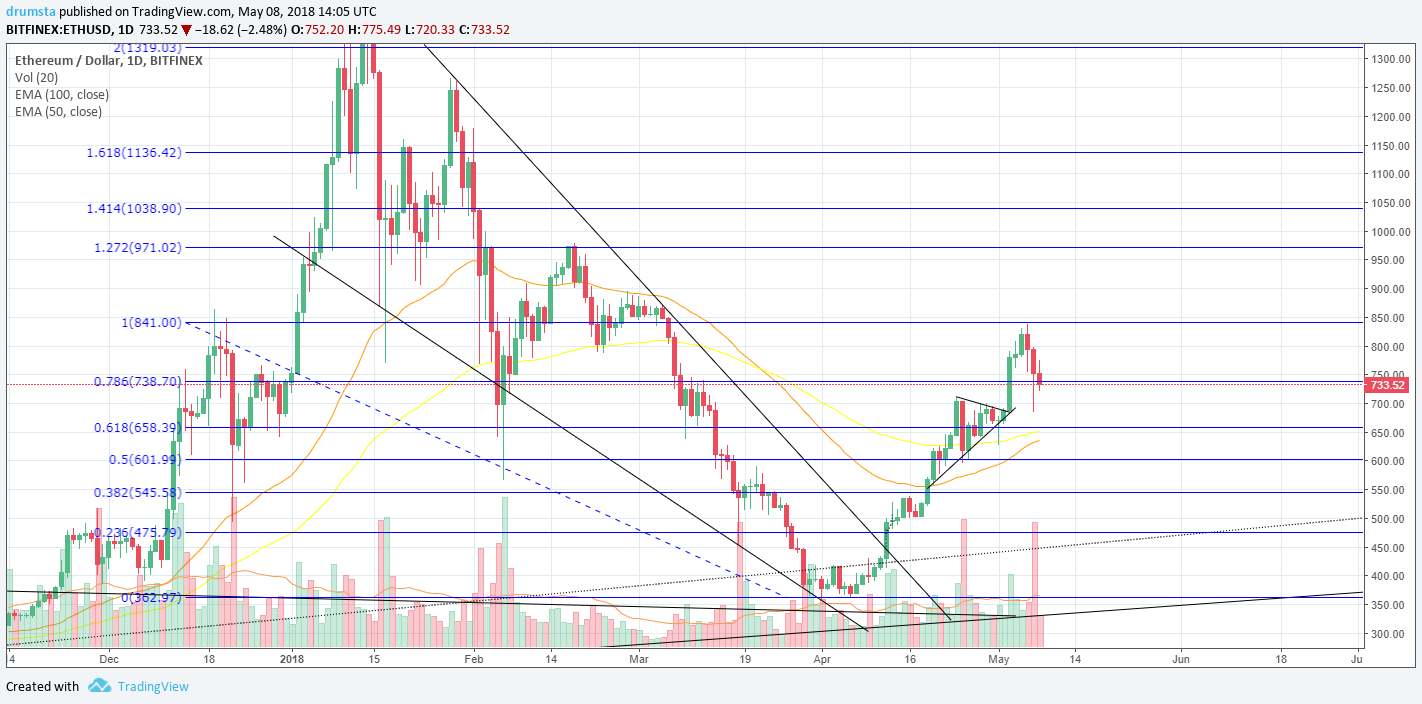
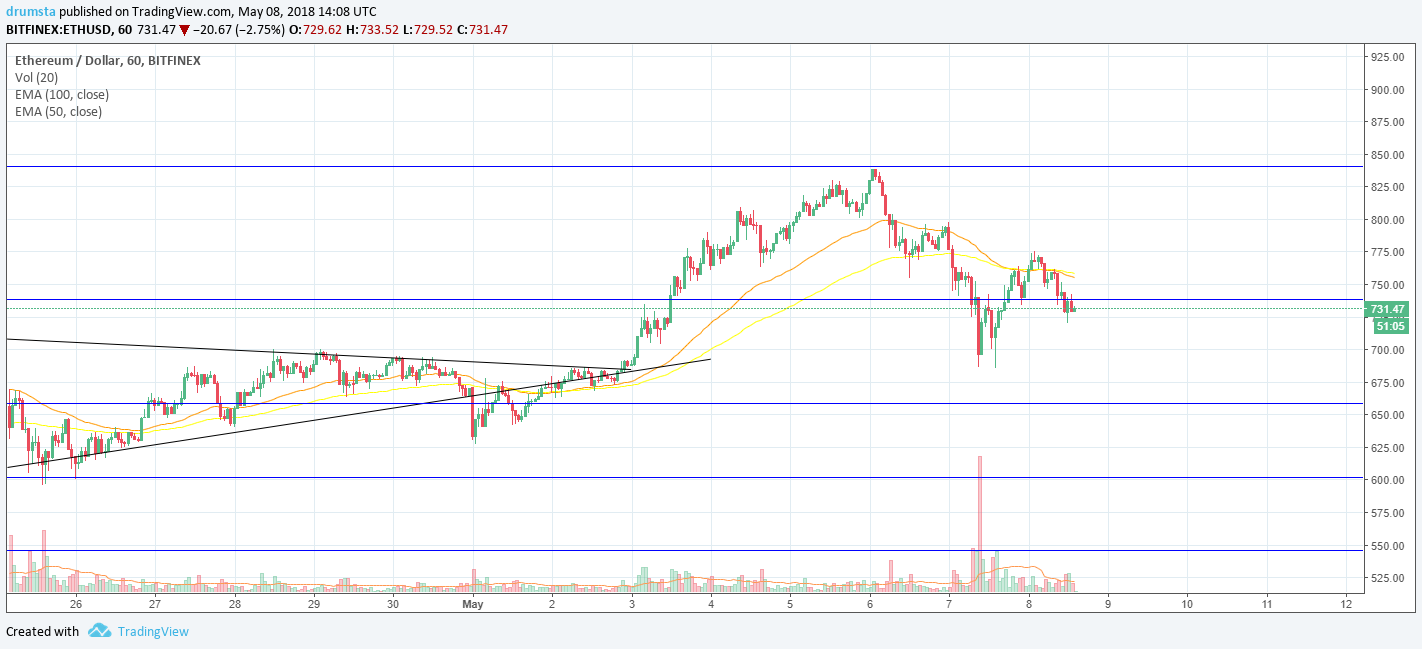
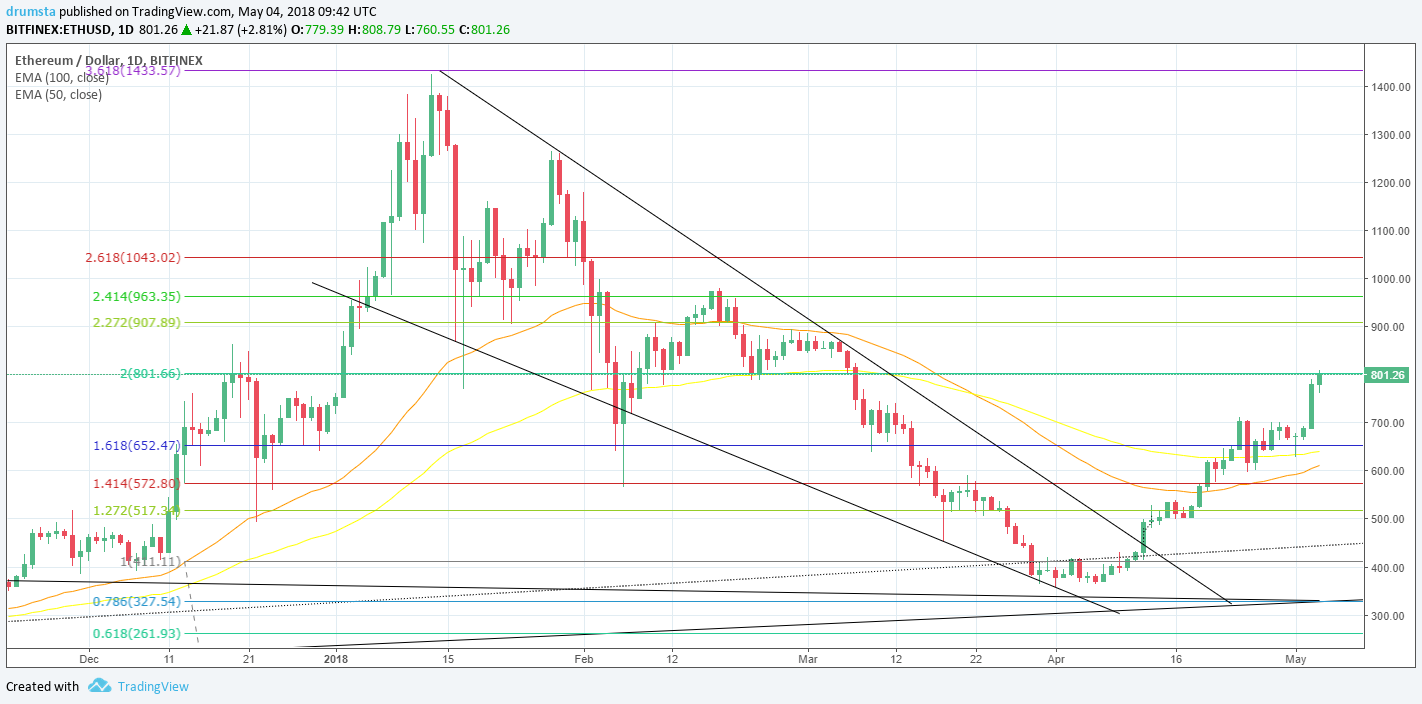
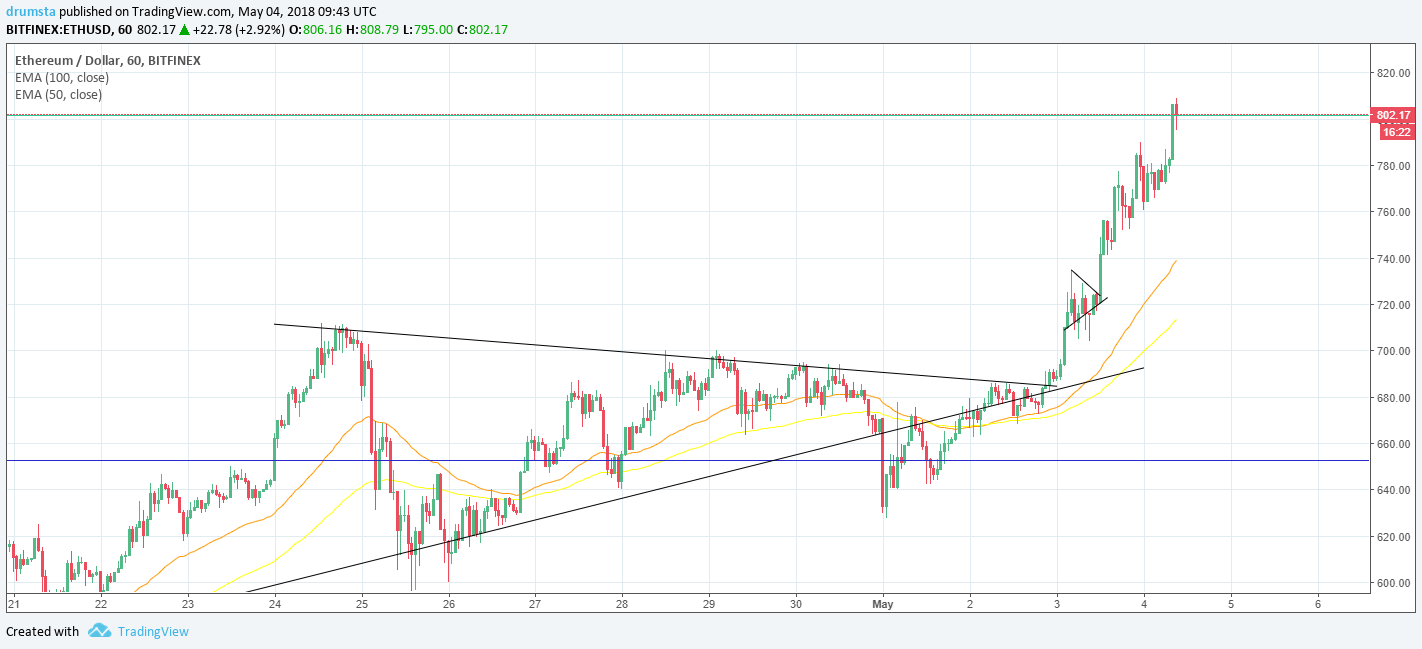
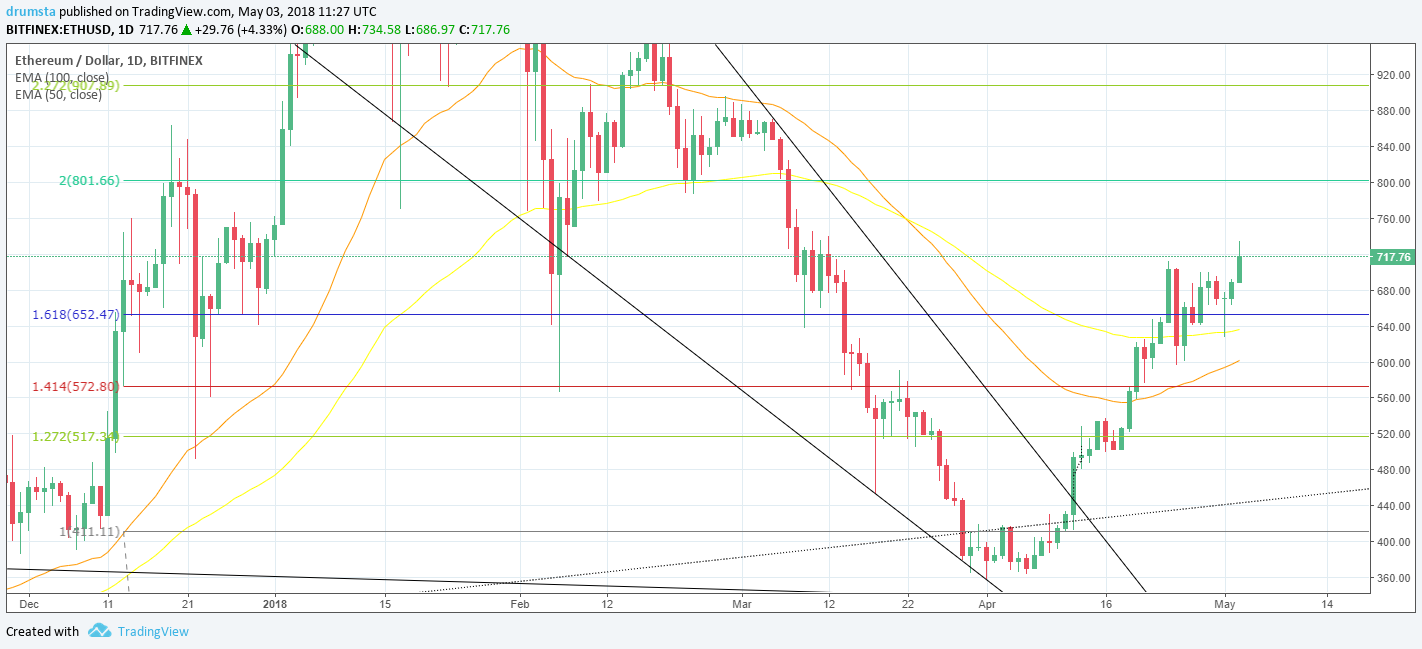
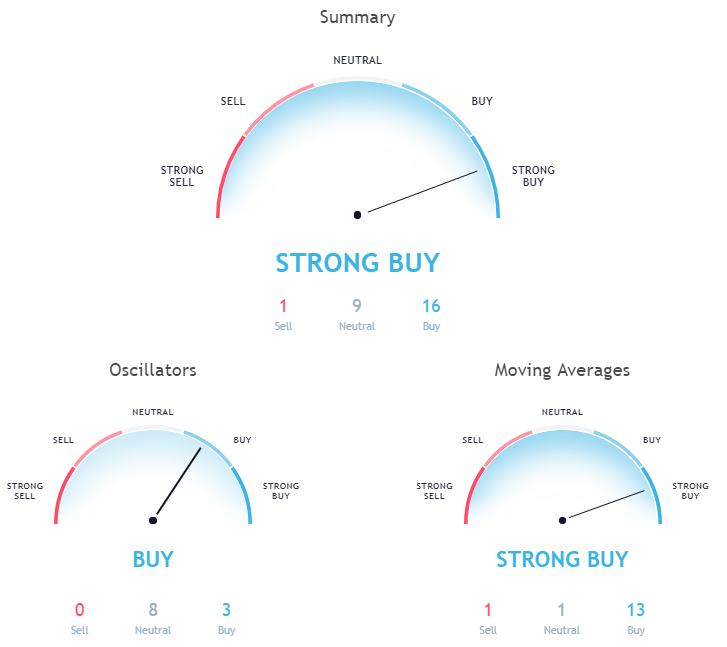
Ethereum
Unlike Bitcoin, Ethereum has been a bit more volatile today. After reaching a high of just above $185, it started declining. The decline was sharper than Bitcoin, but so was the upwards move that came afterward. After a period of falling sharply and reaching a price of $178, Ethereum managed to get enough buying power to reach across the 38,2% Fib retracement line and reach $182. However, the RSI indicator is now dangerously close to the overbought territory, while Ethereum has only managed to cross the 23,6% Fib retracement line. With the current volume, it staying above this line is highly unlikely.
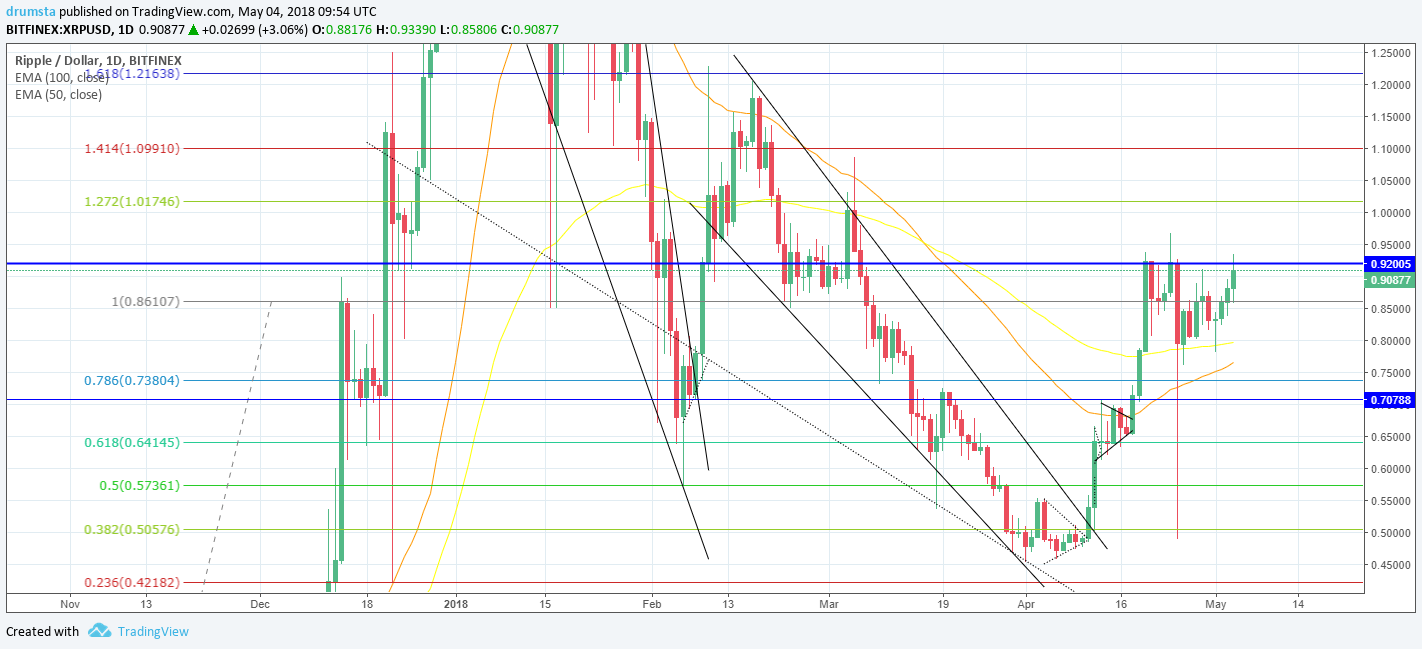
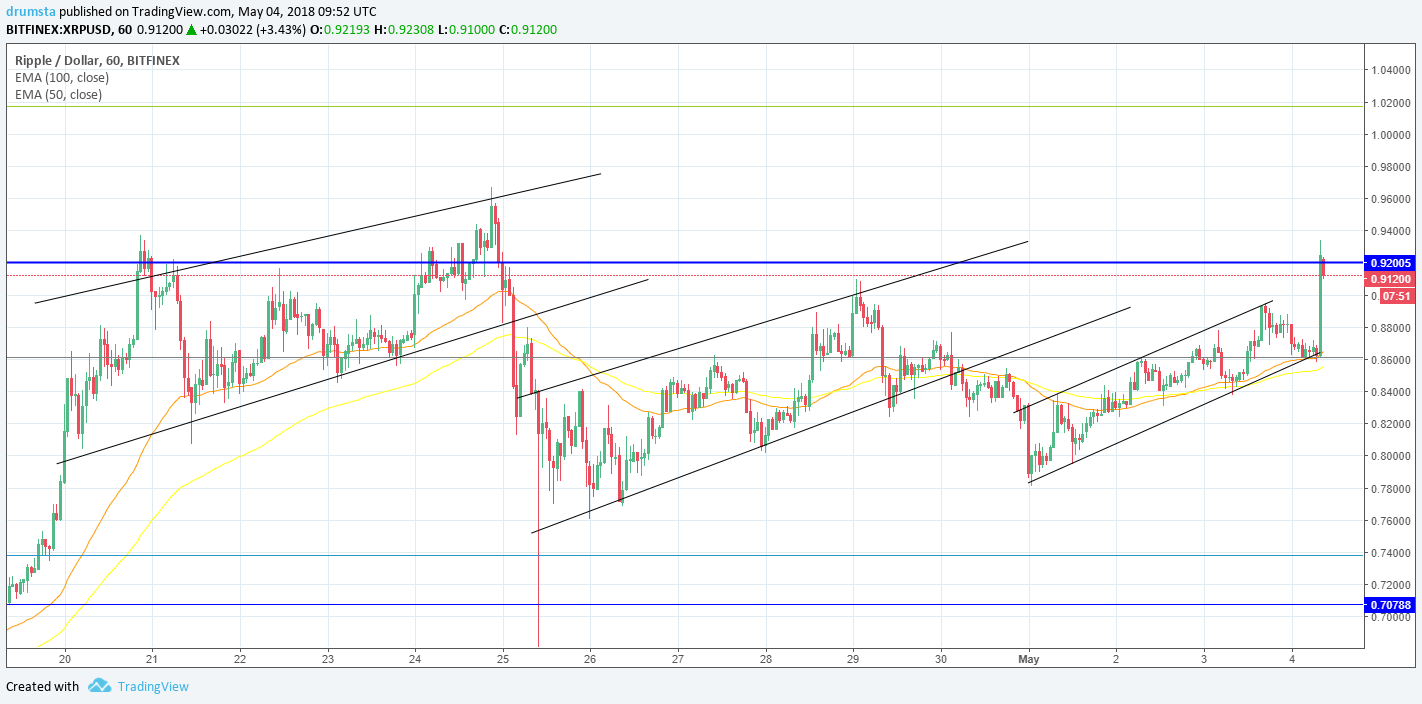
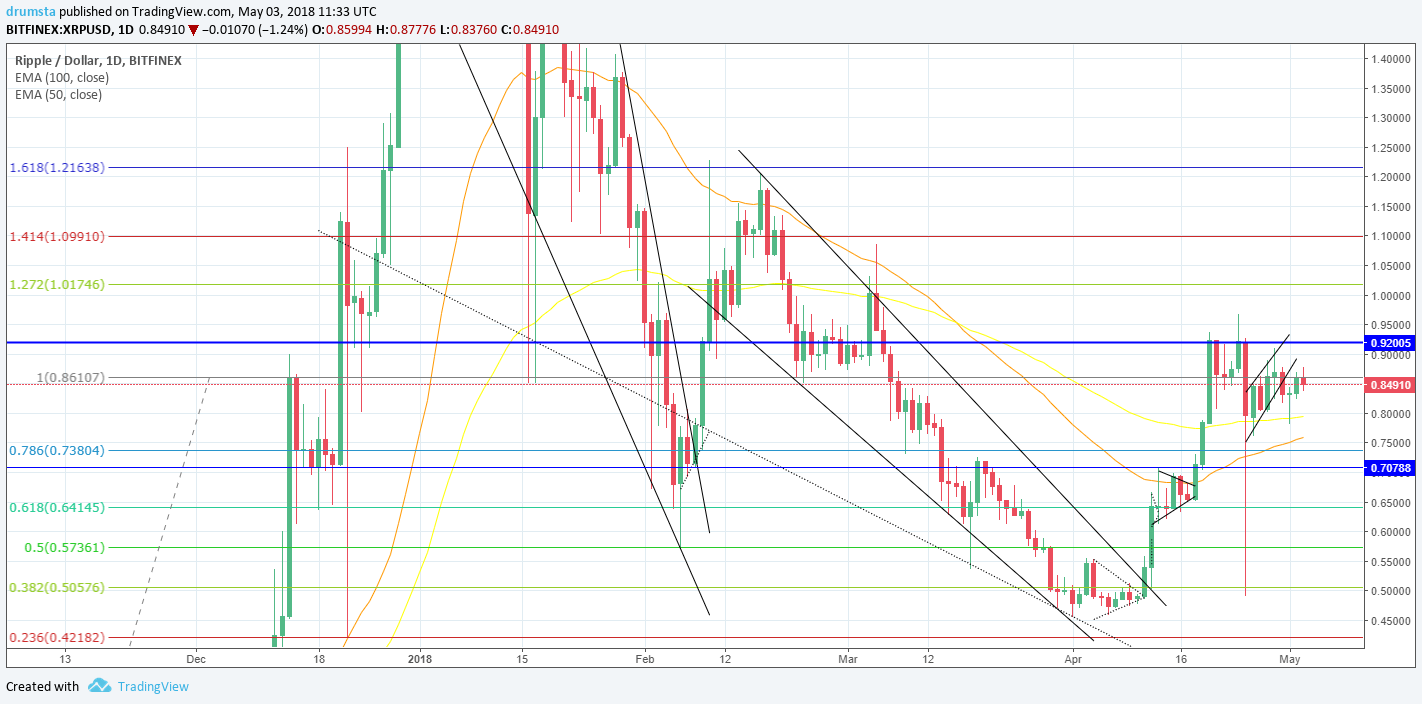
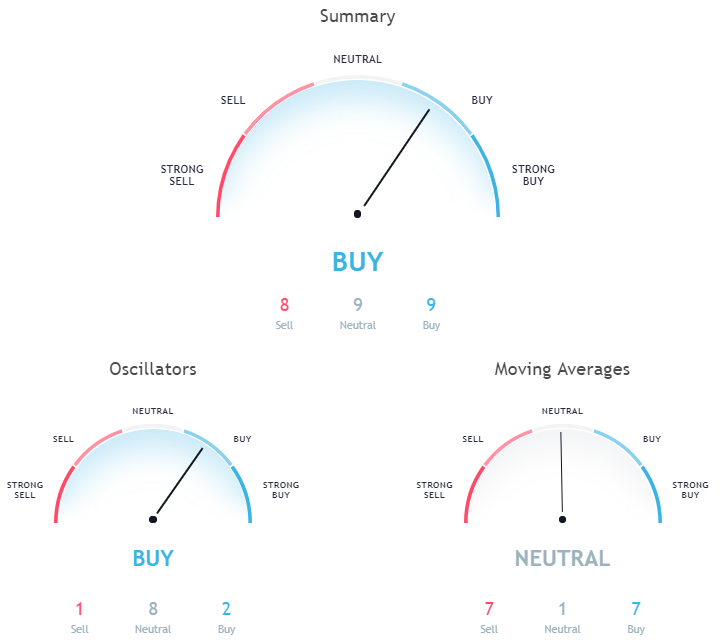
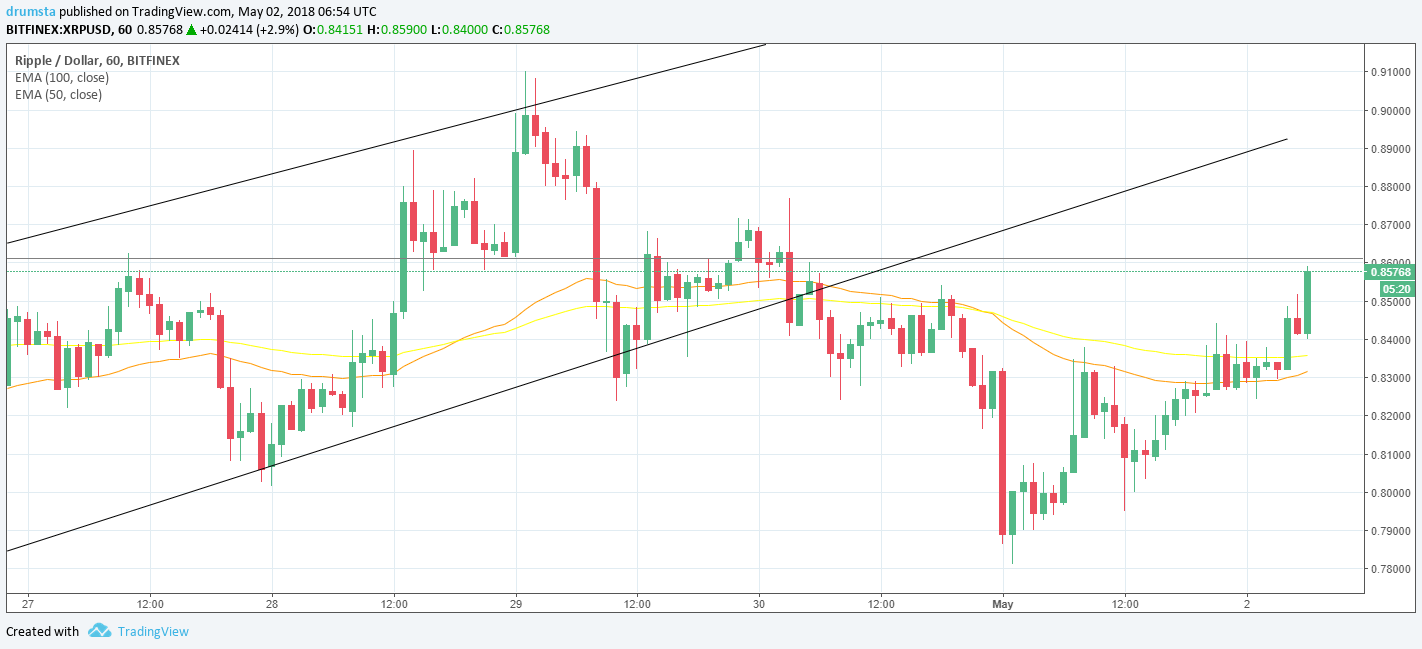
XRP
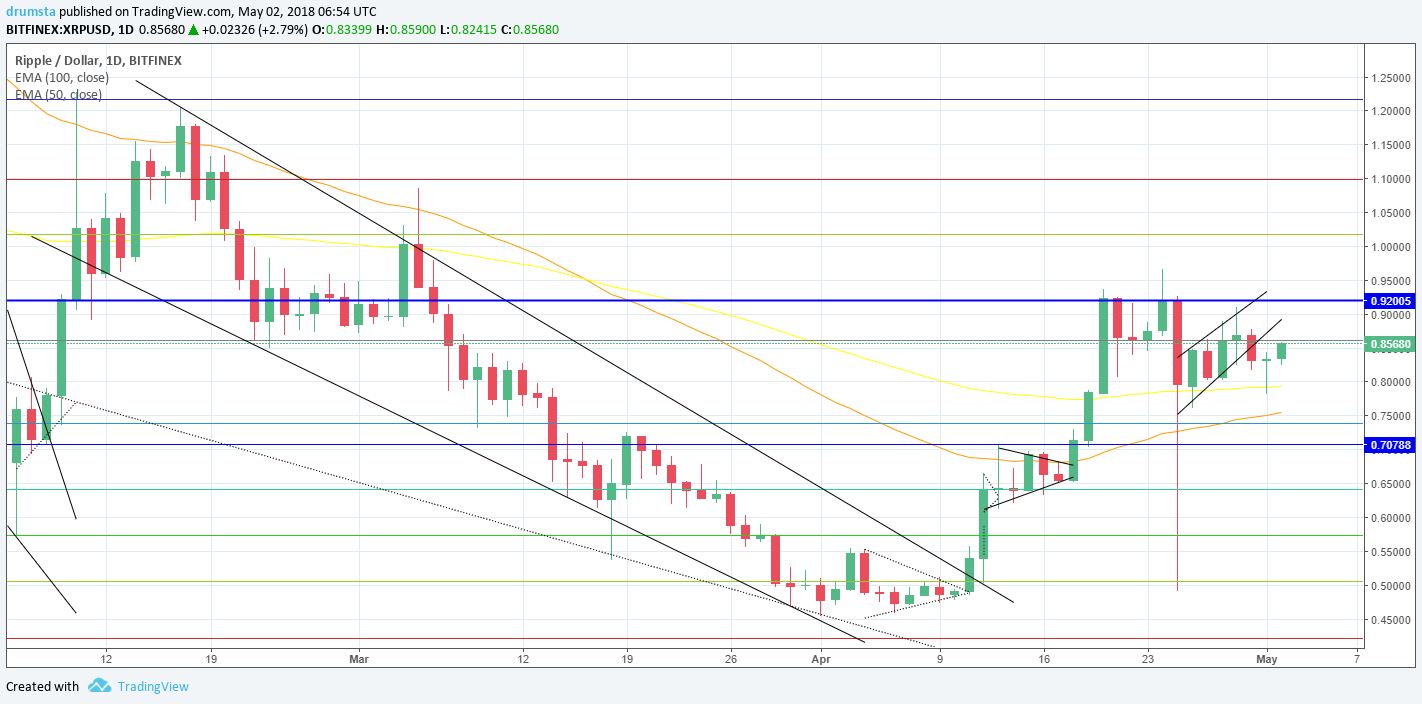
When looking at the pure 24-hour performance, XRP did the best out of the top3 cryptocurrencies. After getting close to the price of $0.29, XRP started retracing. It blew through the 23,6% Fib retracement line and stopped near the 50% Fib retracement, which acted as a resistance. After dropping to $0.272, it began rising again but did not go far. Its attempts to reach above $0.28 failed twice, so, XRP is now trading between the $0.28 line, which acts as a resistance and a $0.275 acting as a support.
XRP’s volume has shown more volatility than Ethereum and Bitcoin, which might be why it has performed better than the 2.