General overview
Market Cap: $431,399,206,497
24h Vol: $23,904,826,366
BTC Dominance: 36.2%
Daily Crypto Update: Things haven’t changed much in the last 24 hours. The cryptocurrency market cap evaluation has been oscillating between $425,838,000,000 which was the lowest point yesterday and $448,277,000,000 which is the highest point of today.
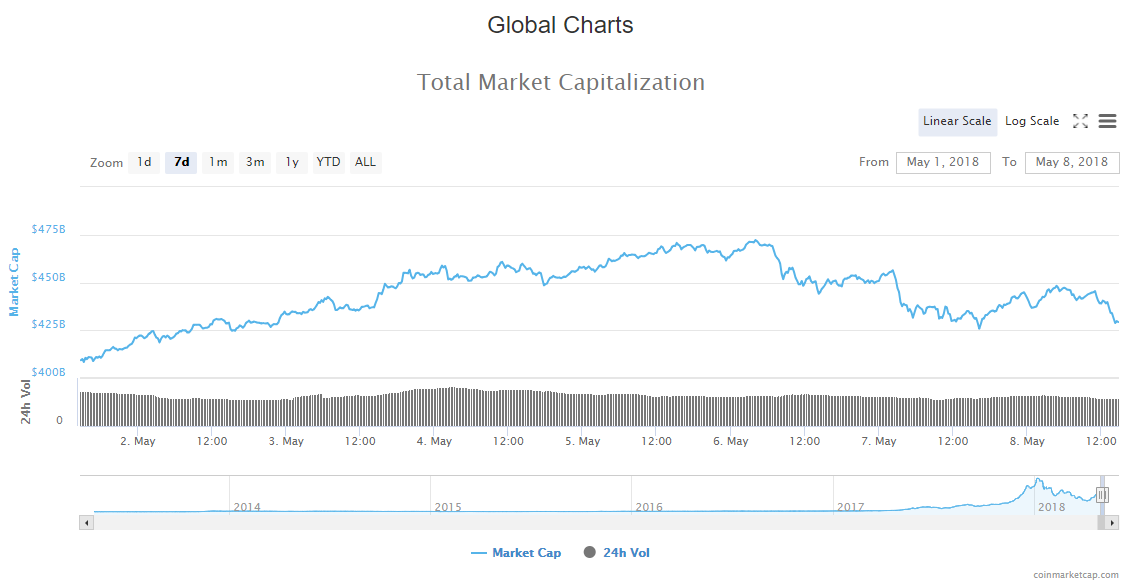
The Market Cap is currently sitting slightly below 342B.
News
NYT: New York Stock Exchange Owner Wants To Let Customers Buy Bitcoin
The owner of the New York Stock Exchange (NYSE) is mulling over letting customers buy and hold Bitcoin, The New York Times reported late Monday, May 7. The move would be the second Wall Street giant in a week to reportedly open up to crypto.
Source: cointelegraph.com
World’s Second Largest Software Company Oracle To Offer Blockchain Products
Oracle Corp., the world’s second largest software company, is launching blockchain products over the next two months, Bloomberg reports May 7.
Source: cointelegraph.com
Japan Imposes Strict New Standards To Prevent Cryptocurrency Theft
The Japanese Financial Services Agency is to introduce tighter controls for cryptocurrency exchanges in order to prevent a repeat of the $500 million Coincheck hack of January 2018.
Source: ethnews.com
Fed Report: Bitcoin Futures Creation and Fall of Cryptocurrency Was No Coincidence
In the economic letter from the Federal Reserve Bank of San Francisco, published today May 7, the authors conclude that the rapid run-up and subsequent fall in the price of Bitcoin after the introduction of futures is far from a coincidence. Rather, it is consistent with trading behaviour that typically accompanies the introduction of futures markets for an asset — a situation comparable to the securitisation of bonds in the early 2000s.
Source: newsbtc.com
Analysis
BTC/USD
From yesterdays opening, the price of Bitcoin has decreased by 5.34% from $9660 to $9128 where it is now.
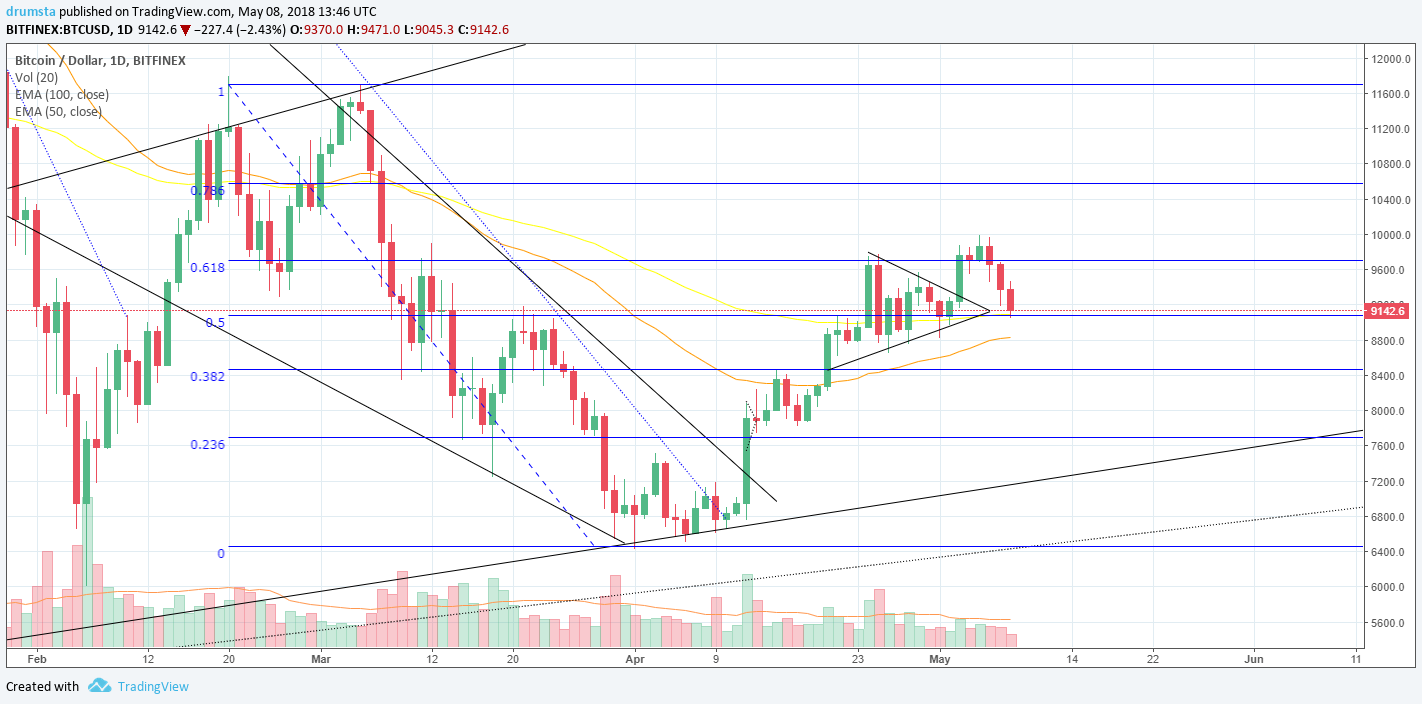
Looking at the daily chart we can see that the price has interacted with the 0.5 Fibonacci retracement level, and 100 day EMA which both served as support.
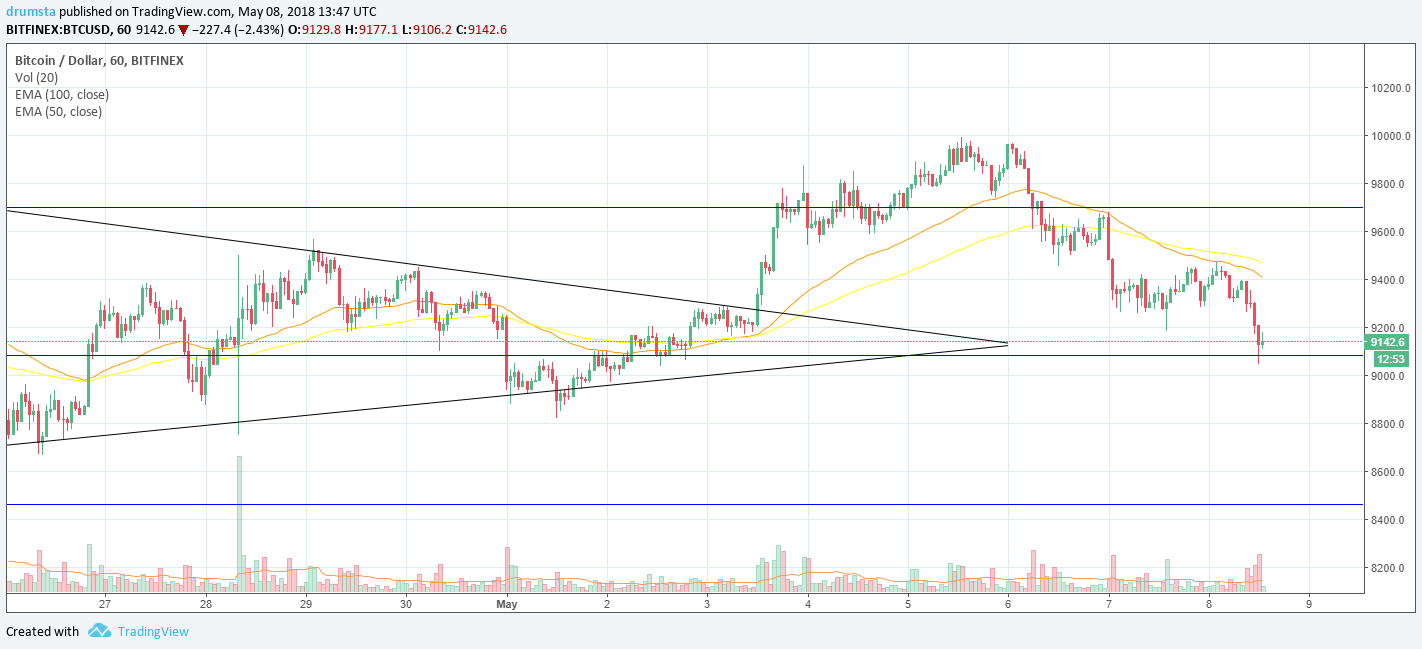
If we zoom into an hourly chart, we can see that the last candle is currently a doji and a green one, which means that a bounce back up is likely, before the price continues a downward trajectory.
Hourly chart signals a sell.

Pivot points
S3 8419.8
S2 8915.0
S1 9142.5
P 9410.2
R1 9637.7
R2 9905.4
R3 10400.6
ETH/USD
From yesterday’s open until now, the price of Ethereum has decreased by 8.28% – from $793 to $729.
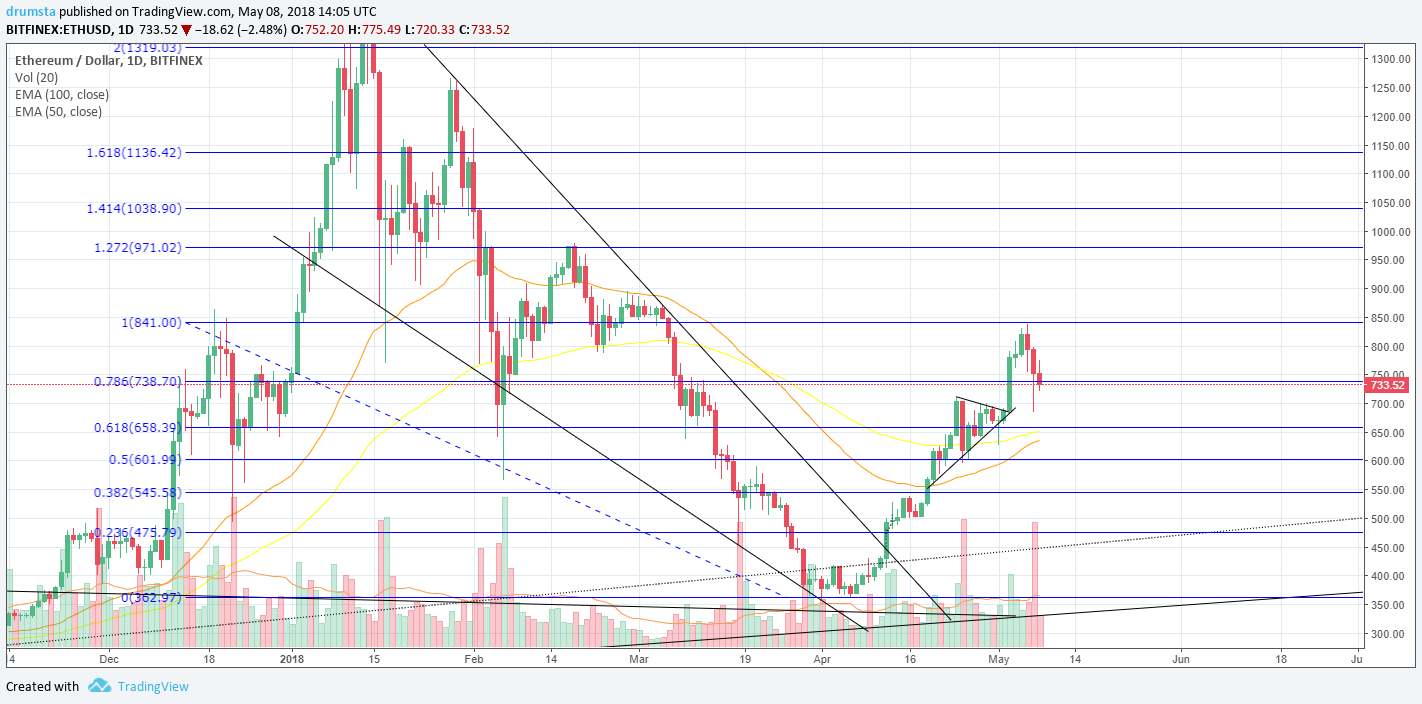
Things haven’t changed much on the daily chart. The price is above the 100 and 50-day EMA, the volume shows massive action, and the price is struggling to find support at the 0.786 Fibonacci level.
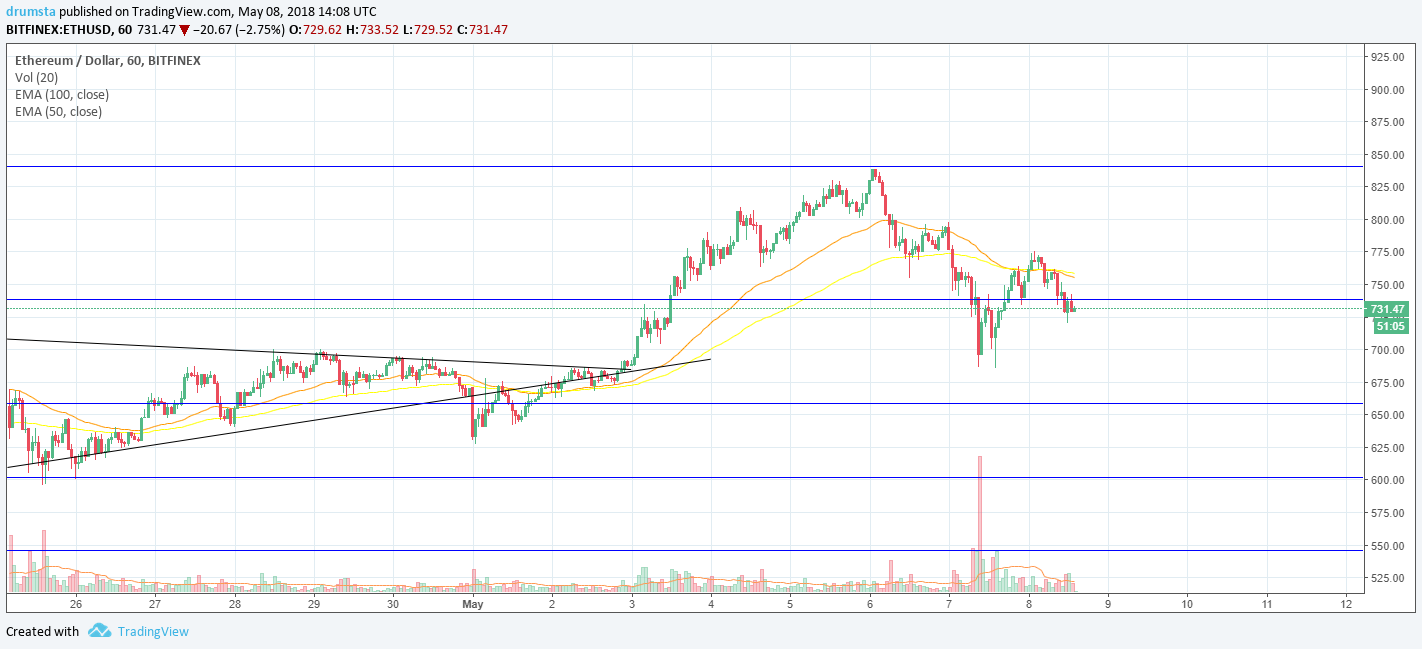
The hourly chart shows us that the price had fallen below the Fibo level, quickly peaked above it and then went below it again. The 100 and 50-day EMA’s are crossing above which is a bearish sign.
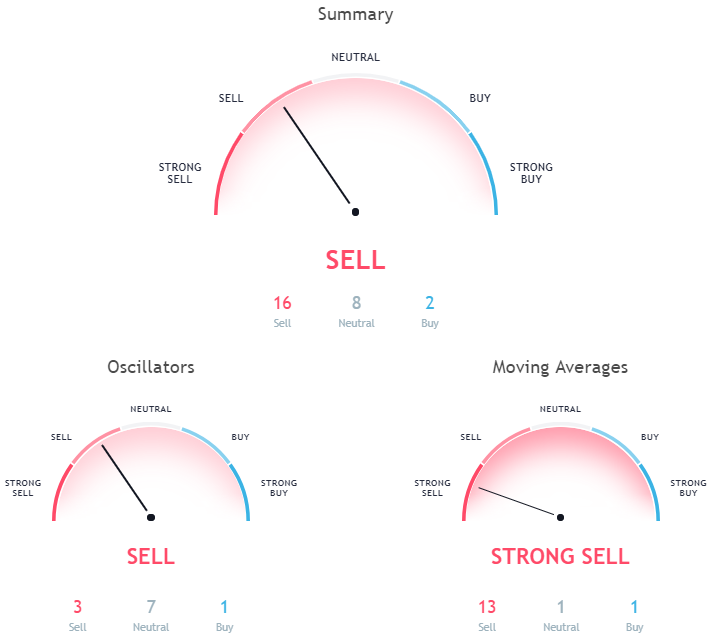
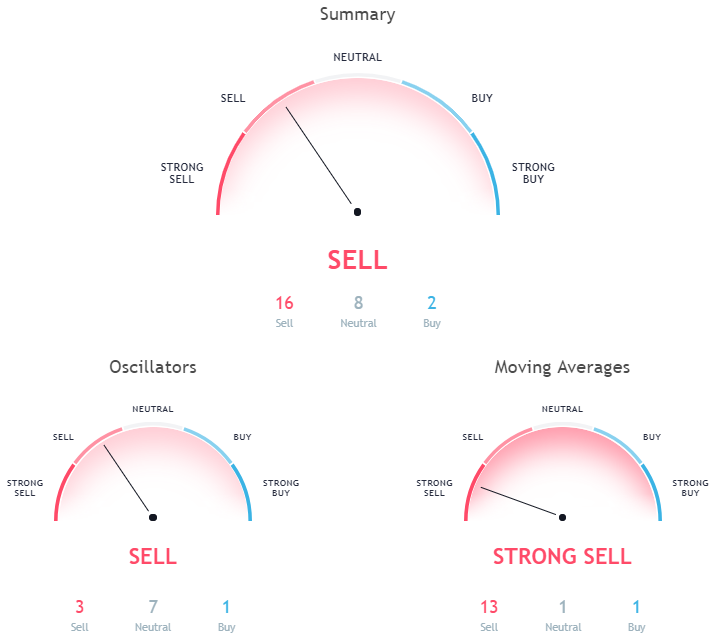
Hourly chart signals a sell, and moving averages a strong one.
Pivot points
S3 519.50
S2 632.30
S1 692.22
P 745.10
R1 805.02
R2 857.90
R3 970.70
XRP/USD
Since yesterday’s open, the price of Ripple decreased by 7% – from $0.862 to $0.804.

Looking at the daily chart, the price is bouncing off the 100-day EMA and is below the 100% Fibonacci level. It is currently looking for support, so maybe we will see the interaction with the 50 day EMA which is slightly below.

Zooming into an hourly chart, we can see that the price is on the same level as at the beginning of these three consecutive channels which tried to break the key resistance at around $0.92. Hourly EMA’s have crossed above which is a bullish sign, but are now apart.
Hourly chart signals a sell and moving averages a strong one.
Pivot points
S3 0.68808
S2 0.75888
S1 0.79255
P 0.82968
R1 0.86335
R2 0.90048
R3 0.97128
Conclusion
Daily Crypto Update: This correction we are seeing is just the beginning, so what I am expecting in the following days is another up move to create a lower high and then another drop to the downside to create a lower low. This conclusion is drawn from the prices of three major cryptocurrencies failing to create higher highs, and are now back on the previous support, looking for a strong one, which is not there at the moment. Moving averages are also indicating a bear trend.