Categories
Forex Market Analysis

Daily F.X. Analysis, May 05 – Top Trade Setups In Forex – Buckle Up for Seris of U.S. Events! 

On the forex front, the ICE U.S. Dollar Index marked a day-low of 98.64 Friday before paring losses to close flat at 99.08. Research firm Markit will publish final readings of April Manufacturing PMI for the Eurozone (33.6 expected), Germany (34.4 expected), France (31.5 expected). The Eurozone Sentix Investor Confidence Index for May will be released (-28.0 expected). The Commerce Department will report March factory orders (-9.4% on month expected) and final readings of durable goods orders (-14.4% on month expected).

Economic Events to Watch Today

EUR/USD – Daily Analysis

Today in the early Asian session, the EUR/USD currency pair struggling to break a bearish channel around 1.09 after the registered biggest daily drop by 0.67% to 1.0899 level in over a month on Monday due to broad-based U.S. dollar strength.

The GDP of the Eurozone dropped 3.8% in this quarter from the previous 14.4%. The ECB expects a 5% – 12% contraction in Eurozone’s economy this year. The International Monetary Fund (IMF) has forecasted the same Eurozone’s economic contraction as 5%, which was in line with the ECB’s projection. The ECB Vice President Luis de Guindos said in April that he expected a worse recession to be faced by the European economy than the rest of the world.

At 13:30, the Sentix Investor confidence showed a massive decline in the economic conditions of Europe by -41.8 against the expected -25.9. It showed that investors and traders had lost confidence in the European economy, and it weighed heavily on EUR/USD pair on Monday.

On the other hand, the economic data from the United States came in worse than expected. 

The Factory Orders dropped to a record of 10.3% during the month of March against the forecasted 9.7% decline. However, in contrast to the economic data, the U.S. Dollar Index remained strong during Monday when it gained about 0.4% and it to 99.59 level, which is the highest since Thursday. The key factor will be the NFP data on Friday this week, and investors will be looking forward to it.

Daily Support and Resistance

  • R3 1.0927
  • R2 1.0921
  • R1 1.0912
  • Pivot Point 1.0906
  • S1 1.0896
  • S2 1.0891
  • S3 1.0881

EUR/USD– Trading Tips

On Thursday, the EUR/USD price trading sharply bearish falling 1.0880 level after violating the ascending trendline on the 4-hour timeframe. On the 4 hour chart, the EUR/USD has formed a strong bearish engulfing candle, which is suggesting selling bias among traders. Typically such a pattern shows that buyers are exhausted, and sellers may dominate the market. On the lower side, the EUR/USD may find next support around 1.0835 level and violation of which can open further room for selling until 1.07600 level. 

GBP/USD – Daily Analysis

The GBP/USD currency pair stopped its 2-day bearish rally and took modest bids near the 1.2465 while representing 0.15% gains on the day, having hit the intraday high of 1.2471 mainly due to recovery in the risk sentiment in the financial market. The U.S. dollar is losing its bullish traction, which eventually keeps the currency pair supportive.

Currently, the GBP/USD is currently trading at 1.2468 and consolidates in the range between the 1.2431 – 1.2471. However, the traders are cautious about placing any position due to nervous sentiment ahead of the UK-US trade talks and the final reading of British Services PMI for April.

Moreover, the outlook for GBP looks more pessimistic, given the extent of the loss faced by the coronavirus pandemic by the city. Another reason included in the pessimistic view for GBP outlook included the U.K. government’s attitude towards the extension of the Brexit negotiation period as well as the potential of Britain for a cautious reversal of economy after lockdown.

The drop of GBP/USD pair in the absence of any macroeconomic data and news from Great Britain was caused by the strength of the U.S. dollar across the board. Despite the poor Factory Orders data from the U.S. on Monday, the U.S. Dollar Index rose about 0.4% and remained strong against its rival currencies.

The strength of the U.S. dollar, along with the pessimistic outlook of GBP, dragged down the GBP/USD pair towards 1.240 level on Monday. The next key factor for pair would be NFP data from the U.S. on the coming Friday.

Daily Support and Resistance

  • R3 1.2597
  • R2 1.255
  • R1 1.2497
  • Pivot Point 1.2451
  • S1 1.2398
  • S2 1.2352
  • S3 1.2299

GBP/USD– Trading Tip

The GBPUSD pair is trading sideways around 1.2435, testing a double top pattern around 1.2425. The recent Doji pattern on GBP/USD pair is suggesting chances of bullish correction over 1.2425 support level. This may lead the GBP/USD prices towards 1.2515 level. On the lower side, the violation of 1.2420 support can lead the Sterling prices towards the next target level of 1.2316. Overall, the trading bias of GBP/USD remains bullish, considering the 50 EMA as it’s keeping the Cable bullish above 1.2420 today.  

USD/JPY – Daily Analysis

The USD/JPY was closed at 106.718 after placing a high of 107.067 and a low of 106.633. Overall the pair USD/JPY moved sideways during Monday and remained flat. The risk-off sentiment in the market emerged on Monday after the U.S. administration started an investigation into the origin of the virus. The U.S. administration has decided to prove that China deliberately withheld the information from the world, which led to the global spread of coronavirus. However, WHO confirmed that it had not received any evidence from U.S. administration about the speculations about the origin of the virus that is Wuhan’s laboratory.

U.S. President Donald Trump announced that China should be held responsible for the global coronavirus spread. According to him, China should have informed about the hand-to-hand transmission of the virus earlier as well as it should have stopped the virus from spreading across the globe and in order to punish China for its mishandling of the situation, the U.S. has announced to come up with a retaliatory measure against China.

Trump on Monday also announced to cancel the phase-one deal that was signed between China & the U.S. if China will fail to fulfill its promise of buying $200 worth of U.S. goods. Coronavirus has hit the economies of all countries by lockdown, and it is unclear whether the Chinese economy is able to fulfill its promise or not.

Furthermore, the fact that the U.S. is blaming China over the global pandemic of coronavirus has raised fears of a new trade war between China & the U.S. This rising tension has created the risk-off sentiment in the markets and supporting U.S. dollar. 

The U.S. Dollar Index rose 0.4% on Monday and reached a level of 99, which is highest since Thursday. The pair USD/JPY was also supported by the strength of the U.S. dollar on Monday. In the absence of Japanese traders due to Japan’s Bank holiday, the movement of USD/JPY was solely dependent on USD on Monday. The pair showed very slow progress almost remained flat throughout the day.

Daily Support and Resistance    

  • R3 107.46
  • R2 107.27
  • R1 107.01
  • Pivot Point 106.82
  • S1 106.56
  • S2 106.37
  • S3 106.11

USD/JPY – Trading Tips

The technical side of USD/JPY is mostly unchanged as the pair continues to consolidate around 106.700. As we can see in the 4-hour chart above, the USD/JPY pair is struggling to cross over the downward trendline, which is extending resistance around 106.950. As of now, the USD/JPY pair has also formed a symmetric triangle pattern, which is currently supporting the pair around 106.440. The 50 EMA is also keeping pressure on the pair around the same level of 107.050. Below this level, we may see a selling trend in the USD/JPY pair until the next target levels of 106.44 and 106. 

All the best for today! 

Categories
Forex Signals

BTCUSD: Consolidation after double bottom

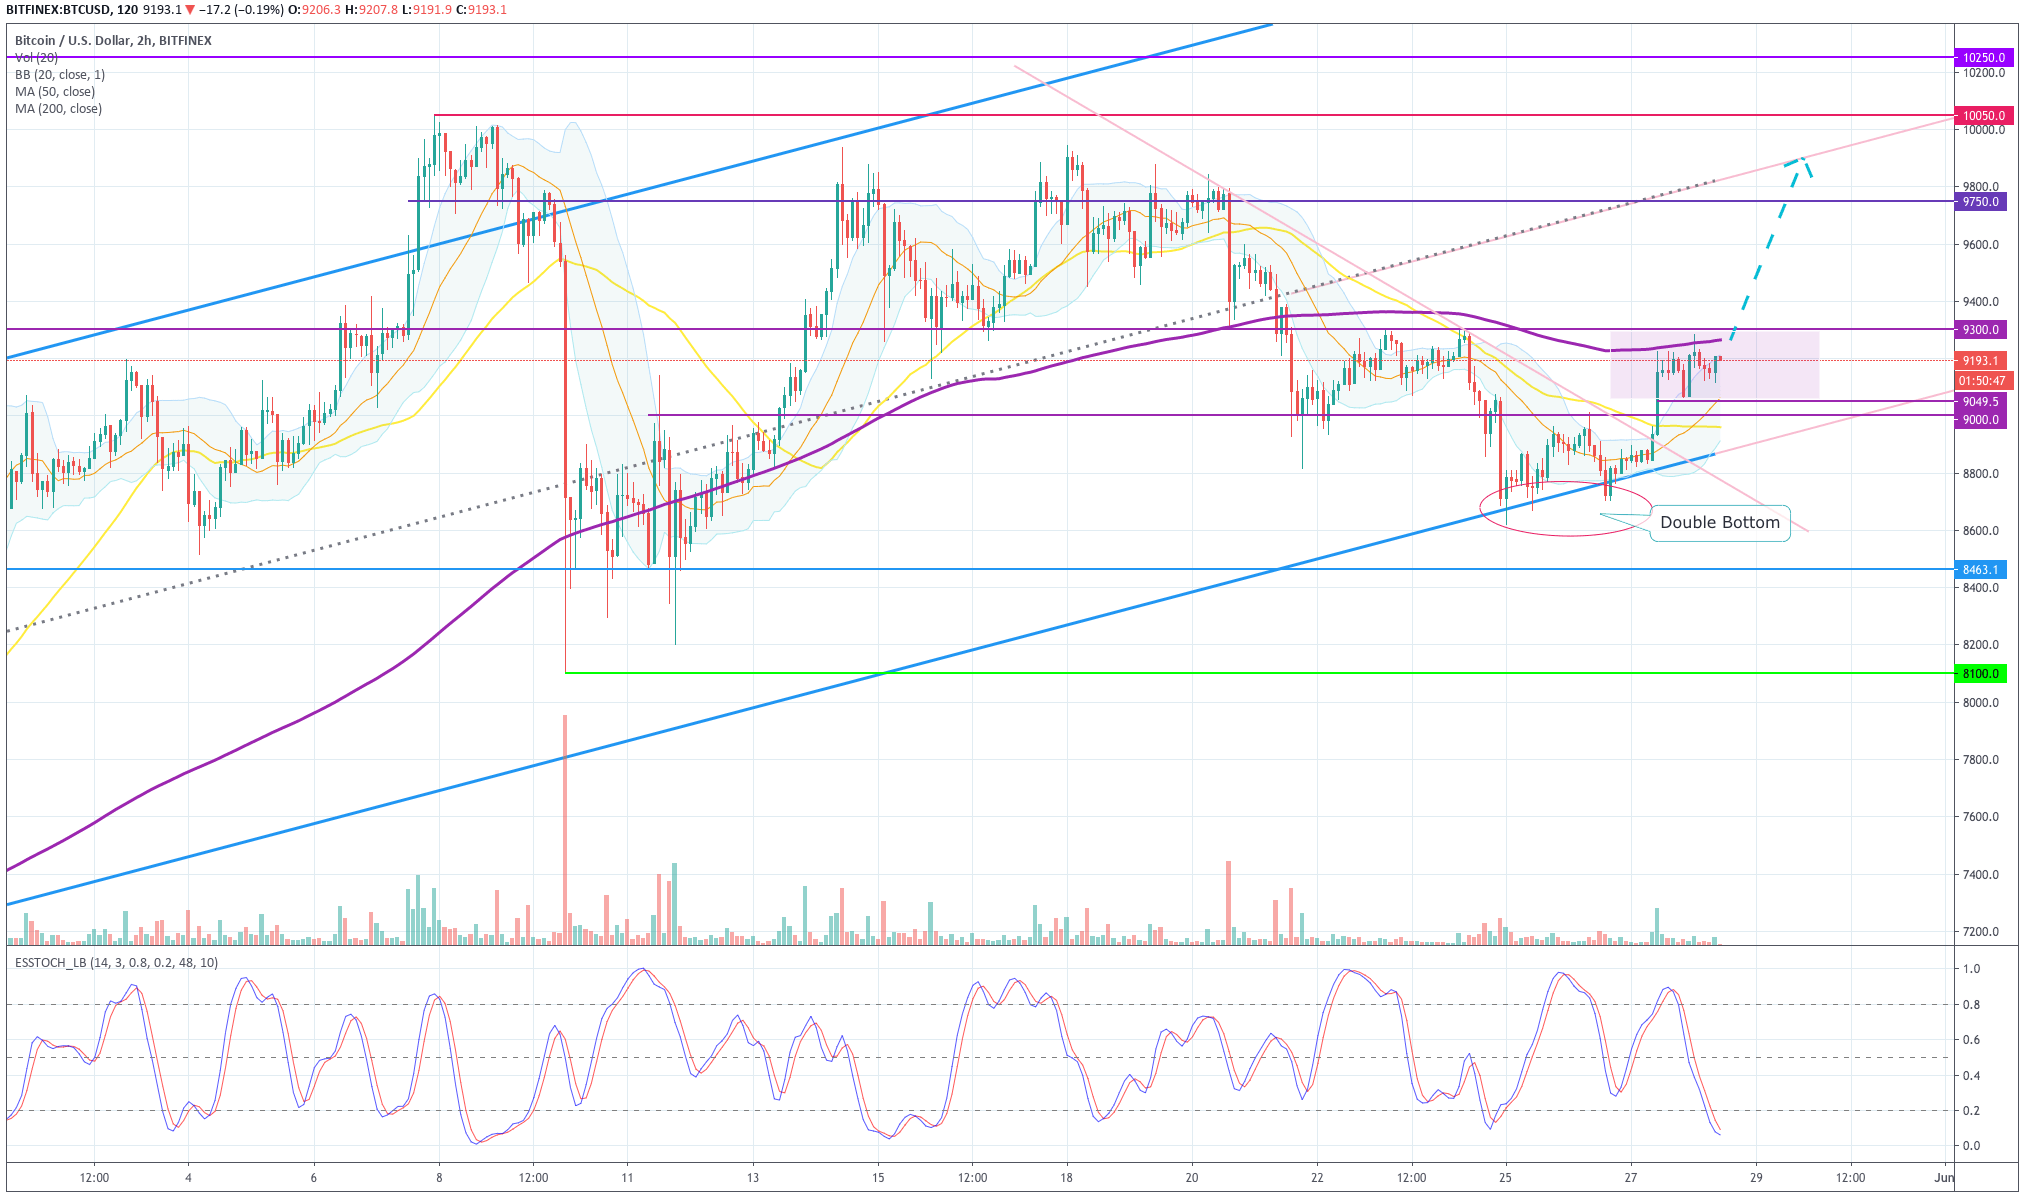
Bitcoin made a high-volume bullish candle after a double bottom touching the lower edge of its bullish channel. After bouncing off of its 200-SMA has created a consolidation channel in which you see two engulfing candles, after a bounce from the 50% level of the initial bull candlestick.

On the other hand, the Stochastic RSI indicator is in its lower side of the range, ready to make a crossover to upper levels. Thus, instead of waiting for the $9,300 break, we could test the strength of the market and make a spot order at the current levels with a relatively tight stop 100 pips under the current level and see if the strength shown continues.

The channel shown is a linear regression channel, with the edges separated + and – two sigmas from the real regression line. Thus a bounce off the -2-sigma edge means a value buy and a progression towards the consensus, or fair price, which is represented by the regression line shown in dotted gray/red. This action is a high probability event in this kind of mean-reverting market, such as is happening with Bitcoin. Moreover, the trade goes with the main upward trend. Thus the target is set conservatively below that level, at 9,740.

The levels

Buy entry: 9,203

Invalidation level: 9042

Profit Target: 9,741

Risk: $100 on each BTC purchased

Reward: $540 on each BTC purchased

Reward/Risk: 3.34

Categories
Forex Signals

Bitcoin: Entry on Consolidation.

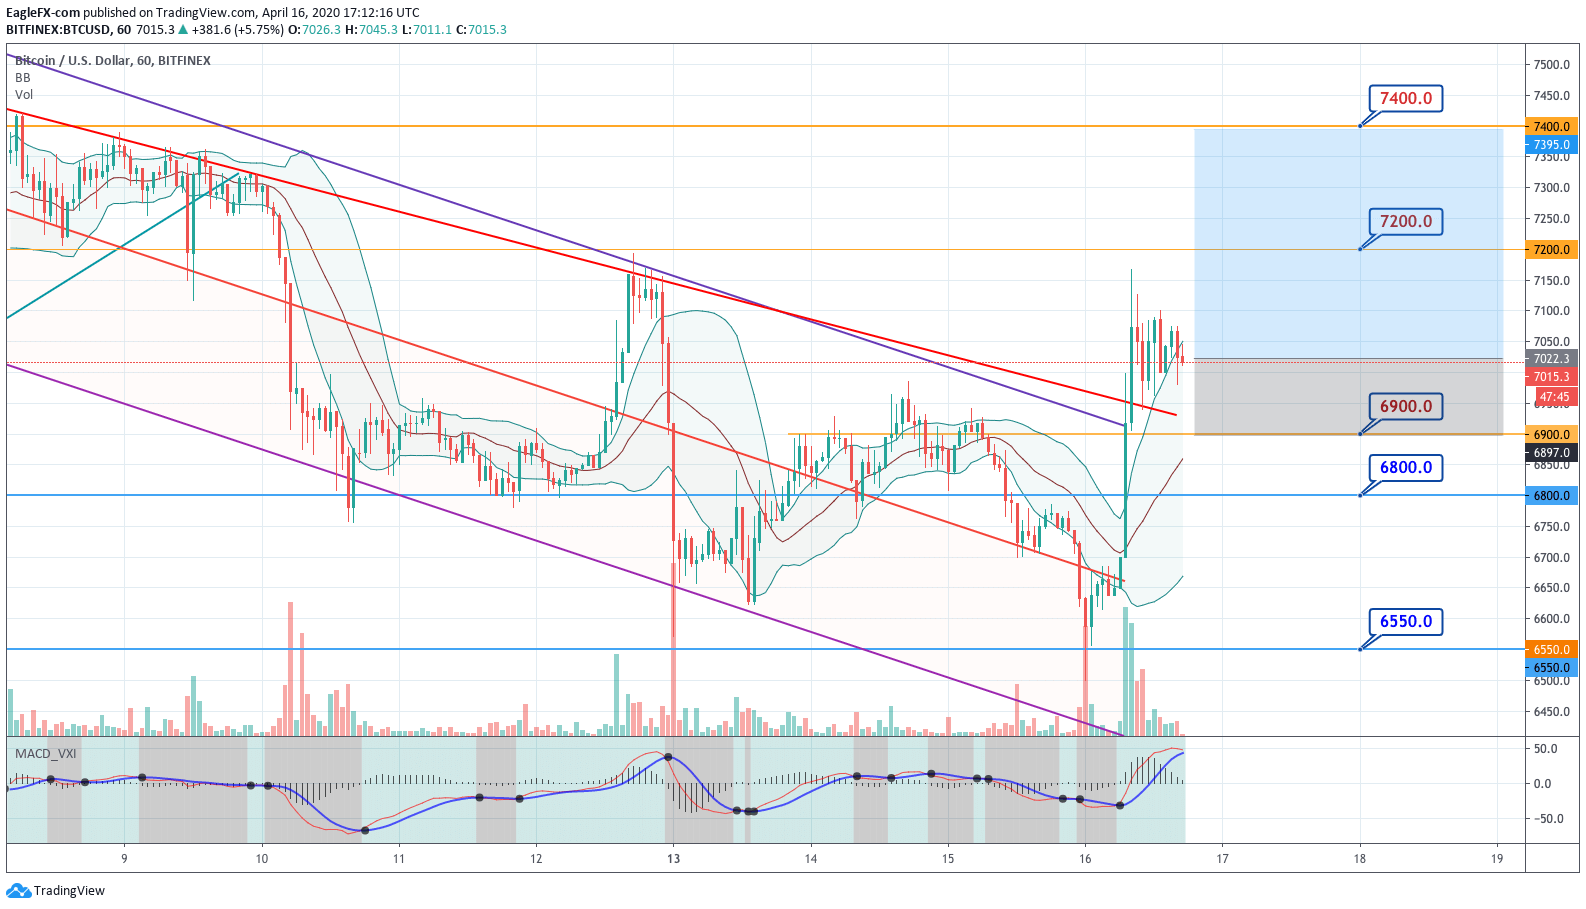
Bitcoin had a sharp reversal movement early morning today. This movement is creating an engulfing candle in the daily chart. The hourly chart shows a  complex reversal formation followed by a large bullish candle which creates a morning star figure on strong volume.

The Next hourly candle pierces through the upper limit of the channel and also through the red descending trendline that marks the mid-term downward trend. The following candlesticks are creating a consolidating triangular structure that basically is a continuation signal.

The trade shows a 4:1 RR and the current momentum is bullish, therefore this is basically a trend-following trade.

Key levels of the trade:

  • Long entry level:7000
  • Stop-loss: 6,890
  • Take profit: 7,400

Risk:

  •     1 BTC: $110
  •  0.1 BTC: $11
  • 0.01 BTC:$1.1

Reward: About 4x the risk.


Categories
Crypto Market Analysis

Daily Update: XRP Falling down, Bitcoin in Negative Again, Cryptocurrencies Follow Bitcoin Downwards

Daily update: XRP falling down, Bitcoin in the negative, Cryptocurrencies follow Bitcoin down

XRP

XRP has had a major swing up which brought it from $0.30 to an astonishing price of $0.79. However, the move was parabolic, and had to be contained. The price was rejected very soon, but it did not fall back to its previous levels. XRP consolidated at the price of around $0.55 and stayed there for a while. With Bitcoin going down, XRP has rushed downwards and had a major crash of 18% which left the price sitting at $0.46.

Bitcoin

As always, Bitcoin is leading the price movements and dictating the trend of Cryptocurrencies. This time, it was to the downside. Bitcoin’s price fell down about 3.4%, which made other Cryptocurrencies fall down in price as well. Many of them, however, dropped down in price far more then how much Bitcoin has fallen. Most of the top100 Cryptocurrencies fell more than 5%.


Categories
Crypto Market Analysis

Weekly Analysis: Bitcoin Trend Continuation, Ethereum to Spike Up; EOS Threatening to go Downwards

Weekly update: Bitcoin Trend Continuation; Ethereum to Spike Up; EOS Threatening to go Downwards

Bitcoin

  • Fundamental analysis: Bitcoin has been improving in terms of network capacity (lightning network) and transaction number. However, the overall sentiment is still bearish. The bullish news/support come in dashes and leave pretty fast. Bitcoin’s price action over the last weeks clearly reflects such ambivalence.Many news outlets as well as influential people are suggesting that Bitcoin will go further down, making it a self-fulfilling prophecy.
  • Technical analysis: Bitcoin has been following the downwards trend for a couple of months now. If we look at the daily chart, we see a perfect downwards facing trend line to which Bitcoin rises and from which it bounces. We are expecting a next retest of that line near the end of this month. So far, however, we are in a bullish part of the move. This has been proven by Bitcoin staying above the $6480 line after breaking it.
  • Ethereum

    • Fundamental analysis: Ethereum has had it tough during the last 30 days. Many people claimed that it is obsolete, and done as a Cryptocurrency. This drove a lot of negative sentiment towards Ethereum, which prompted its dive down to unforeseeable levels just a few months ago. However, recent news have turned a bit more bullish and had helped Ethereum to perform greatly in the past couple of days. With that being said, Ethereum still has to survive the inevitable change of the ICO structure, which is leaning towards changing almost everything about them. This may impact Ethereum quite negatively.
    • Technical analysis: Ethereum has been on the rise in the past couple of days. The bullish news that came through the pile of negative ones had some impact, making Ethereum rise up to the price of $225, and holding there. However, it is still contained in the “death trend” which it will have to escape in order to survive and remain in the #2 spot in Cryptocurrency market capitalization ranking.


    EOS

    • Fundamental analysis: EOS’s fundamentals did not change much in the previous week. Market sentiment holds slightly bullish as people believe more and more in this project. Marketing is great when it comes to showing EOS’s potential, and people are approving the advertisements. Recently, EOS has gotten the rating of the best performing asset in China, which only added to its popularity. However, did the price follow the good sentiment, or did the Cryptocurrency market as a whole take over?
    • Technical analysis: Sadly, even with all those slightly bullish news, nothing life-changing has happened to EOS so it would spike independently. However, the market has been fluctuating, and EOS has been following. The situation is similar to Bitcoin, except for the fact that the downwards facing trend resistance line is much, much closer. If EOS does not get a spike of buyers, it will fall down to the pressure of the downwards facing resistance that’s extremely close.
Categories
Crypto Market Analysis

Daily update: Ethereum and EOS catapulted, Bitcoin crawling up

Daily update: Ethereum and EOS catapulted, Bitcoin crawling up

Bitcoin

  • Fundamental analysis: As with most days, today is no different. Fundamentals of Bitcoin have not changed. There are some rumors and articles changing the sentiment to a bit more bullish, but overall, everything stays the same.
  • Technical analysis: Bitcoin has broken the first of many resistance lines which was at the price of $6385. However, it quickly found resistance near the $6520 level, and then started consolidating. It is still uncertain of where Bitcoin will end up.

Ethereum

  • Fundamental analysis: After many articles stating that Ethereum is done as a Cryptocurrency, opinions started to change. Counterarguments towards defending Ethereum brought a dash of bullish sentiment into the game, which skyrocketed Ethereum.
  • Technical analysis: Ethereum has broken the downwards facing trend line, and skyrocketed up without ever retesting it. This sudden spike might be unhealthy and could cause major pullbacks in this unstable and overall bearish market. However, this spike surely showed that Ethereum is far from dead.

EOS

  • Fundamental analysis: EOS has been performing extremely well ever since its conception. However, the sudden spike up was due to EOS becoming a quote currency on HitBTC.
  • Technical analysis: With the price spike, EOS has just broken its consolidation zone and settled between the previous resistance (now support) line and the $5.67 resistance line.


Categories
Crypto Market Analysis

Daily Review: Bitcoin stagnation, Ethereum downfall, Dash crash

Daily review: Bitcoin stagnation, Ethereum downfall, Dash crash

Bitcoin

  • Fundamental analysis: Bitcoin had a pretty steady day, with practically no movements. Fundamentals on this crypto currency have not changed, while sentiment is still slightly bearish. Lightning Network keeps expanding, but that fact is not advertised properly. On the other hand, CNBC and other news outlets keep pushing bearish news, which makes people fear investing.
  • Technical analysis: After trying to push above $6400 and failing, Bitcoin returned to its consolidation path, near the price of $6270. Further movements are expected soon, but the direction is yet unknown.

Ethereum

  • Fundamental analysis: Ethereum has been struggling for quite some time now. The articles, news and videos bring out the extremely bearish sentiment towards this Cryptocurrency. Most media outlets announce the “end of Ethereum” as a thing that is inevitable.
  • Technical analysis: The technical outlook for ETH/USD is far from good. Hovering around $185, Ethereum is worth around 8% less than yesterday. This trend is highly likely to continue, with this market sentiment and no other bullish signs. However, for now, Ethereum has found support at $180.

Dash

  • Fundamental analysis: Dash is another Cryptocurrency with a bad market sentiment at the moment. However, the price defied that sentiment until today. Many people claim that dash has problems with the way it works, but the community and programmers dismiss the news.
  • Technical analysis: Dash was trying to sustain an unnatural upwards trend for a couple of days. The only question was when it would break. We called the break of the trend correctly, and when DASH reached $200, it broke the trend and fell sharply to bellow $190. This sharp decline will continue until DASH finds a good consolidation price.

Categories
Crypto Market Analysis

Happenings in the Cryptoverse

Happenings in the Cryptoverse

Bitcoin Vs Altcoins: The Cryptocurrency field is in quite of a rough spot when it comes to price at the moment. With altcoins being pegged to the price of Bitcoin, any movement seems to affect cryptocurrencies globally. Why is this happening and what to do?


Why Are Altcoins Dropping In Price More Than Bitcoin?

Bitcoin Vs Altcoins

If, however, Bitcoin is rising in price, they are winding up slower because traders are riding the wave that Bitcoin created. After the spike up happens, altcoins take over and people diversify their portfolios from the previous gains they had.


Bitcoin price manipulation or something else?

Bitcoin price manipulation

Is this price fall an “attack” on Bitcoin and all of the Cryptocurrencies, or something else?

As you know, I am very conservative when it comes to accusing someone of price manipulation. There is always (in a way) a form of price manipulation from the big holders, but it’s usually not to shut down an asset, but rather just to profit from it. Also, the MtGox trustee has been a great source of fear and FUD with people, which further decreased optimism when it comes to Crypto.


So, it is price manipulation?

Only a small part of the price drop (I believe) is price manipulation. Investors were panic selling every step of the way down. Ultimately, the biggest reason for the drop in the value of Cryptocurrencies is nothing else but levelling of expectations and capabilities.

People had great expectations from day 1 of investing, but the truth is that Cryptocurrencies (most of them) were not ready for mass adoption and mass use, especially Bitcoin. This situation made the Crypto field a speculative field rather than an objective one. The price drop that happened levelled the expectation that people had regarding what Blockchain and Crypto could do for the world, rather than just turn a dollar into a few more, or into none.

Categories
Forex Market Analysis

Consolidation In The Crypto Market

Cryptocurrencies have been stagnant and without many big moves to either side. The reason for that is the uncertainty abbot what happens on the tax day. We see less movement in crypto because, whoever wanted to pull their money out before tax date, did already, and we now see only people that hold.

BTC/USD consolidating

After the recent spike due to positive fundamental news (approval of the Muslim community), Bitcoin has its momentum slowed down. It made an attempt over an 8230 Fibonacci retracement line of resistance, but failed and is now consolidating and going slightly downwards, with decreasing volume. The price range is currently between the 50 EMA and 100 EMA on the 1h time frame.

crypto consolidation

NEO/USD bouncing off the resistance line

As we have concluded in the last analysis, neo was in a tough spot, and the most likely thing that would happen to it was the bounce off the red resistance line (shown in the graph). That is exactly what happened to it. This is a big deciding point for NEO, as indicators are “fighting” for the range and the direction of the next movement. RSI just left overbought, volume is declining, and there is a major resistance on the upside, but there are also both EMAs as support, they crossed each other, signaling a bull trend. I am more inclined towards the bear side for a bit until all the indicators get in line.

NEO/USD bouncing off the resistance line

XRP/USD forming a triangle pattern

XRP has recently spiked, after the big announcement that regarded cooperation with Apple. When that happened, XRP spiked up and broke the $0.63 resistance line, which has now become support. It bounced off of it a couple of times, forming a perfect triangle pattern, with the expected breakout from the pattern around the 19th or 20th of April. It will most likely be an upwards move, but it can’t be said with certainty. EMAs and the support line form a “defense” against triangle patter break downwards, but ultimately, people will decide.

XRP/USD forming a triangle pattern

Final word

Markets are mostly consolidating since these are uncertain times fundamentally. Everyone is waiting for a catalyst, for a reason to re-enter the market. The next few days will determine the overall short-term trend of the market, so watch out for the swing trades for now. One thing is good, and that is the increasing volume in the general crypto market.

© Forex.Academy