General Overview
Best Crypto News Daily:
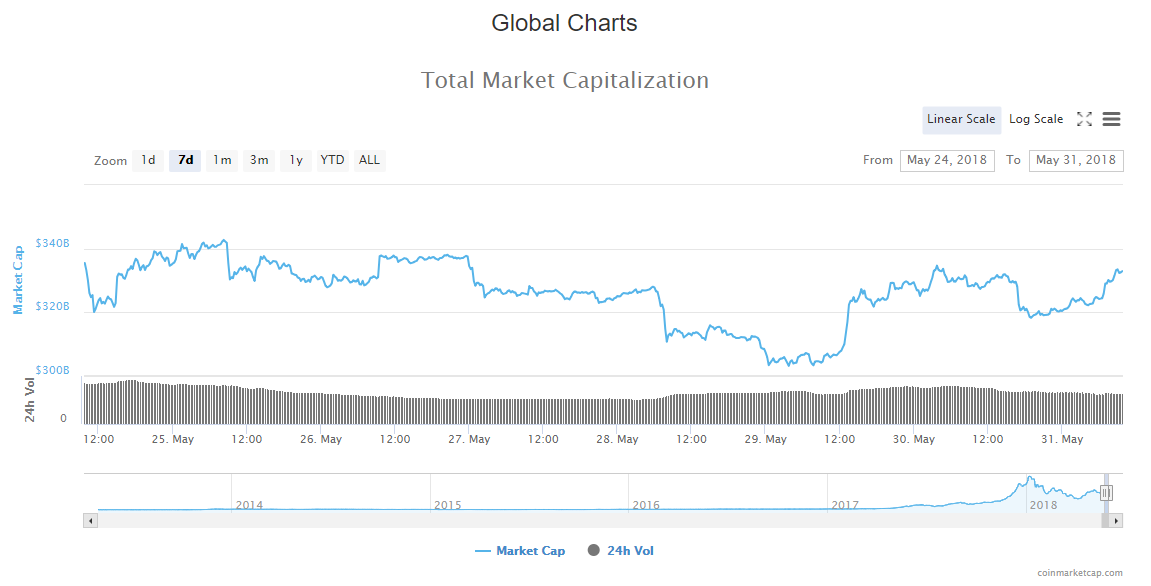
Market Cap: $330,642,822,868
24h Vol: $15,711,067,523
BTC Dominance: 39.0%
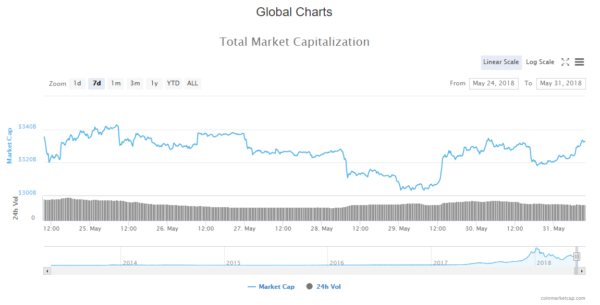
In the last 24 hours, cryptocurrency market capitalisation has been experiencing a sideways movement. Yesterday’s open was at $329B from which the evaluation fell to $318B and is now back on the levels of yesterday’s high.
The market is mixed in colour with only a slight percentage change. The biggest change among top 100 coins is experienced by Golem who is up by 15% and Theta Token 10%.
Best Crypto News Daily
In a bear market, negative news is overblown, and the good news is short lived. That’s why even though we have seen positive news in the last couple of days, it didn’t impact the market that much. In the last 24 hours, there is no market-moving news. These are some of the most significant headlines from the crypto sphere:
Quebec Gov’t Reportedly Lifts Moratorium on Energy Sales to Crypto Miners
The government of Quebec will reportedly lift its moratorium on the sale of electricity to cryptocurrency miners, sources familiar with the matter told local news Le Journal De Montreal May 30. According to Le Journal, the Quebec government wants to “avoid missing the ship” on cryptocurrency, and as such is moving ahead to lift the moratorium.
Central Bank Of Russia: Crypto Assets Do Not Pose Risk to Global Financial Stability
The Central Bank of Russia released a report May 30, stating that crypto assets do not currently threaten global financial stability as the global volume of crypto transactions is very low. The research paper states that instead of the term “cryptocurrency,” the Financial Stability Board proposes to use the term “crypto asset,” which can be considered a financial asset based on the application of cryptography and distributed ledger technology.
Low Capitalization, Institutional Exposure Make Crypto Low Risk, Says Dutch Gov’t Report
A branch of the Dutch government has recently released an economic risk report, claiming that cryptocurrencies present a low risk to financial stability in the country, according a report published on May 29. The report was prepared and published by the Netherlands Bureau for Economic Policy Analysis (CPB).
Ethereum Classic Upgrades Network Protocol to Ensure Mining Remains Viable
Ethereum Classic (ETC) has now successfully implemented a protocol upgrade that will ensure that mining remains viable in future, according to ETC Block Explorer data yesterday, May 29.
BlockShow in Berlin Sets New Record With Largest Turnout Yet
The BlockShow Europe 2018 conference ended yesterday, May 29, after two days of panels and speakers, including Wikipedia founder Jimmy Wales and BTCC co-founder Bobby Lee. Speaking about the conference, Bobby Lee told Cointelegraph:
“I think conferences are important to get the word out there, to educate people and help them learn about cryptocurrency and blockchain. This is how we get the next billion people on-board.”
Analysis
BTC/USD
From yesterday’s open, the price of Bitcoin has increased by 1% so the price hasn’t changed much. The price fell to around 7300$ and is now back to the levels of yesterday’s high at 7530$.
On the daily chart, we can see that the price is still below the baseline support (bold black line) which serves as resistance but above the intermediate support at 7470$.
On the hourly chart, we can see what happened yesterday after the cluster, the price fell below the support line with one candle on the hourly chart. Currently, we can see another cluster being formed bearly above yesterday’s high, on the ‘below the baseline support’ as there’s a strong resistance on these levels.
Market sentiment
Hourly chart technicals signal a strong buy.
Oscillators are on buy, and moving averages a strong one.
Pivot points
S3 6822.9
S2 7112.4
S1 7243.7
P 7401.9
R1 7533.2
R2 7691.4
R3 7980.9
ETH/USD
From yesterday, the price of Ethereum fell from 573$ to 544$ and is now back at the levels of yesterday’s open.
Looking at the daily chart we can see that the current candle is green, but hasn’t exceeded yesterday’s candle wick and two prior candles highs as well.
Zooming into the hourly chart we can see that the price is again above this intermediate uptrend support line, but there’s now higher high which is a bearish sign.
Market sentiment
Hourly chart technicals signal a buy.
Oscillators are on buy, and moving averages on a strong one.
Pivot points
S3 474.37
S2 517.91
S1 537.46
P 561.45
R1 581.00
R2 604.99
R3 648.53
XRP/USD
The price of Ripple is on the same levels as yesterday’s open which is at 0.6$. The price fell further below to around 0.587$ but is now again on the same levels as yesterday.
On the daily chart, we can see that the current candle hasn’t exceeded the previous five candles highs which is a bearish sign.
On the hourly chart, we can see that the price is currently above the downward channel resistance line. But that doesn’t act as a bullish sign, as this also happened in the past, and still, the price fell further below.
Market sentiment
Ripple is in the buy zone, as indicated by hourly chart technicals.
Oscillators are on buy, and moving averages are signalling a strong buy.
Pivot points
S3 0.51319
S2 0.55858
S1 0.57956
P 0.60397
R1 0.62495
R2 0.64936
R3 0.69475
Conclusion
Best Crypto News Daily: The prices of three major cryptos haven’t exceeded the prior high, even though we have seen a lot of buying in the last 24 hours. This means we are still in a downtrend. Indicators are bullish as they are lagging behind, but charts and price action paint a clear bearish picture.