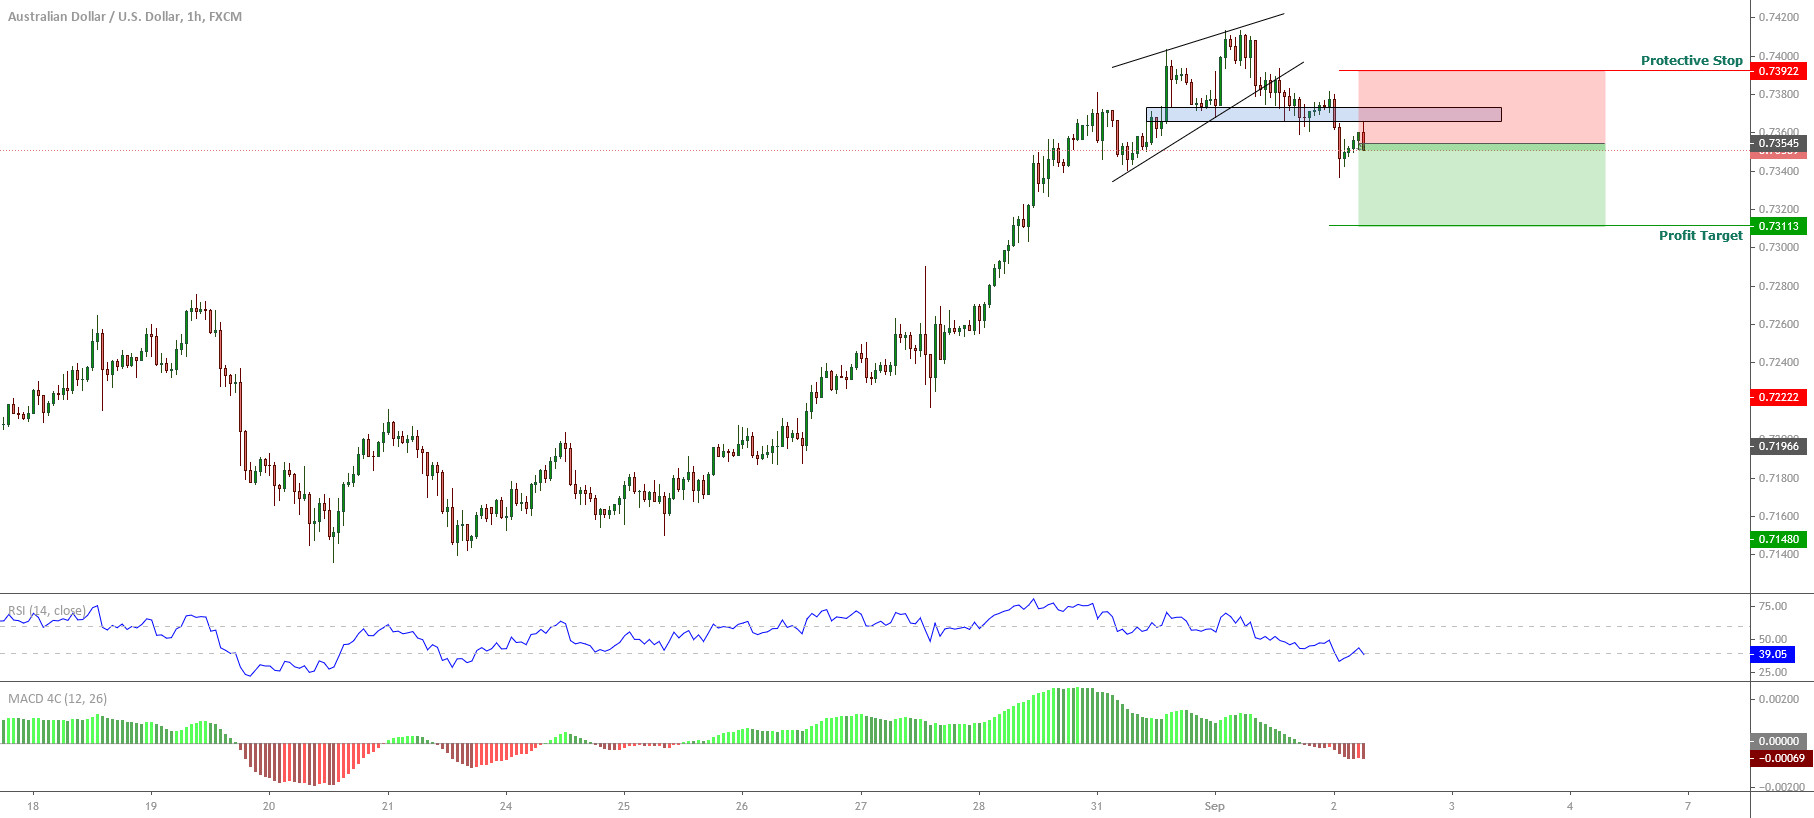
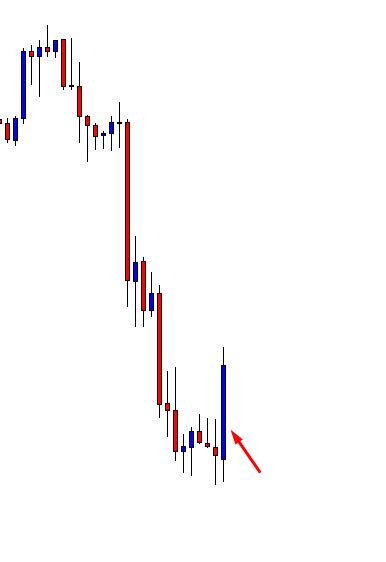
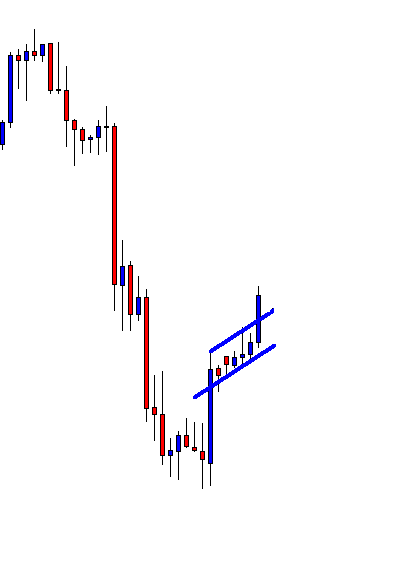
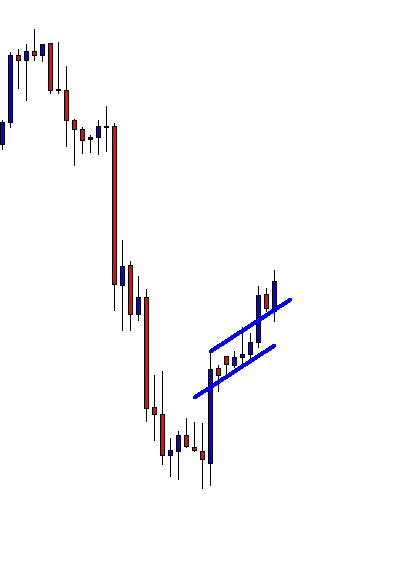
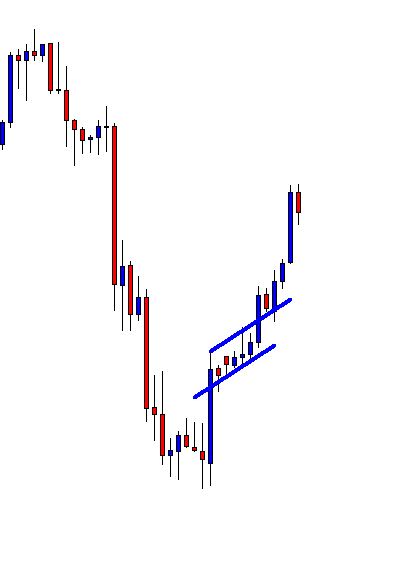
The AUDUSD pair, in its hourly chart, exposes a downward sequence after surpassed the psychological barrier of 0.74 on the Tuesday trading session. In the same way, the re-test and bounce of the U.S. Dollar index at 91.75, the lowest level since mid-May 2018, lead us to expect further movement in favor of the Greenback for the following trading sessions.
From the next chart, we observe a downward movement after the breakdown of an ascending wedge pattern. The consolidation below the last relevant swing at 0.7365(blue box) and the RSI oscillator moving below level 40 confirms the intraday bearish bias that should lead the coming sessions.
The movement below the level 0.7365 carries us to weight bearish positions expecting intraday profits at 0.7310, which corresponds to the last consolidation level of August 28th.
Our invalidation level is located at 0.7392, which corresponds to the first congestion zone after the first drop of the ascending wedge pattern.
The GBPJPY cross in its hourly chart exposes the price action moving below an ascending wedge that found resistance in the zone of level 139 from where the cross started to retrace.
In this context, the pierce and close below the level 138.3 could represent a short-term resistance from where the price could confirm potential bearish incorporations. On the other hand, the RSI oscillator moves below level 40, which leads us to confirm the intraday bearish bias.
We expect a limited recovery toward the zone of 138.25 from where the price could find fresh sellers, which could drag the cross until the level 136.6, which corresponds to last July 23rd high.
Finally, the invalidation level of our bearish scenario locates at 138.83.
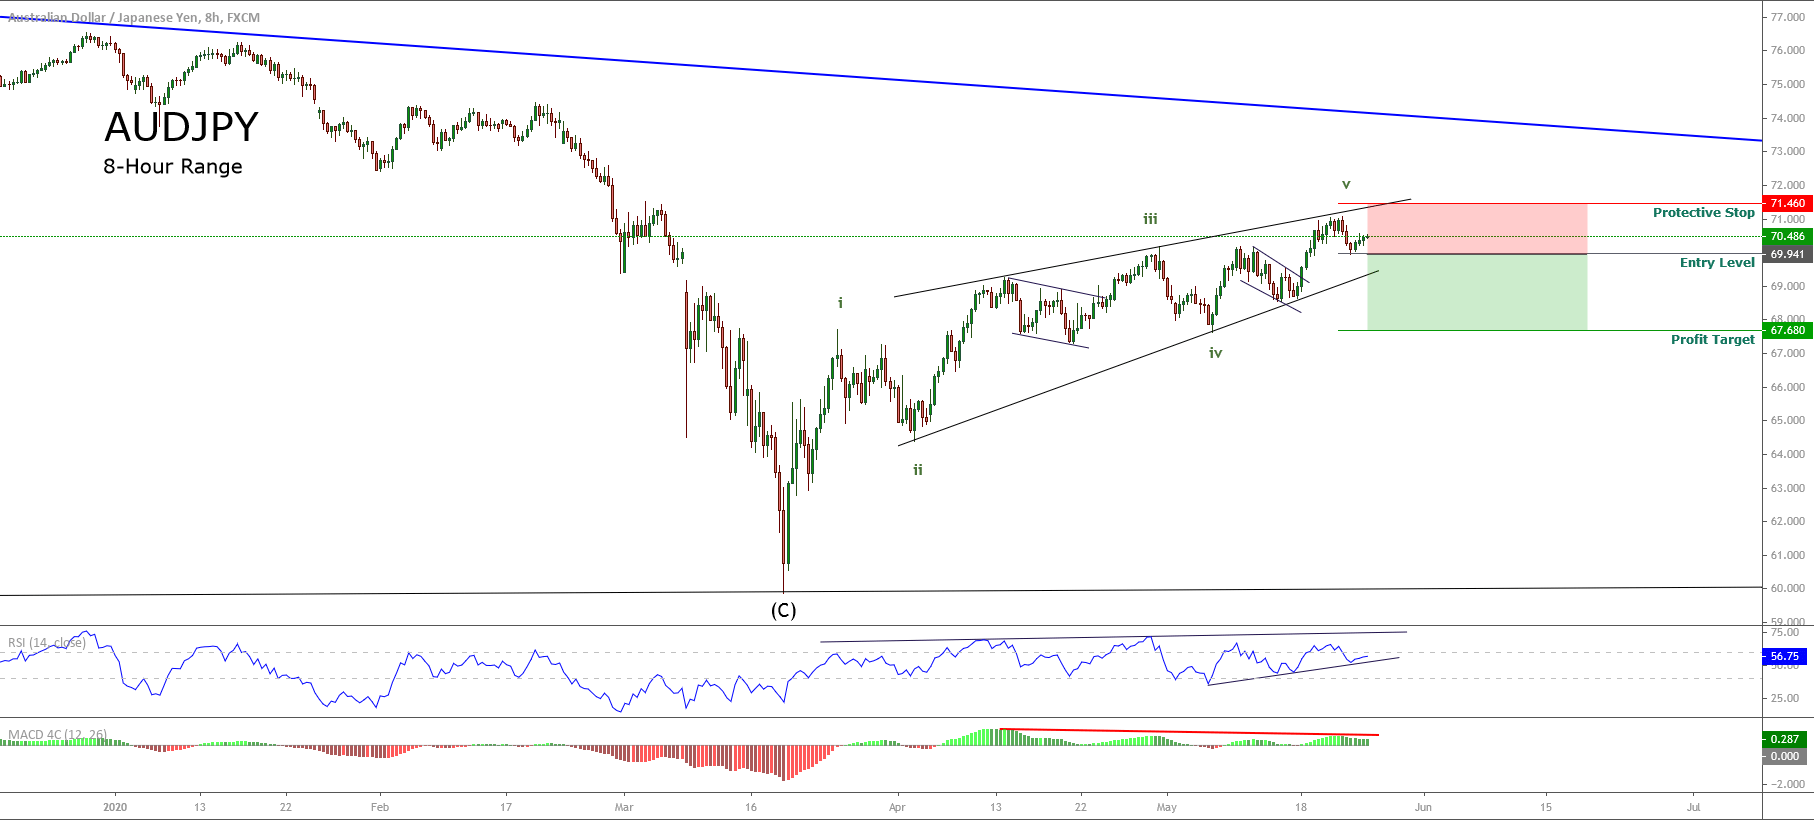
The AUDJPY cross, in its 8-hour chart, shows the price action advancing in an ascending wedge pattern, which suggests the bearish continuation of the previous bearish trend.
Until now, the Oceanic cross completed four waves of Subminuette degree identified in green. For the following trading sessions, we expect a limited upside, which could develop a thrust as a false breakout completing the ascending wedge pattern.
Our conservative scenario considers a sell-side position if the price breaks and closes below the last low at 69.941. The potential bearish target locates at the end of wave iv in green at 67.680.
The bearish scenario will be invalid if the price soars and closes above 71.460.
I want to stress, again, that the frequency and positive expectancy of patterns in technical analysis will vary from market to market. Most of the literature is written for the stock market, which is an overwhelmingly long-biased market. So, bullish patterns perform much better than bearish patterns in the stock market. I don’t have any real statistics to reference other than my years of trading experience. It has been my experience that wedge patterns are one of the most profitable setups in the forex market.
Wedges look like (and in fact, are) extended triangles. Wedges are made of two trend lines that are drawn just like a triangle. The difference between wedge patterns and triangle patterns is simple: the trendlines in a wedge pattern point in the same direction. Ascending triangles have flat tops and a rising bottom. Descending triangles have flat bottoms with declining tops. Symmetrical triangles have a downtrend line and an uptrend line. Wedges are different. Rising wedges have a trendline both above and below price sloping up. Falling wedges have a trendline both above and below, but sloping down. Depending on the technical analysis material you read, you will see wedges that may look like channels, and that is fine – many do.
Wedge patterns should tell you one thing: the end is coming. Because wedges have two trendlines that point in the same direction, the slope of the move is often extreme and is indicative of a climax move. These are incredibly profitable and favorable patterns when you spot them – and they are horrible to trade against if you are trading inside of them. If you read Bulkowski’s work, you’ll know that he recommends at the trendlines in a wedge should be touched at least five times in order for the wedge pattern to authentic. This is true in the stock market as well as in the forex market.
Rising Wedge
Rising Wedge
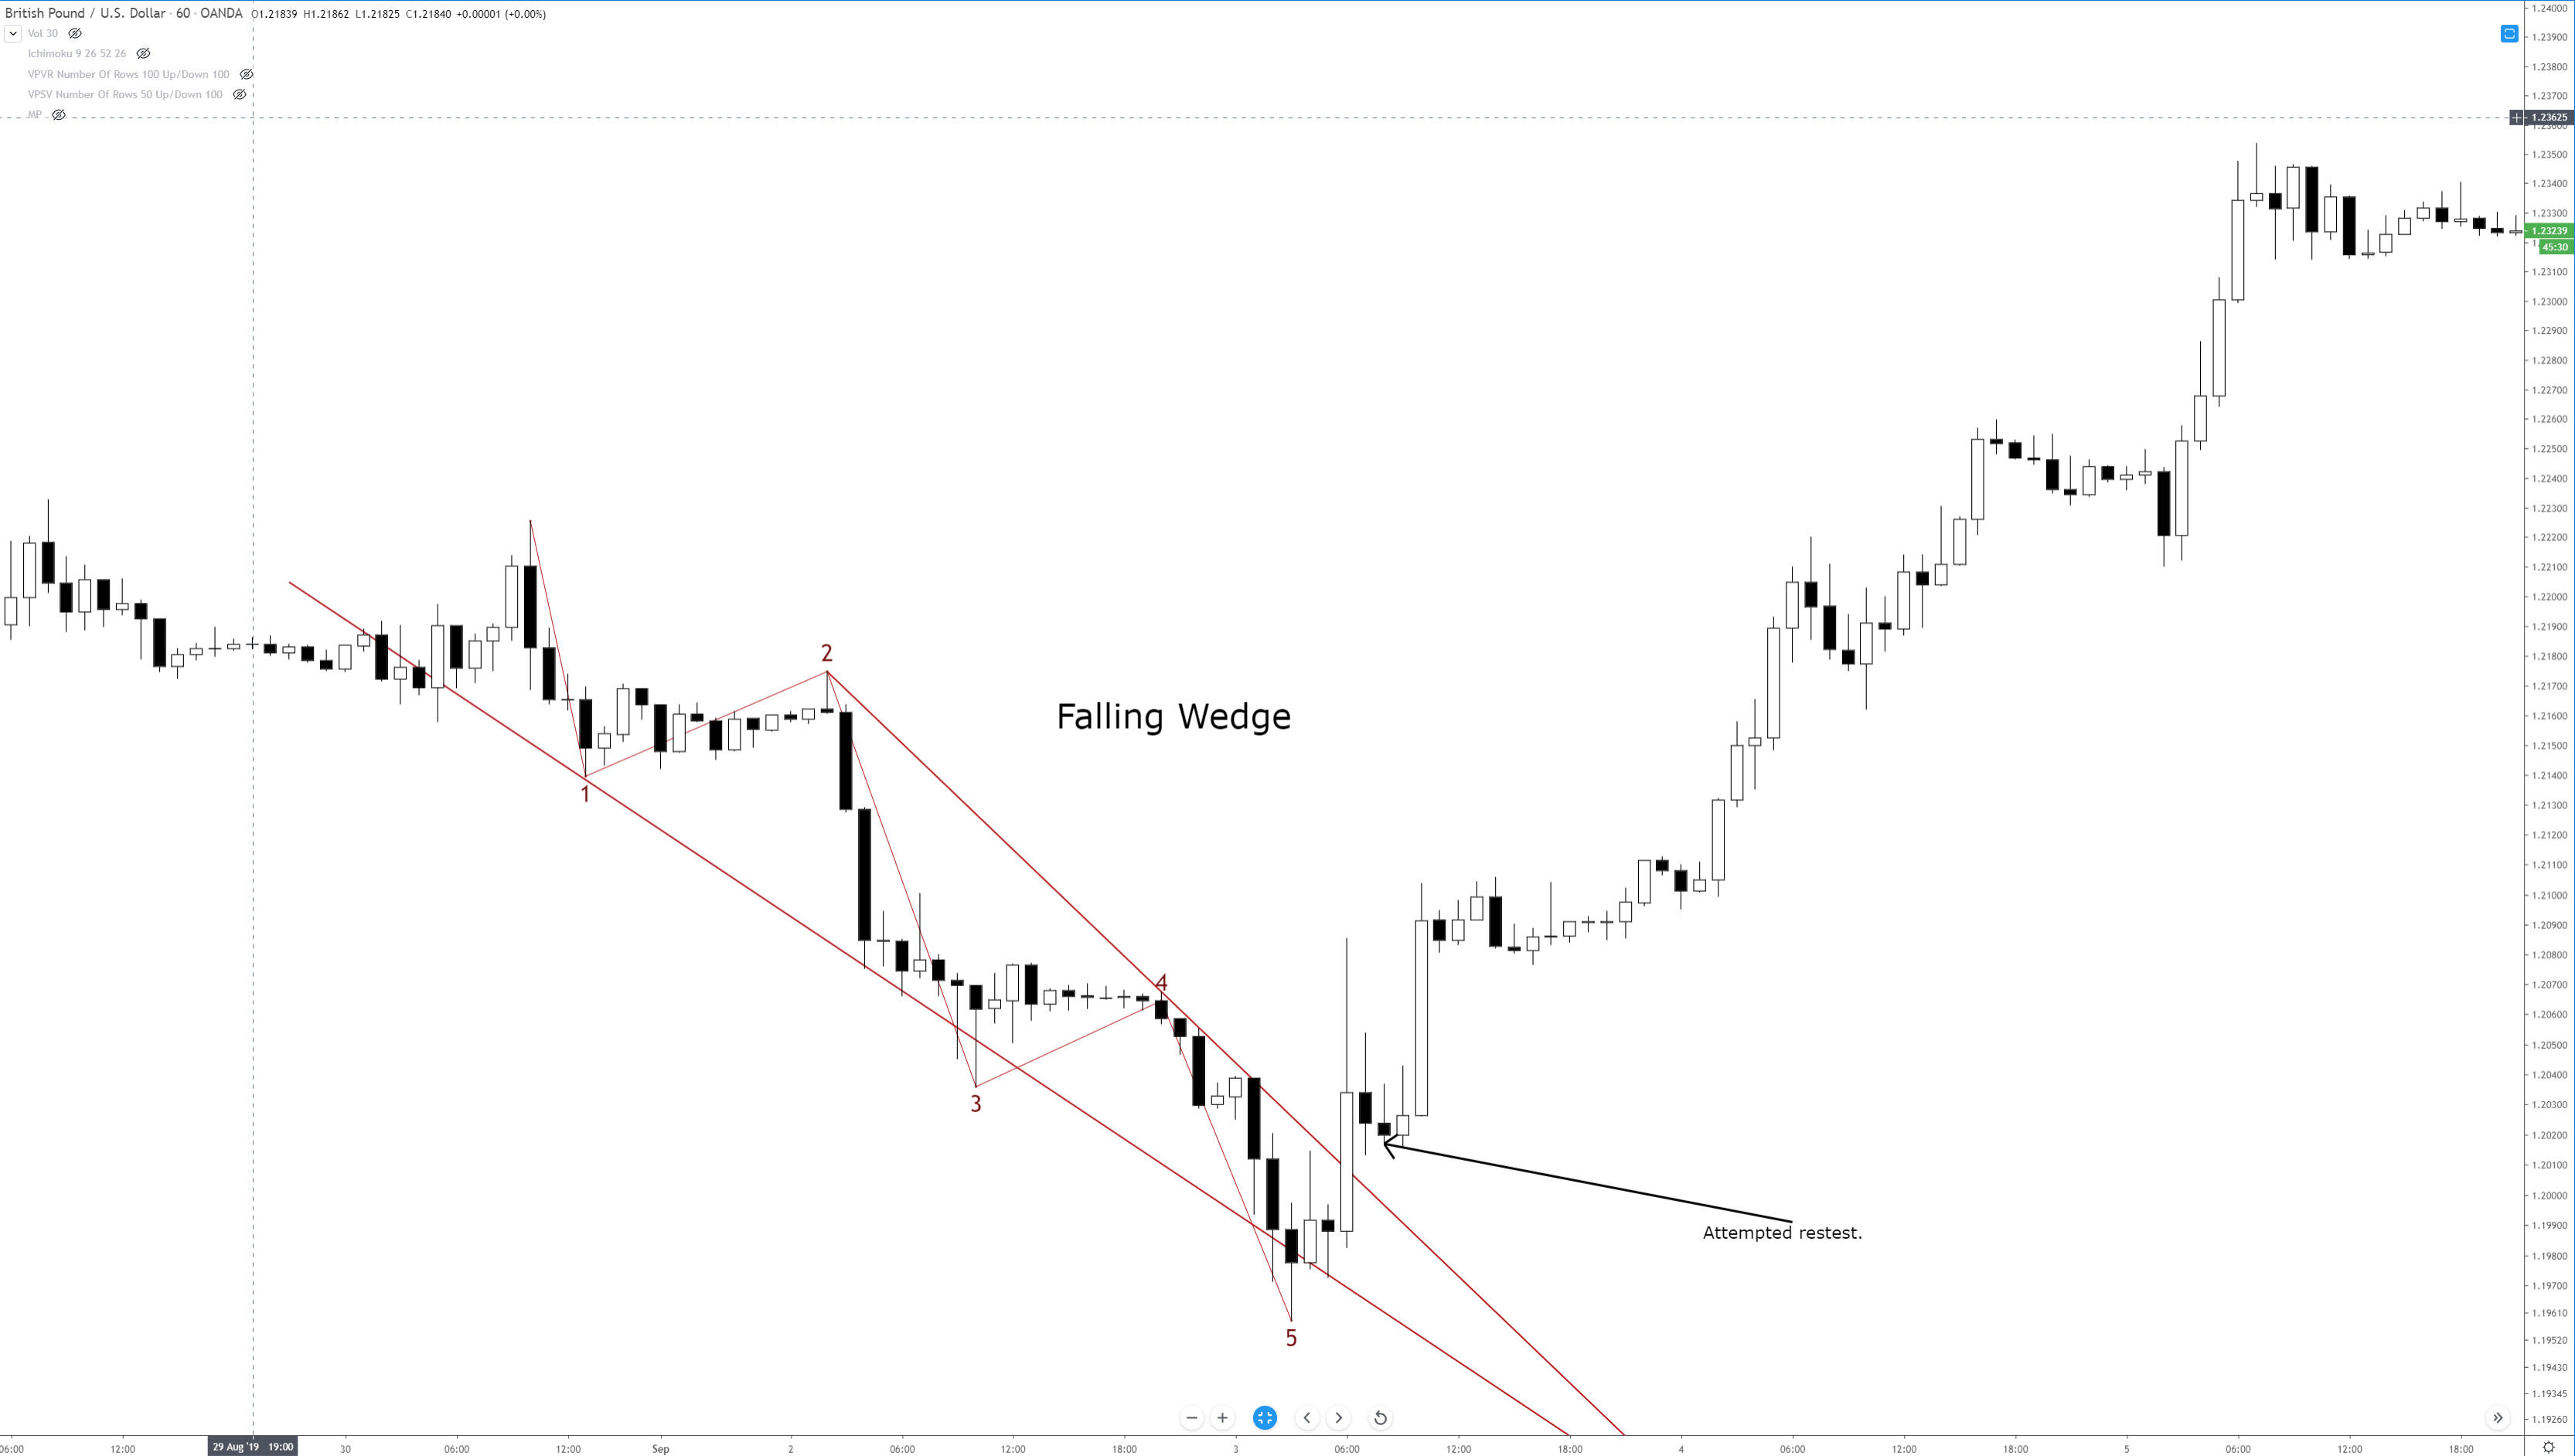
You might think that a rising wedge pattern shows up at the top of a trend, and it often does. But you will also find the rising wedge appear at the bottom of a trend. When you see the rising wedge appear after a prolonged downtrend, be careful! The rising wedge that forms after a long bear move is often a continuation pattern. An easy way to think of the rising wedge is that it is an overwhelmingly bearish pattern. It doesn’t matter where it shows up in any trend – it is an extremely bearish pattern.
When I am trading the rising wedge, I generally take the initial breakout that moves below the second to last test of the bottom trendline. The example above shows that there is no immediate retest of the breakout lower. Retests do happen, but they are less frequent than what we see in the ascending, descending and symmetrical triangles.
Falling Wedge
Falling Wedge
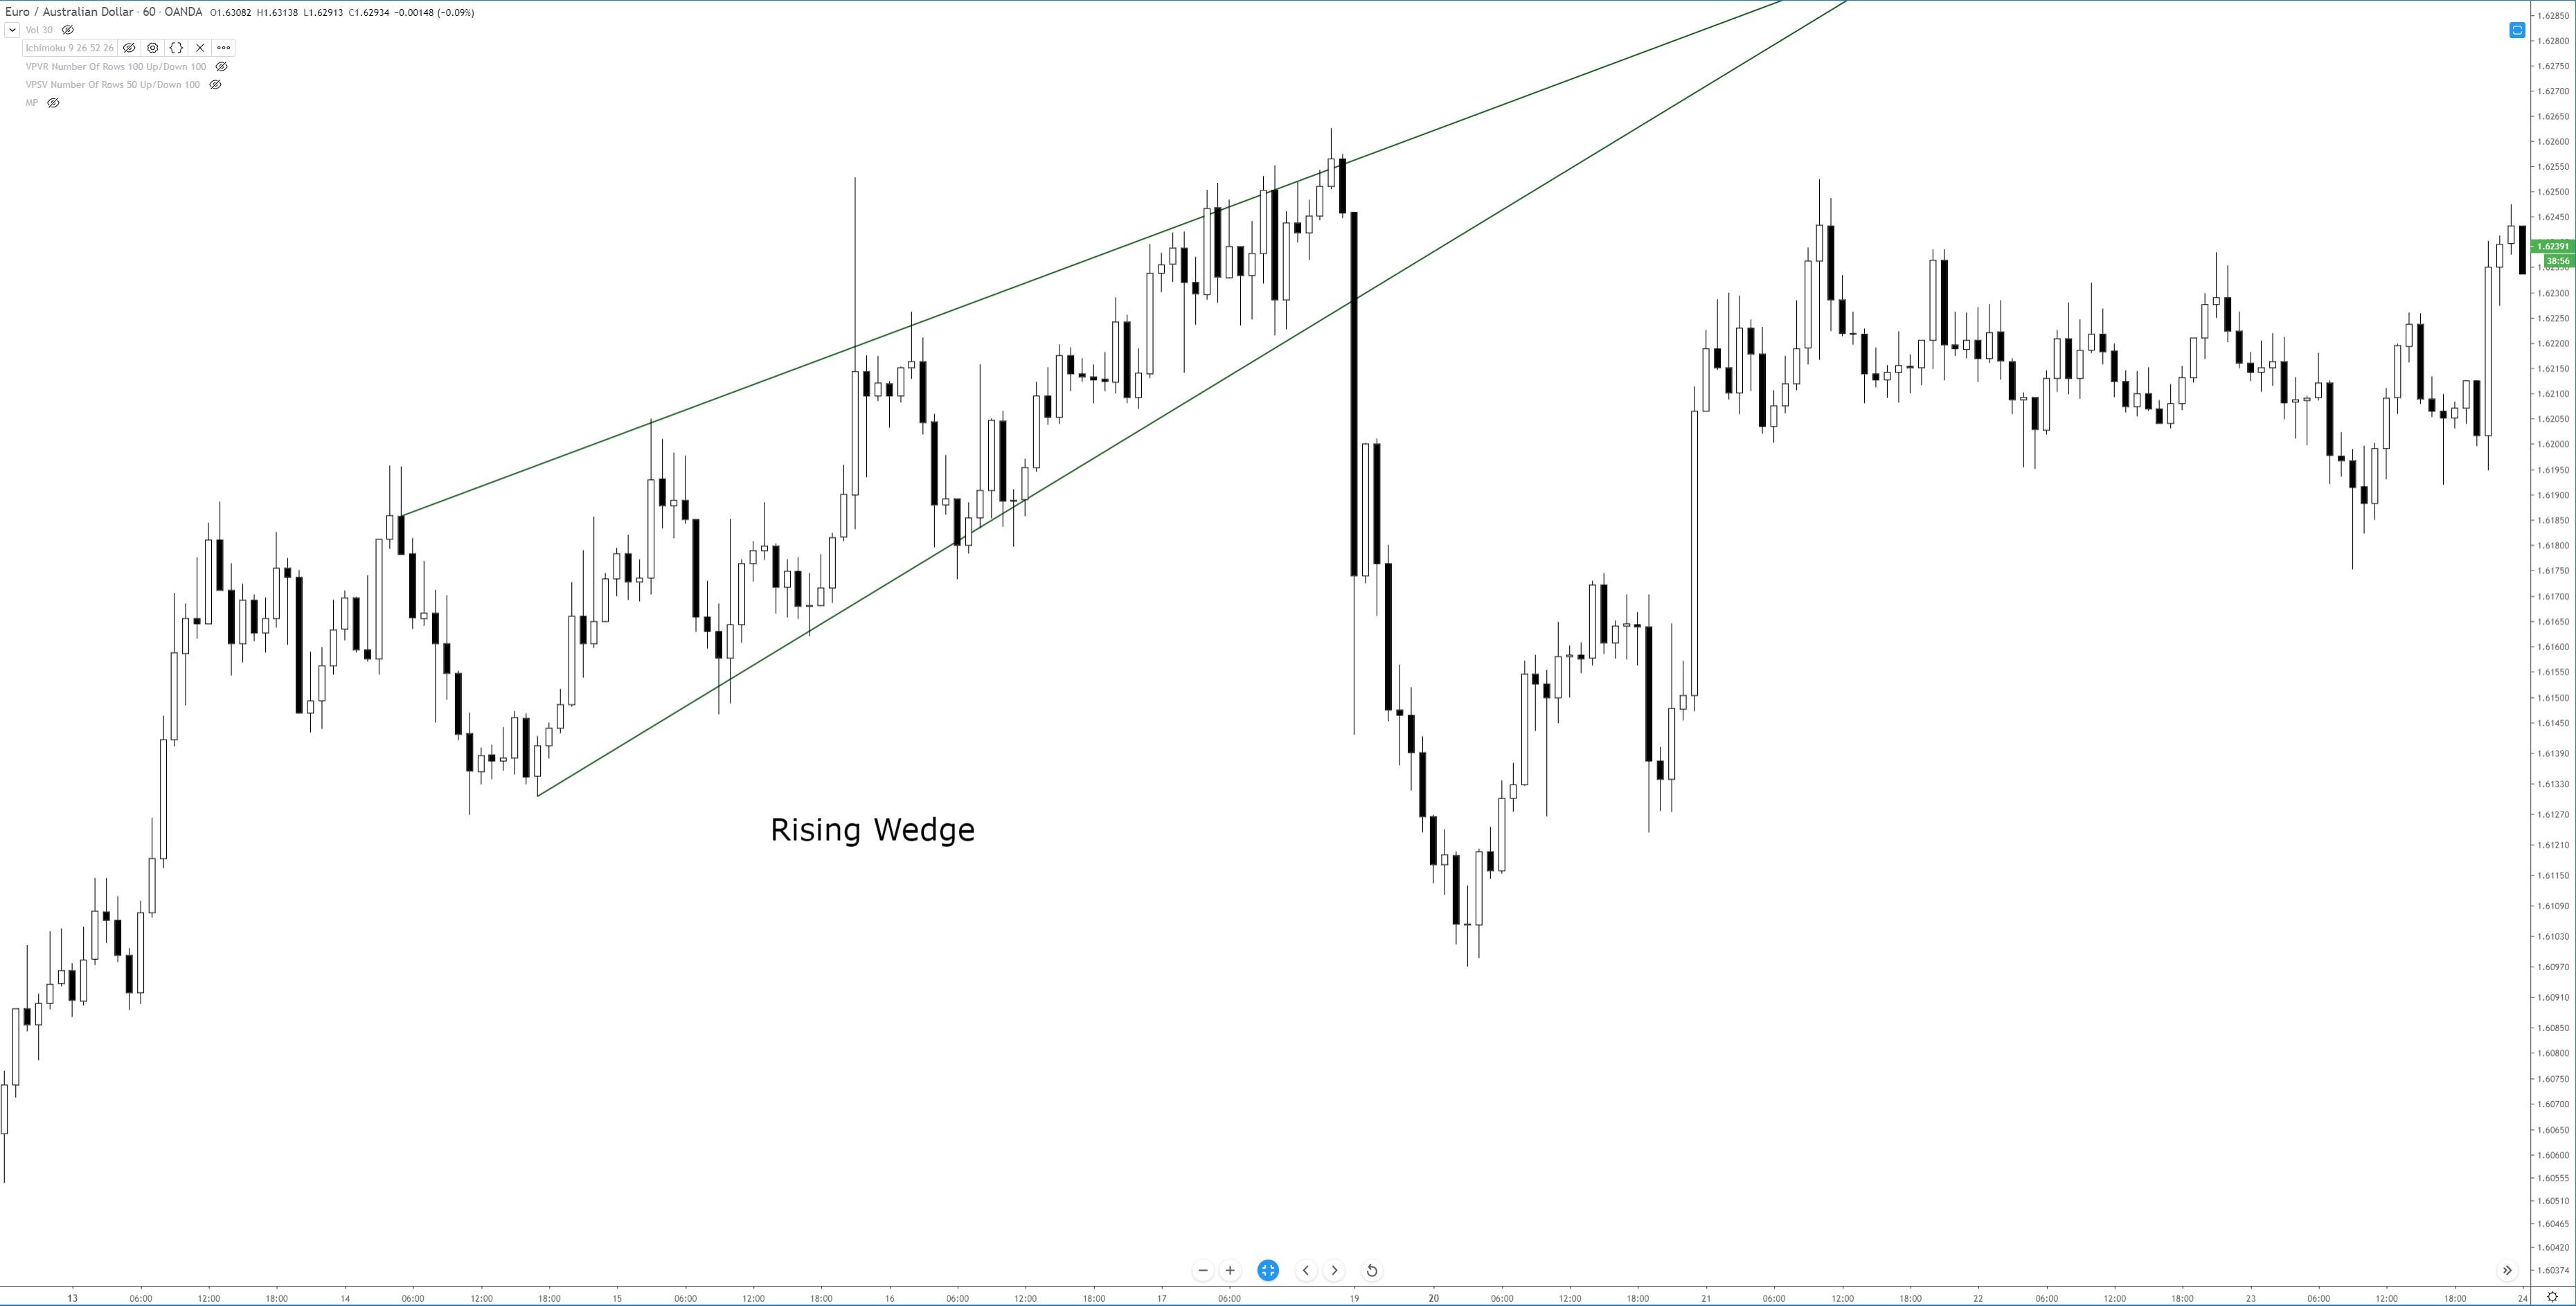
The inverse of the rising wedge pattern is the falling wedge pattern. It can show up at either the end of an uptrend or a downtrend. If you see a falling wedge that occurs at the top of an uptrend, then you could we witnessing a false breakdown lower and see a resumption of the prior bull move. If you see the falling wedge at the end of a downtrend, then you can expect a swift reversal or deep throwback. Just like the rising wedge, the falling wedge is heavily biased towards one direction: overwhelmingly bullish.
On the image above, I’ve added an Impulse Wave to show how you can use Elliot Waves to help determine whether or not a wedge pattern is valid. Remember: Bulkowski said that that a wedge pattern is only confirmed when the trendlines have been tested at least five times. Another condition on the chart above that we didn’t see on the falling wedge is the attempted retest of the break. Again, retests are common in all patterns, but they are definitely less frequent with wedge patterns – that has been my experience with them in forex markets.
When trading the falling wedge, I like to enter when price moves above the second to last swing high. On the chart above, the entry would be above wave four.
Sources:
Kirkpatrick, C. D., & Dahlquist, J. R. (2016). Technical analysis: the complete resource for financial market technicians. Upper Saddle River: Financial Times/Prentice Hall.
Bulkowski, T. N. (2013). Visual guide to chart patterns. New York, NY: Bloomberg Press.
Bulkowski, T. N. (2008). Encyclopedia of candlestick charts. Hoboken, NJ: J. Wiley & Sons.
Bulkowski, T. N. (2002). Trading classic chart patterns. New York: Wiley.
Financial traders follow many charts, patterns, and trading strategies. Each one has its own advantages and disadvantages. Nevertheless, there is a saying, ‘the simpler, the better.’ In the financial markets
Financial traders follow many charts, patterns, and trading strategies. Each one has its own advantages and disadvantages. Nevertheless, there is a saying, ‘the simpler, the better.’ In the financial markets
Financial traders follow many charts, patterns, and trading strategies. Each one has its own advantages and disadvantages. Nevertheless, there is a saying, ‘the simpler, the better.’ In the financial markets, especially in the Forex market, a trader cannot deny this truth.
Let us demonstrate an example of this.
The price heads down with strong bearish momentum. The sellers are to wait for an upside correction and a breakout at the support to make it more bearish. Let us proceed with what happens next.
The price has an upside correction, but it did not make a breakout at the support. It instead produces a huge bullish engulfing candle at Double Bottom support. Things are different now. Traders are to look for a long opportunity on the chart.
The price is bullish, but it gets caught within an ascending channel. A breakout at either side attracts traders to trade in this chart. The chart shows that the price makes an explicit breakout towards the upside. Ideally, the buyers shall flip over to their trigger chart to find a long entry. Let us find out whether they find any on the next candle.
The price does not make a breakout at the highest high of the breakout candle. Thus, the traders do not find an entry on the triggered chart. However, see the second candle (bullish candle). It makes a breakout (horizontally) at the highest high of those two candles. The buyers are to flip over the trigger chart again to find an entry. Do they see an entry this time? Let us find out.
Yes, they do. The price heads towards the North with good bullish momentum, and it does not come down to the support of the breakout candle. By flipping over to the trigger chart for an upside breakout to trigger an entry, a trader makes some green pips.
In this chart, the price makes a breakout at ascending channel’s resistance just a candle earlier. That breakout does not create bullish momentum. However, when it makes a breakout at the horizontal resistance, it creates the momentum that the buyers look for. I am not saying a breakout at ascending channel’s support/resistance does not offer entry at all. It does. A breakout at horizontal support/resistance offers more entries than the channel’s support/resistance breakout. It is because; it is simple and easy to be noticed by most of the traders.
The Bottom Line
Does that mean we stop looking entries on a channel or other pattern breakout? No, we shall eye on those breakouts; flip over to the trigger chart and trigger an entry if the trigger candle makes a new higher high or lower low. It is just the probability that a breakout at horizontal support/resistance offers more than any other chart pattern. After all, it is simple, and we know “the simpler, the better’.
DAX 30 continues consolidating close to 13,000 pts.
EURUSD could make a new connector.
The United Kingdom keeps its unemployment rate at 4.2% in April.
DAX 30 continues consolidating close to 13,000 pts.
The DAX 30 once reached 13,000 points. It still has a bullish objective pending in the area of 13,250, where it should complete the upward cycle developed since April. The invalidation level of the upbeat sequence is 12,665.3.
EURUSD could make a new connector.
The EURUSD is developing an internal bearish cycle which could be completed in the area between 1.18096 and 1.17371. From this zone, we anticipate that a new bullish connector could begin. The first target of this new cycle is 1.2413, which corresponds to the invalidation level of the current bearish sequence. As long as the single currency does not fall below 1.1717, this scenario remains active.
USDCHF continues moving sideways in the parity zone consolidating the bullish cycle started in April. The Swiss currency has pending levels to be visited as a corrective sequence, possibly as an A-B-C pattern. The target area is between 0.98097 to 0.97507.
The United Kingdom keeps its unemployment rate at 4.2% in April.
The unemployment rate in the United Kingdom in April remained unchanged at 4.2%, as in the previous period. The GBPUSD pair continues consolidating maintaining the bearish bias. We expect the Pound to reach a new low that could happen in the area between 1.3433 to 1.3329. From this area, we will start looking for long positions. Should it fall below 1.3301, the Pound could go down to 1.3108.
The FTSE 100 continues with its bullish bias. However, the ascending wedge structure shows that this rally may be in an exhaustion phase. Short positions may be considered if the price falls below 7,687 pts., and the likely target would be 7,575.1.
UK PMI Services rebound from the lowest level for 21 months.
DAX is moving bearish as commented previously.
The Euro stagnates while waiting for employment data release of the United States.
EURCAD: Follow-up of the bearish cycle continuation.
UK PMI Services rebound from the lowest level for 21 months.
Business activity in the United Kingdom increased modestly in April reaching 52.8, bouncing from 51.7, the lowest level recorded 21 months ago. Chris Williamson, Chief Business Economist at IHS Markit, noted that “The economic growth rate remained decelerated moderately at the start of the second quarter.” Finally, he added that “the performance of the economy has continued to deteriorate”.
The FTSE 100 index has reacted downwards from our potential reversal zone, breaking down the rising wedge pattern, where we are already positioned short (Suggested in advance to our premium members).
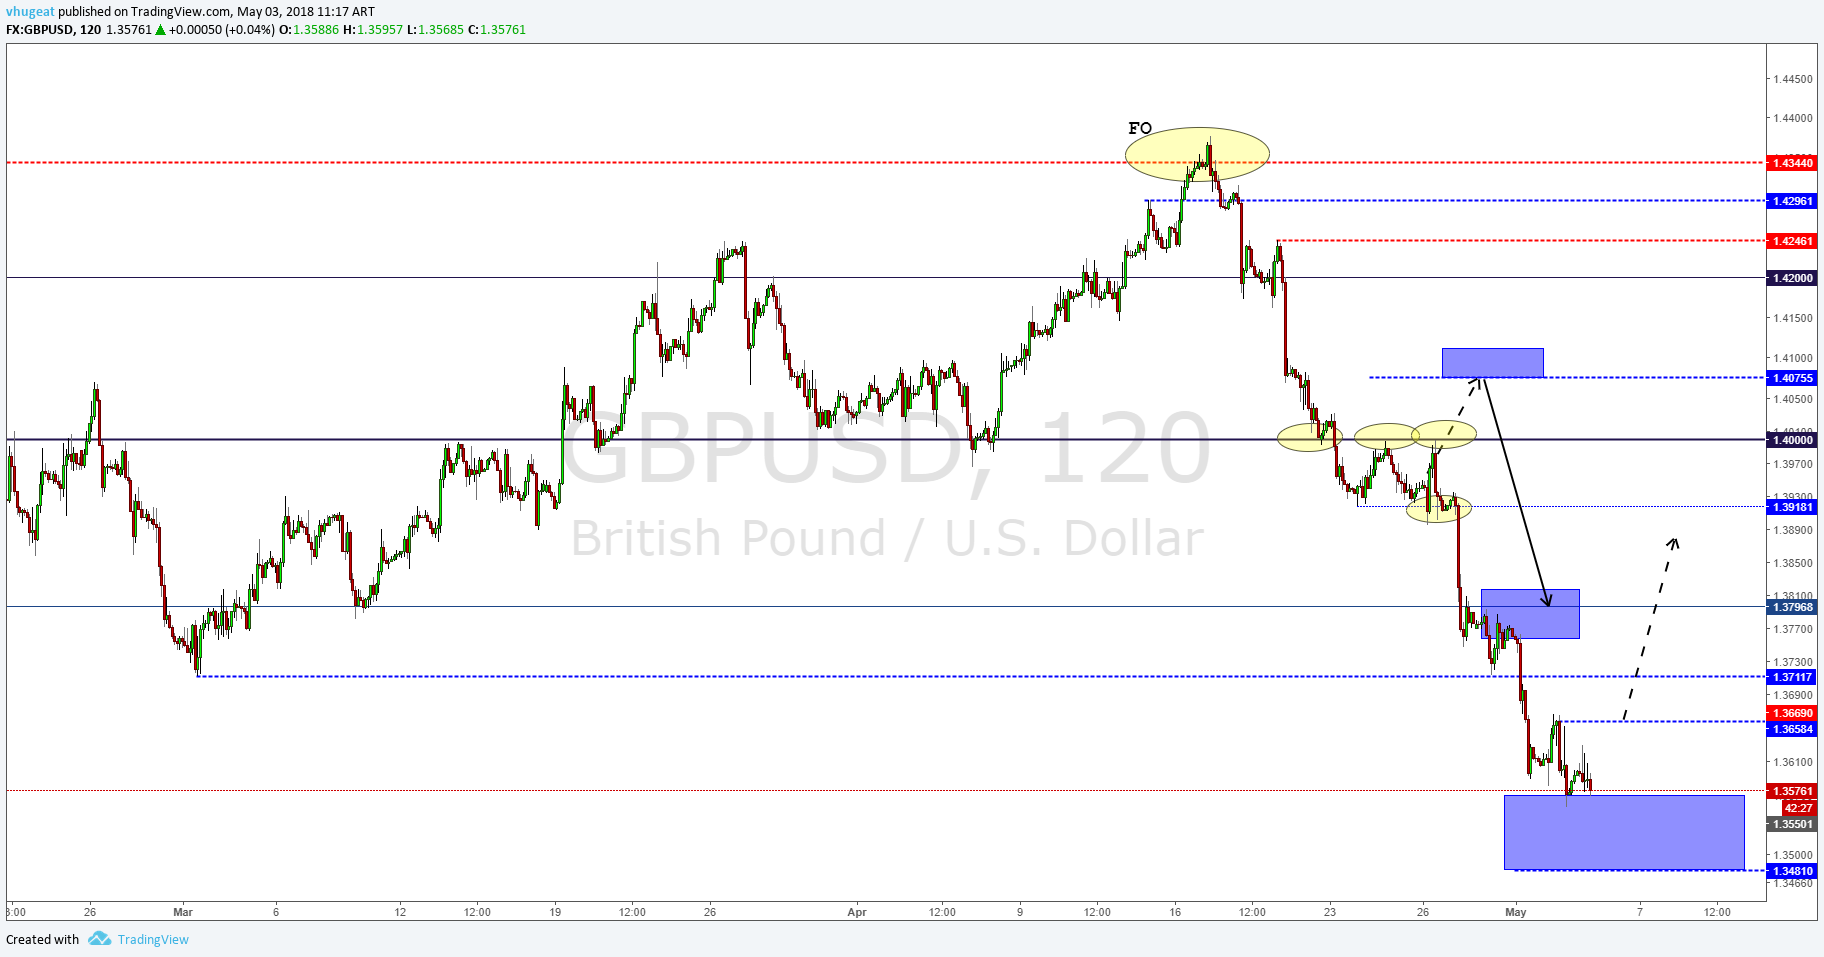
The pound continues with the bearish bias consolidating below 1.36. We still expect sterling to make a new low in the area from 1.35 to 1.3481. The level of invalidation of the bearish bias is above 1.365.
DAX is moving bearish as commented previously.
The DAX 30 follows the bearish bias in a similar way the FTSE 100 did. This corrective move was also commented to our subscribers in our previous updates. We expect the German index to move down to the 12.622 pivot level, which by traditional technical analysis, should switch from resistance to support.
The Euro stagnates while waiting for employment data release of the United States.
The single currency is moving in a range between 1.195 and 1.20 pending the employment data that will be published tomorrow by the U.S. Bureau of Labour Statistics. The EURUSD pair could make a new lower low, likely near to 1.190, from where it could bounce up to 1.207.
The USDCHF is forming a double top pattern, which would be activated if it breaks below 0.995. By inverse correlation with the EURUSD pair, and considering that it still has space to make a new lower low, the Swiss currency could make a higher move as a buyer trap or 2B Pattern.
EURCAD: Follow-up of the bearish cycle continuation.
On April 20th we commented to our subscribers that the cross EURCAD had a new lower low to develop, whose target could be in the area from 1.54 to 1.5310. Today, we see that the cross has reached our forecasted area. Now we should start to take profits and wait for the price action to show a new trading opportunity.
Markit PMI release: Eurozone growth stays lower, and the US rises solidly.
Main European indexes closed with gains.
Markit PMI release: Eurozone growth stays lower, and the US rises solidly.
After the publication of Markit PMI data from both the Eurozone and the United States, we see two opposite sides of economic dynamism. On the one hand, the Eurozone economy remained unchanged in April compared to March, maintaining the sector index of 55.2; manifesting a sense of stagnation in economic growth. Chris Williamson, Chief Business Economist at IHS Markit, said: “The decline in January’s high is neither surprising nor alarming.”
On the other hand, in the United States, the private sector is showing signs of robust growth in both the Manufacturing industry and the Services sector. The Manufacturing PMI Index grew to 56.5 in April, the highest level in 43 months, above the 55.6 reported in March. Likewise, the service sector reported an increase in activity that reached 54.4 in April, compared to the 54 published in March, the highest level reached in two months.
The Euro has broken below the triangle pattern that was respected until last week. Currently, the pair is testing support at the psychological level of 1.22. We keep our bearish vision with the target between the 1,215 and 1,207 area.
The pound for its part, after having broken below 1.40, we expect a bearish continuation to the levels of 1.379.
The CHF, which is correlated inversely with the common currency, gives us signs of bullish continuity, being able to bring the price up to 0.9836 before making a corrective move.
Main European indexes closed with gains.
The FTSE 100 continues to advance in a rising wedge pattern towards the blue box area between the levels of 7,456.3 to 7,523. From this zone, it should react to form a potential new bearish leg.
The DAX 30 is again looking to overcome the 12,622 pivot level. If it does overcome it, the movement could reach over 13,000 pts.


.")
.")


