Swiss go to the polls to vote on limiting EU immigration: – where next for the Franc?
Thank you for joining the forex academy educational video. In this session, we will be looking at the Swiss who go to the polls to decide on limiting EU immigration and what this might do for the Swiss Franc.
Switzerland is a beautiful country with magnificent scenery and a high standard of living. It has become extremely attractive for people from the EU to visit via the open borders policy, and subsequently move and set up home in the country.
The Swiss national bank or SNB sets monetary policy within the country of Switzerland. The Swiss Franc, which is commonly referred to as swissie, or CHF, it is the fifth most traded currency in terms of global FX liquidity behind the United States dollar. It is considered to be a major currency. It is considered to be a safe haven currency because of the country’s economic stability, low-interest rates – making it attractive to borrow in, and making the currency attractive as a hedging mechanism. The SNB prefers a weaker currency to make exporting more attractive. 65% of its export market is with the EU.
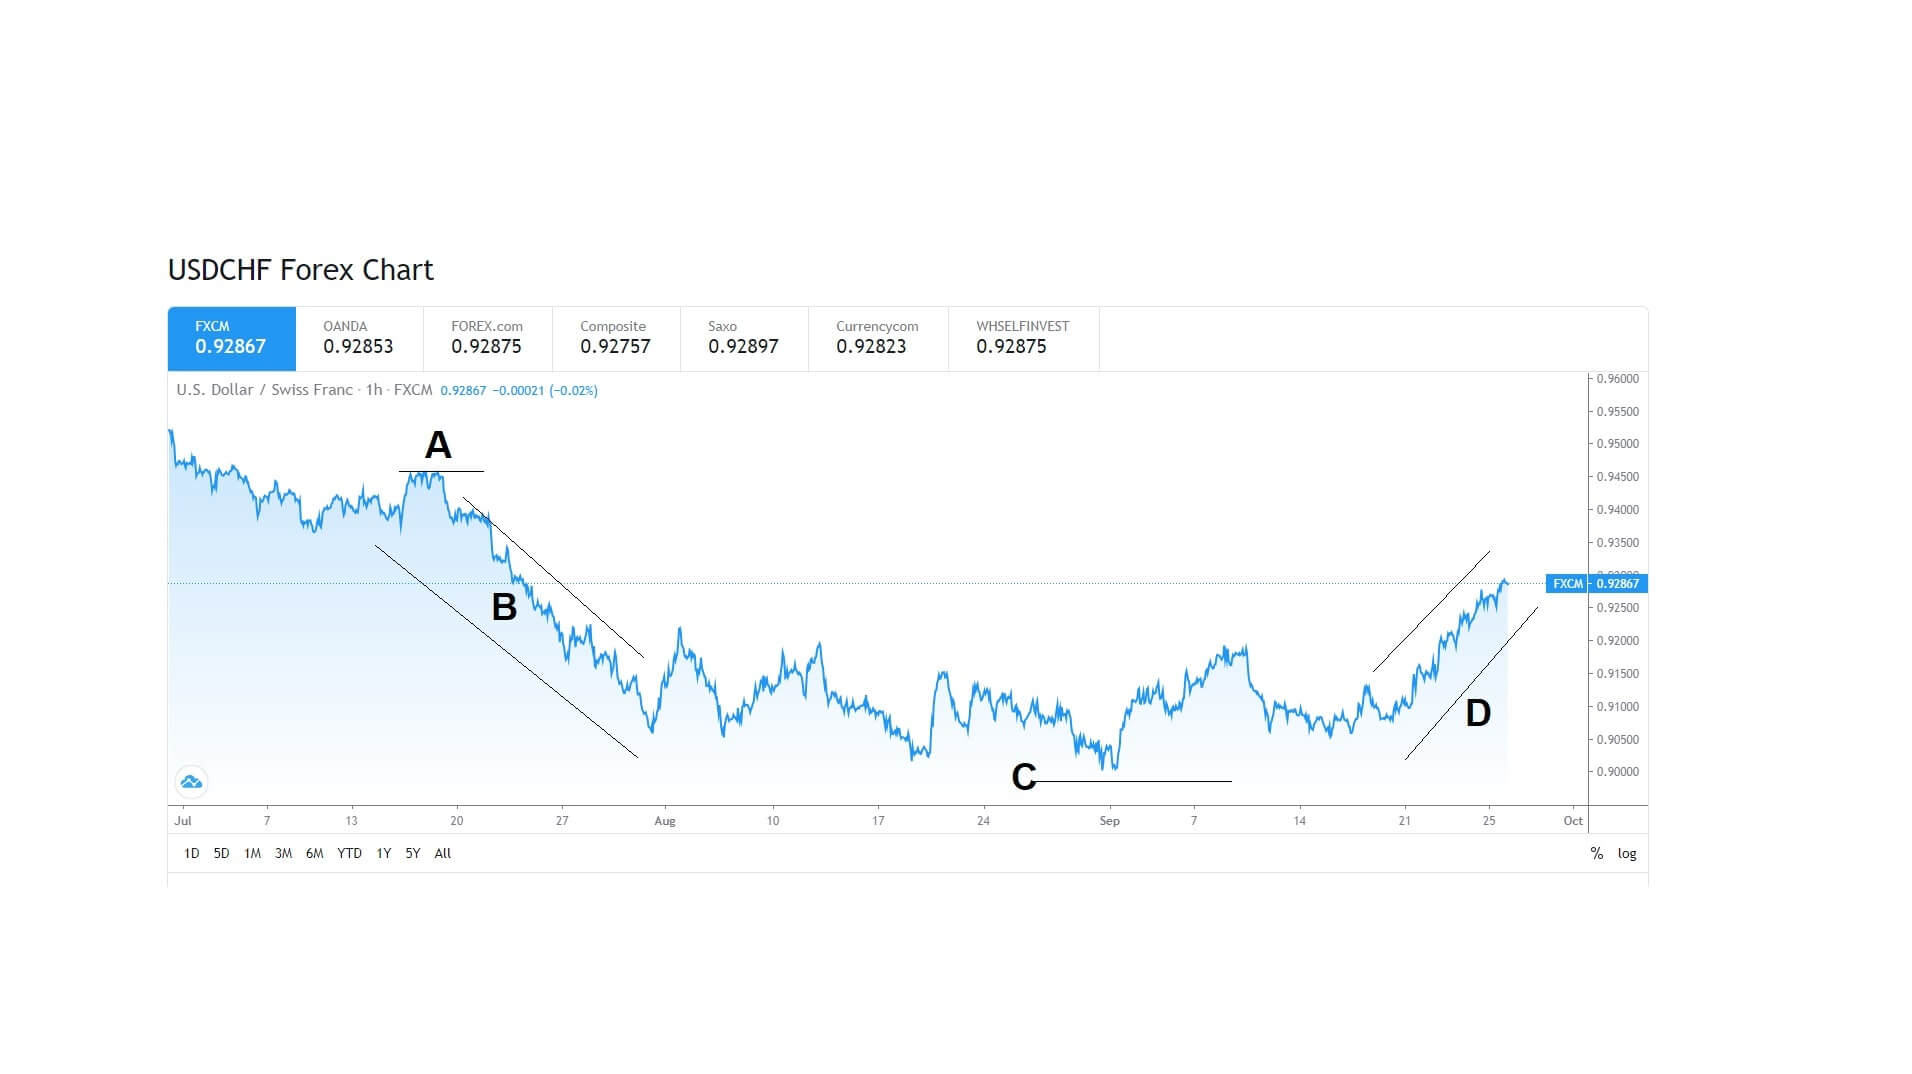
This chart shows the US dollar CHF pair going back to July, the area marked position A shows a high of 0.9465, followed by a bear trend which takes us down to a low of 0.9000, which is a major psychological area of support for the pair, and then a subsequence bull run to its current level of 0.9286.
On Sunday, the 27th of September, Swiss voters go to the polls to vote on limiting immigration from the EU, which has seen a sharp increase in the last ten years of 30%. The vote, known as Ecopop, could see immigration from the EU capped at just 0.2% of the overall population, thus restricting migrants to around 16,000 per year and effectively closing its borders to the EU. It also calls for 10% of its overseas aid to be spent on family planning projects in developing countries.
This is where things get complicated because the Swiss has certain rights and trading privileges, including a free trade deal, and is based on the Swiss open borders’ agreement it signed up to as a part of its preferential trading pact with the EU. 25% of its workforce comes from within the EU. The counter-argument is that if you lose them, you lose the high-quality life that everyone in Switzerland enjoys.
A breach of this mechanism would throw the agreement into the long grass and potentially cause economic uncertainties with the trading partners with which could cause the levies being introduced by the European Union, which in turn would have a negative impact on the Swiss economy. While this may be somewhat negated by a weakening of the Franc, it will likely cause volatility in the markets, especially for the USDCHF and other CHF pairs. More worryingly, it could also cause volatility in the Euro, because this will look similar to the Brexit situation, to a degree, whereby major countries within the block and those exterior trading partners are losing faith in the closely tied and constrictive trading arrangements.
The Swiss Franc, otherwise known under the code CHF, is the official currency of Switzerland and Liechtenstein as well as legal tender in Italy. Since its creation in 1850, the CHF has historically been marked by Switzerland’s neutral stance in war situations, making people around the world build trust in Swiss banking institutions. People’s tendency […]
The Swiss Franc, otherwise known under the code CHF, is the official currency of Switzerland and Liechtenstein as well as legal tender in Italy. Since its creation in 1850, the CHF has historically been marked by Switzerland’s neutral stance in war situations, making people around the world build trust in Swiss banking institutions. People’s tendency […]
The Swiss Franc, otherwise known under the code CHF, is the official currency of Switzerland and Liechtenstein as well as legal tender in Italy. Since its creation in 1850, the CHF has historically been marked by Switzerland’s neutral stance in war situations, making people around the world build trust in Swiss banking institutions. People’s tendency and willingness to keep their money in Switzerland appears to stem from the country’s image of being impartial and honorable under all circumstances, making the CHF and Swiss banks unique. For a period spanning across several centuries, Swiss banking institutions exuded the air of safety and fairness. Their firm approach of withholding information from government entities to preserve anonymity long supported the impression that they would leave on others, which unfortunately started to wither in the past few years.
The long-held belief in the credibility of Swiss institutions and their distinctive conduct was undermined directly once the news of sharing information with US and German governments broke out, consequently affecting their safe-haven status in the world of banking. Apart from the changes in Swiss banking systems and the effects they have had on the way they are perceived by others, it is interesting to note how Switzerland is quite a small country. Along with its size, the country’s GDP is thus also rather small, especially compared to some other countries. Despite these facts, the official currency of Switzerland unusually ranks fifth among all major currencies, which is directly proportionate to the quantity of money flowing into the country. The CHF, which is also called frank or swissie, is currently believed to be the most tightly linked to the price of gold among all other currencies. The history of Switzerland and the present state of the currency both point towards uniqueness and distinctiveness in comparison to other currencies and their respective countries to this day.
The Swiss National Bank
The Swiss National Bank, Switzerland’s central bank, was established in 1907. Unlike other central banks in the world, the Swiss National Bank (SNB) is an aktiengesellschaft (AG) that stands for a public limited company. This further implies that the SNB is a for-profit type of institution, thus resembling J.P. Morgan, Credit Suisse, or Deutsche Bank. Despite its uniqueness, the SNB still functions as a regular bank, i.e. it holds deposits, makes loans, etc. Aside from its standard banking-related tasks, the government of Switzerland additionally placed responsibility for the country’s monetary policy on the SNB. The bank is also in charge of Swiss gold reserves, which has fueled conspiracy theories about large, hidden vaults under the city of Bern that supposedly store immense quantities of gold.
The unproven allegations that kept many interested in the pursuit of confirmation and discovery were not confirmed by the bank which further kept the veil of mystery regarding this topic. This massive interest led to a breakthrough approximately 12 years ago when a German journalist managed to get in touch with an individual who worked in one of the vaults. The worker disclosed confidential information concerning the location of the vaults and the amount of gold to a German newspaper, yet the Swiss government refuted all claims. The Swiss National Bank is, however, still believed to hold massive gold deposits as a central bank responsible for the county’s gold reserves.
What is more, since the SNB is a for-profit independent bank, it achieves its aims of making a profit through the Bank Council, with six members appointed by the government and five by the shareholders. Regardless of the bank comprising the minority of the council, it is still tasked with managing the economic policy. The SNB has a dual mandate, consisting of price stability (i.e. regulating inflation) and economic growth. It is also one of the central banks to meet the least frequently to discuss Swiss monetary policy. The monetary changes, which include the LIBOR (Swiss interest rates), are announced only once every quarter as opposed to many other countries. The Swiss National Bank is led by Mr. Thomas J. Jordan, appointed in 2012 as the bank’s Chairman. One of his greatest contributions was the essay he wrote on the possible repercussions of abandoning the official currency in favor of the EUR amidst the changes that were taking place in European countries in the 90s. This paper contained a detailed assessment of the future, involving monetary policy and housing markets collapse, that would come true a decade later.
Economic Reports
The key economic reports in Switzerland are GDP, employment level, retail sales, CPI and PPI, and consumption indicator. Nevertheless, it appears that overall economic numbers do not impact the CHF substantially unlike some other currencies.
Most Traded Pairs
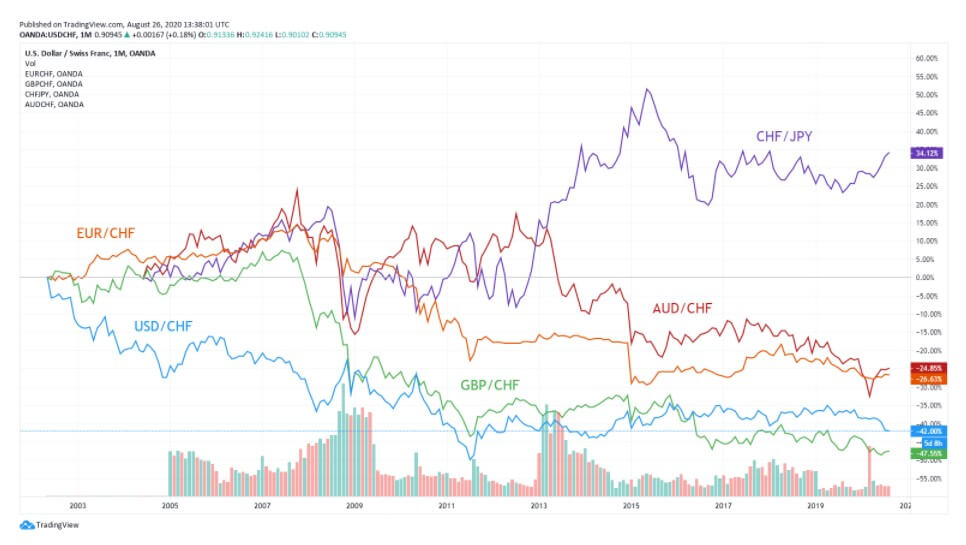
The USD/CHF and EUR/CHF are the most liquid crosses, followed by the GBP/CHF and CHF/JPY currency pairs. Professional traders advise caution with all other CHF-based crosses due to the fact that trading outside these four pairs tends to be rather light and illiquid. Currency pairs such as AUD/CHF typically involve many wide spreads and erratic movements and such crosses are quite susceptible to the impact of news events. Therefore, in order to avoid extreme volatility and gain the most volume, the previously mentioned pairs may be the best option for trading in the currency market.
CHF-based Crosses Compared
Key Correlations
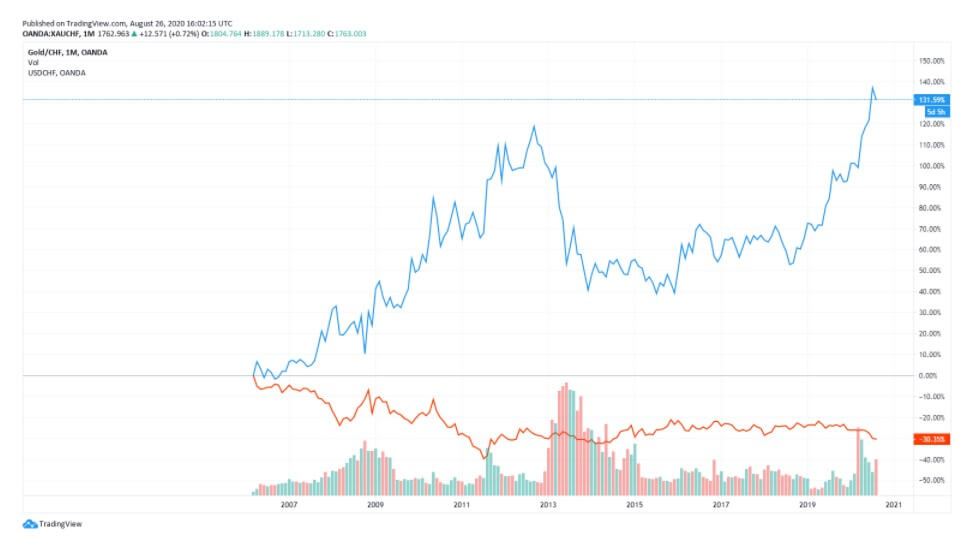
Gold
Switzerland held to the gold standard for the longest period of time among all other countries, even after most of them abandoned it in the 1970s. The fact that stayed on the gold standard implies that they maintained equal amounts of gold to back up their currency. This lasted until the 90s when they cut the gold reserves by 50%, so each new banknote they printed would be supported by a half of its value in gold reserves. This ratio was further reduced later, but the CHF is still tied to the price of gold. Even though this relationship has weakened over time, the CHF typically rises when gold does and vice versa.
XAU/CHF vs. USD/CHF
EUR/CHF
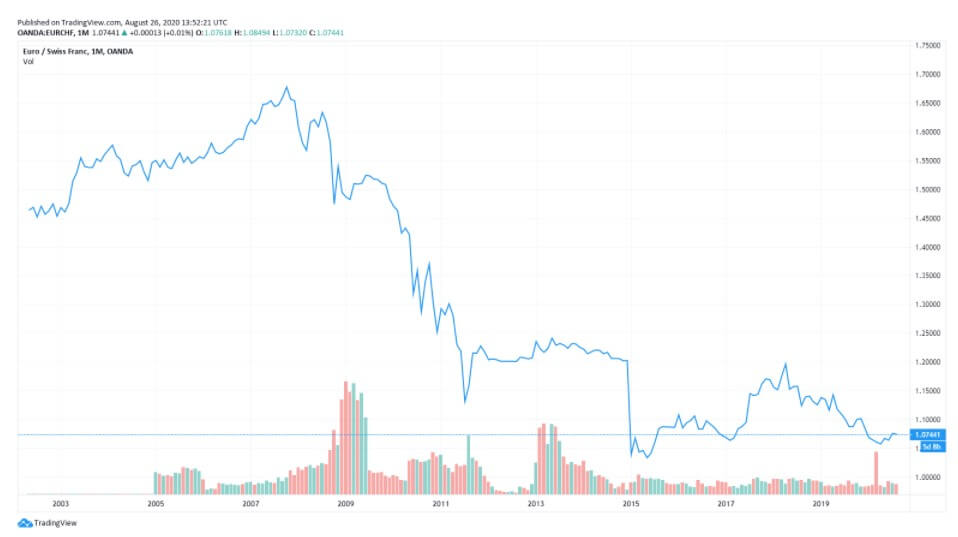
In the midst of the EUR collapse in 2011, with many European countries undergoing major difficulties, no one knew whether a stronger economy could bail them out or whether the ECM could offer any support. Looking for more stability in the crisis, many wealthy individuals decided to move their finances to Switzerland. This subsequently caused the EUR to depreciate and the CHF to appreciate, and the pair suddenly moved from 1.50 to 1.04. The price of Switzerland’s official currency quickly climbed sharply and as they are a large exporting economy with most of their exporting done with Europe, the price of their products steeply increased.
The SNB decided to take action and buy great amounts of currency once EUR/CHF reached the above-mentioned low so as to return the value to 1.20. The pair went up in a matter of a few hours and after 1600 pips turned out to be one of the greatest market moves in the currency market. The close relationship between the two currencies imitates a currency peg, which entails that a currency pegged to another cannot trade freely anymore. Due to this intense resemblance, some professional traders chose to focus on other EUR-based pairs as they generally involve less slippage and tighter spreads. Nowadays, traders are keen on trading USD/CHF and EUR/USD owing to these crosses’ high (95%) negative correlation.
EUR/CHF
Trading the CHF
The CHF used to be one of the top three most traded currencies, yet due to the correlations with the EUR and gold, it has lost its independence in a way. Its safety status diminished greatly after Switzerland abandoned the gold standard and the banking institutions started to give out confidential information. Switzerland has maintained its interest rate at -0.75 since 2015, which is one of the lowest rates among all central banks. Inflation amounted to 0.57% in 2019 and was projected to reach 0.64% in 2020. The last report the SNB issued in June of 2020 highlighted a sharp decline in economic activity and inflation as a result of the COVID-19 pandemic. Although they state that current inflation and growth estimates are challenged by unusually high uncertainty, they are generally assumed to pick up in the following year. Due to the nature of the country’s economy and exportation, the CHF carries hardly any difficulties with a trade deficit.
The country’s overall economic activity depends on GDP, and as the decline in Swiss GDP was already noticeable in the first quarter of the year, with April witnessing one of the lowest points in economic activity, the SNB projects a stronger GDP declined in the second quarter of this year. With regard to news events, the CHF’s correlation with the EUR makes it more susceptible to whatever is happening with the EUR. Therefore, if the ECB decided to reduce interest rates, the effects would likely be felt with the CHF as well. The SNB does not necessarily need to take the same action as the ECB, as it has not done in the past either, yet the CHF and the EUR have exhibited similar behavior for many years now. As discussed before, many traders decide to trade other EUR pairs rather than EUR/CHF due to this correlation.
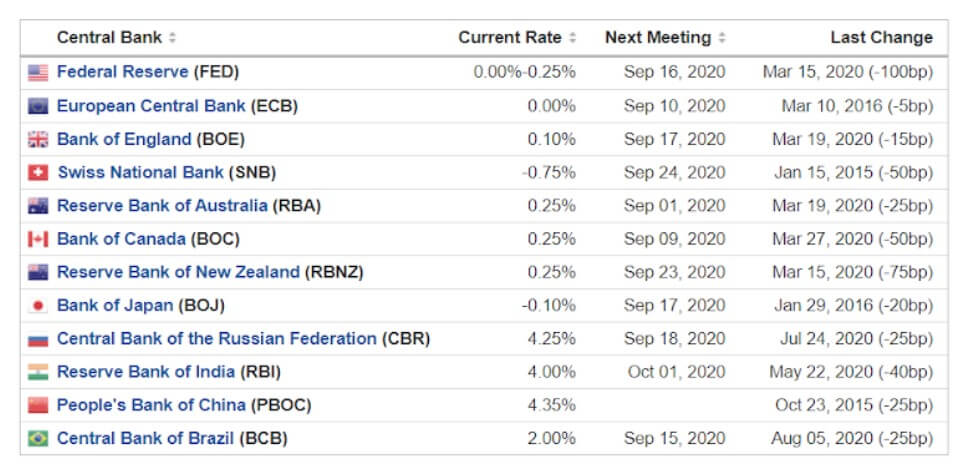
Central Banks’ Interest Rates
Latest Events
The CHF has been moving in various directions lately, which has been largely boosted by the higher EUR. A recent downtrend has turned into a rather weak uptrend supported that can be attributed to the EUR. The EUR appears to have been much better than the CHF lately, pulling it upward. This week, both the EUR and the CHF seem to be in the neutral territory in comparison to other major currencies. Generally, as there is a little divergence between the EUR and the CHF, other crosses involving the former may again be a better choice. The end of August is typically a quiet period in the forex market, so trading currencies can potentially be a little sluggish as well. In terms of economic reports, KOF economic barometer, which many participants in the financial markets seem to be interested in, will come out on August 28, providing information on the Swiss GDP. The CHF is generally directed towards a weaker value due to the Swiss National Bank’s desire to boost inflation.
Although it is one of the strongest currencies in the world, trading the CHF is still subject to susceptibility to some other factors such as the EUR, gold, and, currently, the coronavirus pandemic. Nonetheless, due to its strong economy and the unique central bank the currency rests on, the CHF is believed to remain one of the safer investment options. Switzerland’s safe-haven currency was estimated to be the second best-performing currency of 2020.
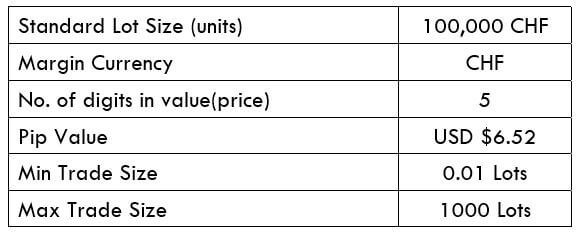
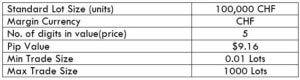
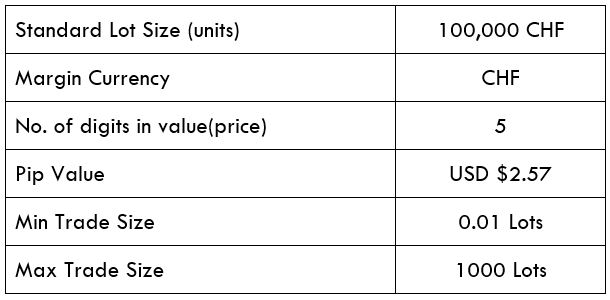
CHF/SAR is the acronym for the Swiss Franc against the Saudi Riyal. It is classed as an exotic currency pair as it usually has moderate trading volume. In this case, the Swiss Franc (on the left) is the base currency, and the Saudi Riyal (on the right) is the quote currency. The SAR (Saudi Riyal) is the official currency of Saudi Arabia, and one SAR is divided into 100 halalas.
Understanding CHF/SAR
To find out the comparative value of one currency, we require an additional currency to compare. If the base currency’s value goes down, the value of the quote currency moves up and contrariwise. If the market cost of this pair is 4.0742, then this amount of SAR is required to buy one unit of CHF.
Spread
Forex brokers have two distinct prices for currency pairs, which are classified as the bid and ask price. The bid price is the offering price, and ask is the buy price. The distinction between the ask and the bid price is known as the spread. The spread is how brokers make their income. Below are the spreads for CHF/SAR currency pairs in both ECN & STP brokers.
ECN: 9 pips | STP: 14 pips
Fees
A Fee is basically the compensation we pay to the broker each time we execute a spot. There is no compensation charged on STP account models, but a few additional pips are charged on ECN accounts.
Slippage
Slippage refers to the distinction between the trader’s anticipated price and the original price at which the trade is executed. It can occur at any time but often occurs when the market is fast-phased and volatile. Also, sometimes slippage occurs when we place a large number of orders at the same time.
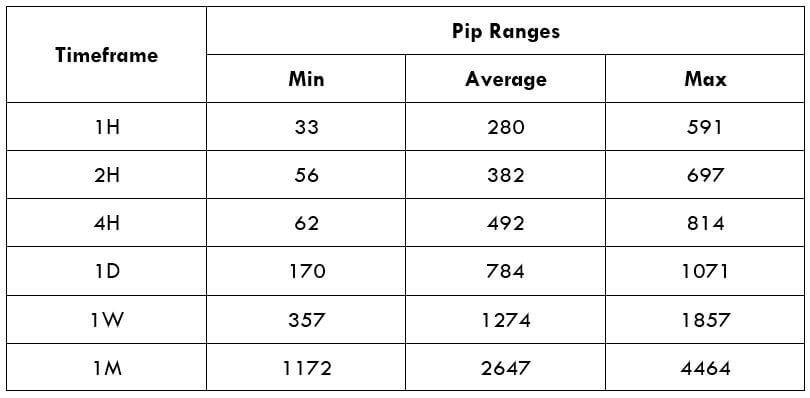
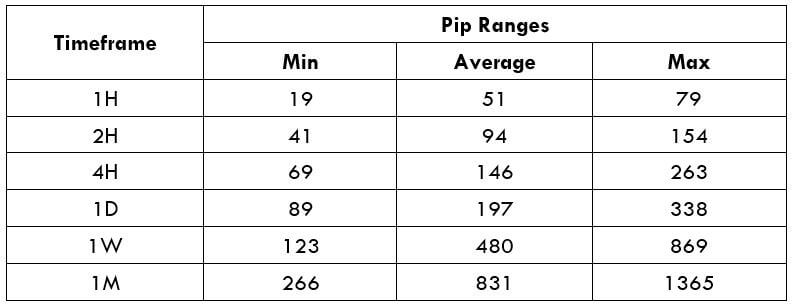
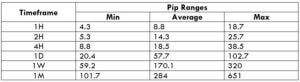
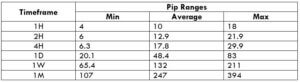
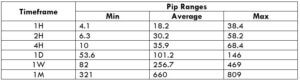
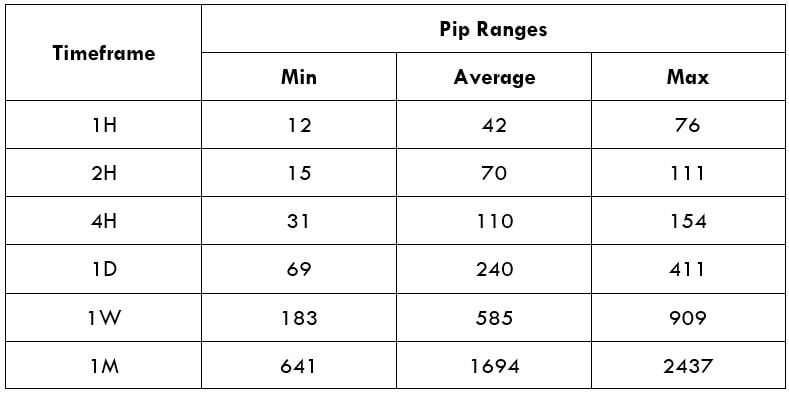
Trading Range in CHF/SAR
The amount of money we will earn or lose in a specific timeframe can be evaluated using the trading range table. It is an illustration of the minimum, average, and maximum pip movement in a currency pair. This can be assessed simply by using the ART indicator with 200-period SMA.
Shrink the chart so you can assess a large time period
Select your desired timeframe
Measure the floor level and set this value as the min
Measure the level of the 200-period SMA and set this as the average
Measure the peak levels and set this as Max.
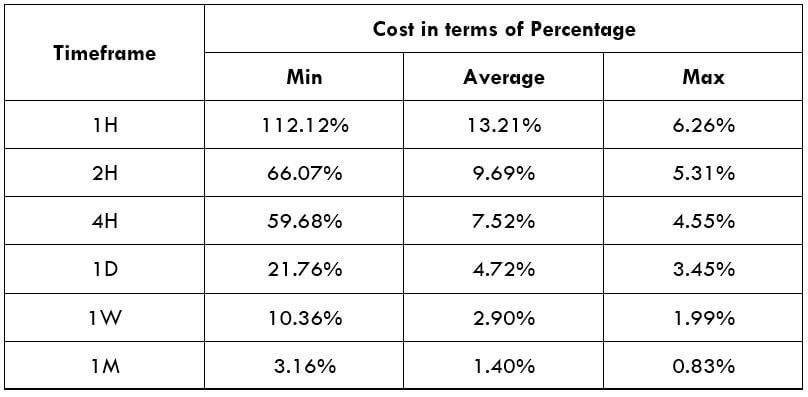
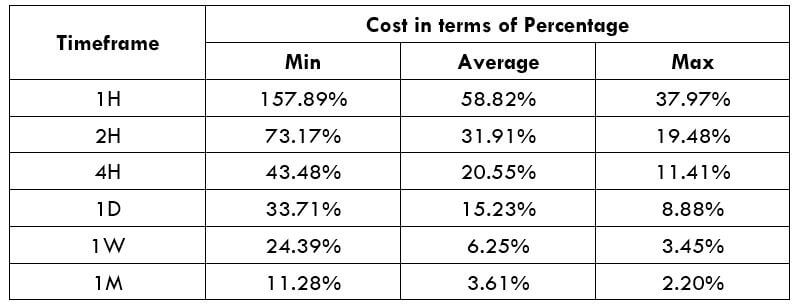
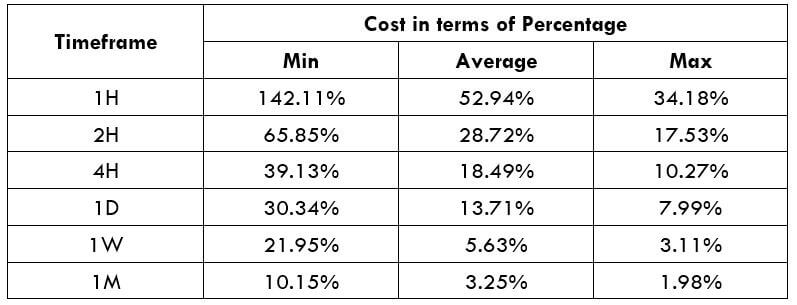
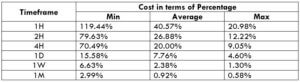
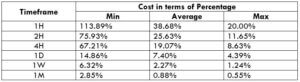
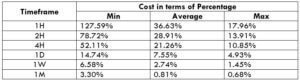
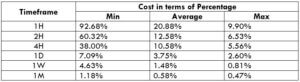
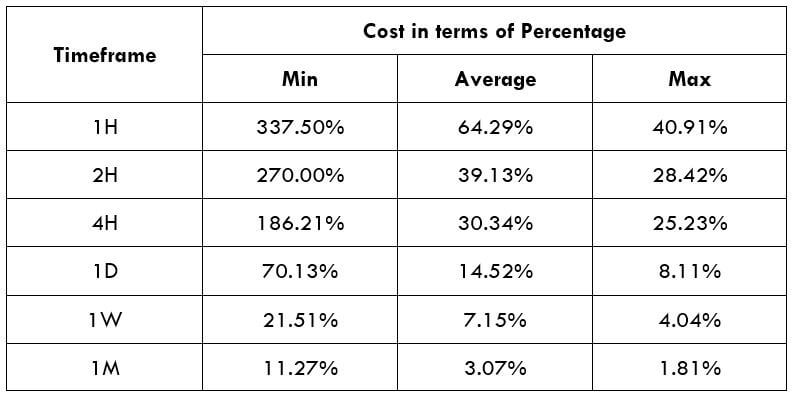
CHF/SAR Cost as a Percent of the Trading Range
The cost of trade widely varies on the broker and differs based on the volatility of the market. This is because the total cost also includes slippage and spreads, excluding the trading fee. Below is the interpretation of the cost variation in terms of percentages. The understanding of it is discussed in the subsequent sections.
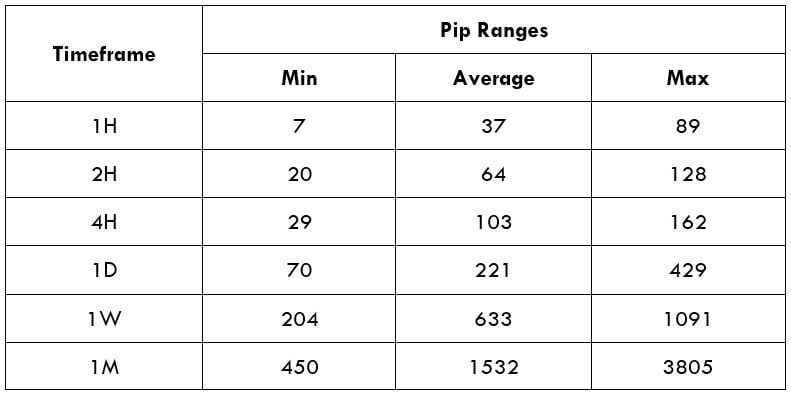
The CHF/SAR is an exotic-cross currency pair, and it is volatile. For example, the average pip movement on the 1H timeframe for this pair is ~37pips. From the earlier tables, it is clear that the higher the volatility, the lower is the cost of the trade. Nevertheless, this is not an added benefit, as it is risky to trade when the markets are incredibly volatile.
Trading in such timeframes will ensure low expenses just as reduced liquidity. It will also involve fewer costs by placing orders using limit/pending orders instead of market orders. This will substantially reduce the total cost with slippage being zero.
While reading the above tables, if the ratios are larger, more significant are the trade costs. Likewise, if the proportions are small, lower are the costs. This can be inferred as the trading costs are more significant for low volatile markets and smaller for high volatile markets. I hope this article will support you to trade this pair in a much efficient way. Cheers!
Introduction CHF/THB is the abbreviation for the Swiss Franc against the Thai Baht. It is classified as an exotic-cross currency pair as it usually has a low trading volume. In this case, the Swiss Franc (on the left) is the base currency, and the Thai Baht (on the right) is the quote currency. The THB […]
Introduction CHF/THB is the abbreviation for the Swiss Franc against the Thai Baht. It is classified as an exotic-cross currency pair as it usually has a low trading volume. In this case, the Swiss Franc (on the left) is the base currency, and the Thai Baht (on the right) is the quote currency. The THB […]
Introduction
CHF/THB is the abbreviation for the Swiss Franc against the Thai Baht. It is classified as an exotic-cross currency pair as it usually has a low trading volume. In this case, the Swiss Franc (on the left) is the base currency, and the Thai Baht (on the right) is the quote currency. The THB is the official currency of Thailand, and it is further split up into 100 satangs.
Understanding CHF/THB
The market price of CHF represents the value of THB that is required to purchase one CHF(Swiss Franc). It is quoted as 1 CHF per X THB. If the market cost of this pair is 34.350, then this amount of THB is required to buy one unit of CHF.
Spread
The distinction between the asking price and the offering price is labeled as the spread. ECN and STP account model will have various spread values; The approximate spread values of CHF/THB pair in both the accounts are mentioned below:
ECN: 30 pips | STP: 35 pips
Fees
The fee is the commission that one pays while entering a trade. A few extra pips are charged on ECN accounts, but there is no fee charged on STP accounts.
Slippage
The mathematical difference between the price expected by the trader and the given price by the broker can be termed slippage. Its cost varies on two factors, i.e., the market’s high volatility and broker’s implementation speed.
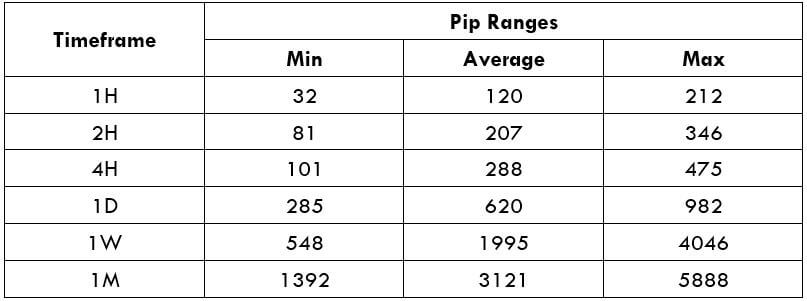
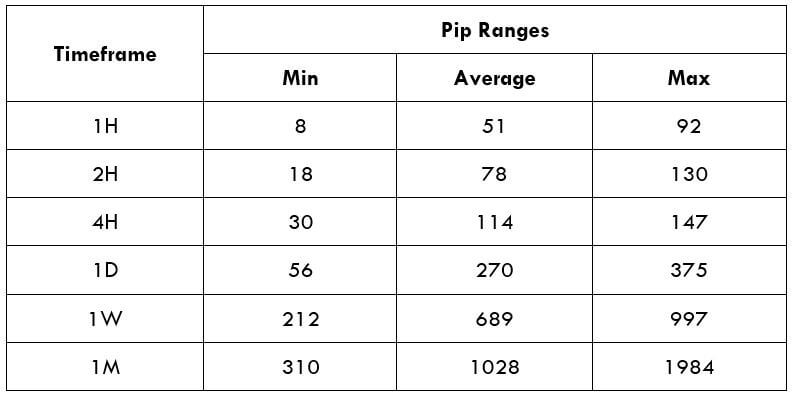
Trading Range in CHF/THB
The trading range helps us understand the minimum, average, and maximum pip movement in various time frames. These values assist us in determining the risk, which could be caused by trade. The same is in shown in the below table:
Shrink the chart so you can assess a large time period
Select your desired timeframe
Measure the floor level and set this value as the min
Measure the level of the 200-period SMA and set this as the average
Measure the peak levels and set this as Max.
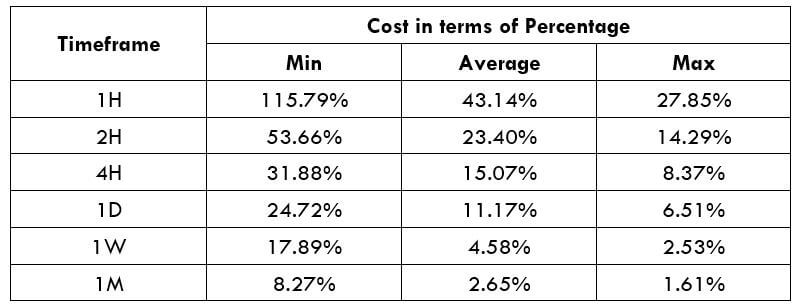
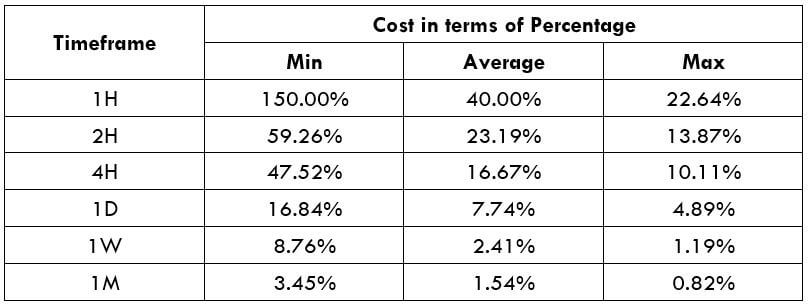
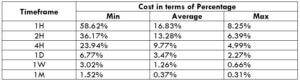
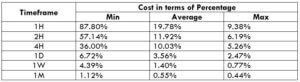
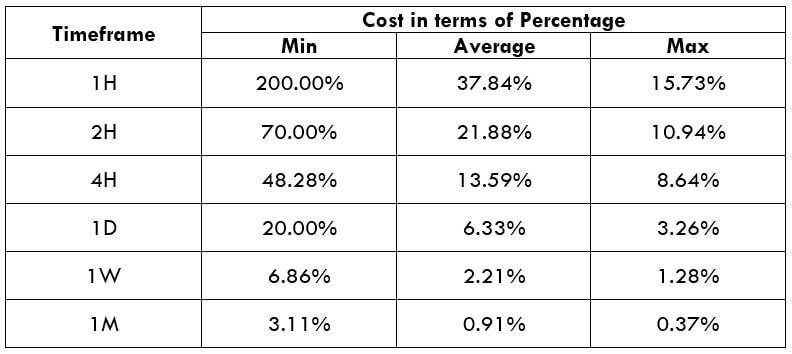
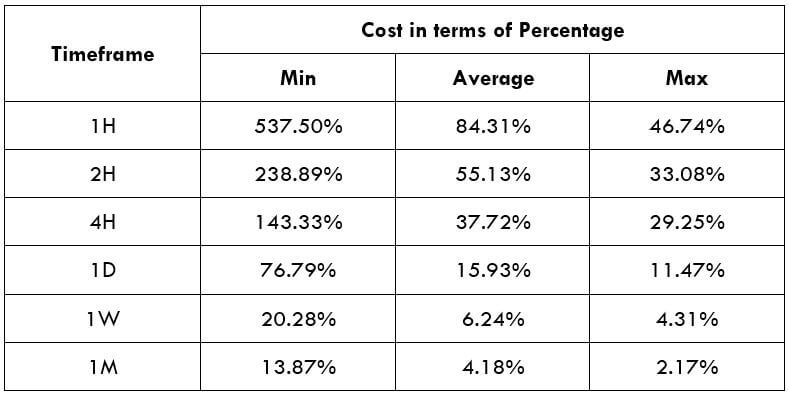
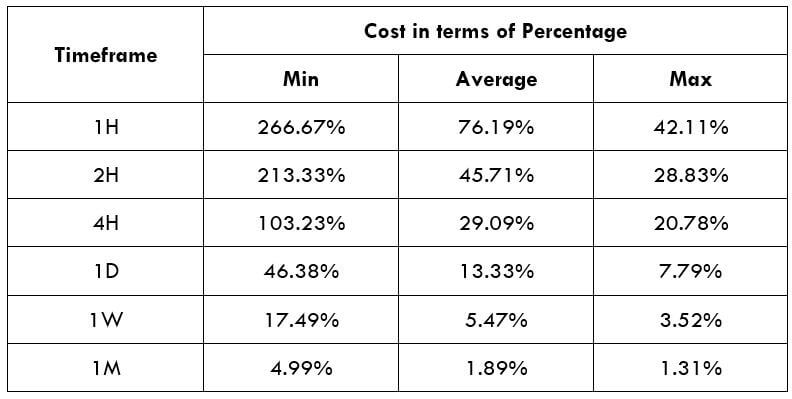
CHF/THB Cost as a Percent of the Trading Range
The cost variations in trade can be determined by applying the total cost to the table mentioned below. The cost percentage of the trading range represents the difference in fees on the trade and various time frames for differing volatility.
The CHF/THB is an exotic-cross currency pair, and this market’s volatility is moderate. For instance, the average pip movement on the 1H timeframe is 51 pips. We should understand the higher the volatility, the lower will be the cost to implement the trade. However, this is not an added advantage as trading in a volatile market means more risk.
For example, in the 1M time frame, the Maximum pip range value is 1984, and the minimum is 310. When we evaluate the trading fees for both the pip movements, we can see that for 310pip movement fess is 13.87%, and for the 1984 pip movement, the fee is only 2.17%. With the mentioned example, we can conclude that trading the CHF/THB currency pair will be comparatively expensive.
CHF/MYR is the abbreviation for the Swiss Franc against the Malaysian Ringgit, and it is considered an exotic currency pair. In this case, the CHF is the base currency, and the MYR is the quote currency. The franc is the official currency of Switzerland and Liechtenstein, while MYR is the official currency of Malaysia.
Understanding CHF/MYR
The market value of CHF/MYR defines MYR’s value that is obliged to buy one franc. It is priced as 1 CHF per X MYR. If the price of the pair is 4.5465 in the market, then these many Malaysian ringgit units are required to buy one CHF.
Spread
The distinction in price between the bid and ask price is determined as Spread. Bid and ask prices are set by the broker. This pip difference is where most of the brokers generate their revenue. Below are the Spread values of CHF/MYR Forex pair in both ECN & STP accounts.
ECN: 44 pips | STP: 49 pips
Fees
The fee is the price you spend on each spot you open with the broker. There is no fee imposed on STP account models, but a few extra pips are charged on ECN accounts.
Slippage
The difference between the price at which, trader implements the trade, and the price he receives from the broker is termed Slippage. This fluctuates based on the broker’s execution speed and the market’s volatility.
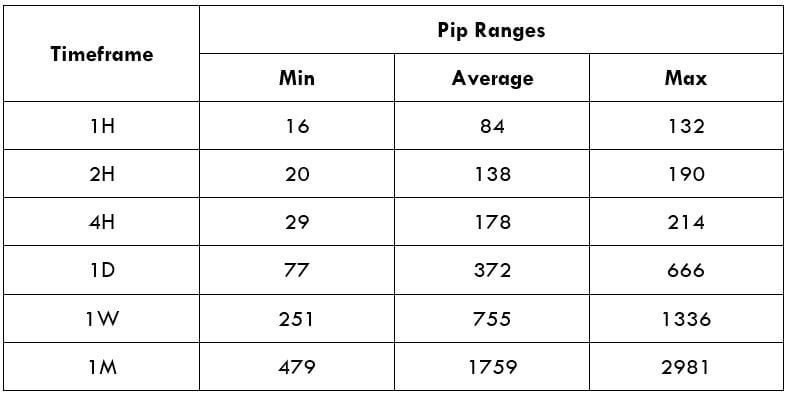
Trading Range in CHF/MYR
The total money you will gain or lose in a particular timeframe can be measured utilizing the trading range table. This represents the maximum, average, and minimum pip movement in a currency pair.
Shrink the chart so you can assess a large time period
Select your desired timeframe
Measure the floor level and set this value as the min
Measure the level of the 200-period SMA and set this as the average
Measure the peak levels and set this as Max.
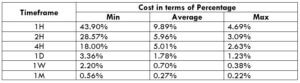
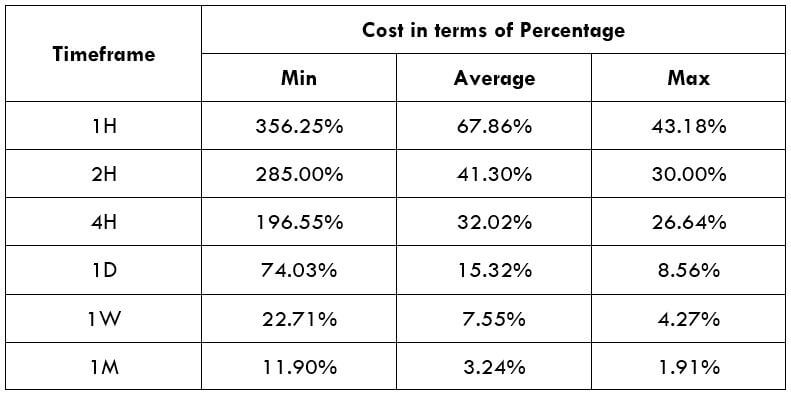
CHF/MYR Cost as a Percent of the Trading Range
The cost of trade alters based on the volatility of the market. This is for the reason that the total cost involves Slippage and spreads apart from the trading fee. Below is the interpretation of the cost variant in terms of percentages. The understanding of it is reviewed in the following sections.
The CHF/MYR is not an extremely volatile currency pair. For instance, the average pip movement on the 1H timeframe is only 84 pips. Note that the elevated the volatility, the smaller is the cost of the trade. However, this cannot be considered a benefit as it is risky to trade extremely volatile markets.
Also, the higher or lesser the percentages, the higher or lower are the costs on the trade. We can conclude that the costs are elevated for low volatile markets and high for extremely volatile markets.
To reduce your risk, it is proposed to trade when the volatility is near the average standards. In this case, the volatility is low, and the costs are slightly high related to the average and the maximum values. But, if your primary concern is on lowering costs, you may trade when the market volatility is near the maximum values.
CHF/AED is the short form for the Swiss Franc against the United Arab Emirates Dirham. It is considered an exotic currency pair. Currencies are always traded in pairs in the Forex market. The main currency in the pair is considered the base currency, while the sequential one is the quote currency.
Understanding CHF/AED
The market value of CHF/AED determines the value of AED required to buy one Swiss Franc. It is priced as 1 CHF per X AED. Hence, if the market price of this pair is 3.8835, these many United Arab Emirates Dirham units are necessary to buy one CHF.
Spread
The spread is the distinction between the ask-bid price. Mostly, these two prices are set by the stockbrokers. The gap between the pip values is through which brokers generate revenue. Below are the ECN & STP Spread values of CHF/AED pair.
ECN: 19 pips | STP: 24 pips
Fees
The fee is the minimum commission you pay to the broker on every single spot you open. There is no fee to be paid on STP accounts, but a few additional pips on ECN accounts.
Slippage
Slippage is the distinction between the price at which the trader implemented the trade and the original price he got from the broker – this changes based on the volatility of the market and the broker’s implementation speed.
Trading Range in CHF/AED
The trading range table will help you determine the amount of money that you will win or lose in every timeframe. This table signifies the minimum, average, and maximum pip movement in a currency pair.
Shrink the chart so you can assess a large time period
Select your desired timeframe
Measure the floor level and set this value as the min
Measure the level of the 200-period SMA and set this as the average
Measure the peak levels and set this as Max.
CHF/AED Cost as a Percent of the Trading Range
The price of the trade alters based on the volatility of the market. Hence, the total cost comprises slippage and spreads, excluding from the trading fee. Below is the analysis of the cost difference in terms of percentages.
The CHF/AED is not a very volatile pair. For example, the average pip movement on the 1H timeframe is only 42 pips. If the volatility is more significant, then the cost of the trade is low. Nevertheless, it involves a higher risk to trade highly volatile markets.
Also, the higher/lesser the proportions, the greater/smaller are the costs on the trade. We can then determine that the costs are higher for low volatile markets and high for highly volatile markets.
To reduce your risk, it is recommended to trade when the volatility is around the minimum values. The volatility here is low, and the costs are slightly high, corresponding to the average and the maximum values. But, if the priority is towards reducing costs, you could trade when the volatility of the market is near the maximum values.
Benefits on Limit orders
For orders that are implemented as market orders, there is slippage applied to the trade. But, with limit orders, there is no slippage valid. Only the spread and the trading fees will be accounted for estimating the total costs. Therefore, this will bring down the cost noticeably.
The abbreviation of CHF/BLR is Swiss Franc, paired with the Brazilian Real. In this pair, CHF is the native currency of Switzerland and is also the fifth vastly traded currency in the Forex market. Likewise, BRL stands for the Brazilian Real, and it is the official currency of Brazil. This is classified as an exotic Forex pair.
Understanding CHF/BRL
In the Forex market, to ascertain the relative value of one currency, we need another currency for comparison. When we buy a currency (recognized as the base currency), we are indirectly selling another currency (known as the quote currency). The market value of CHF/BRL helps us to comprehend the power of BRL against the CHF. So, if the trade rate for the pair CHF/BRL is 5.7715, it means to buy 1 CHF, we need 5.7715 BRL.
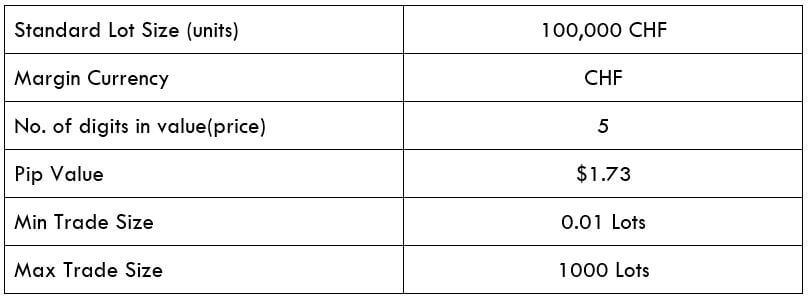
CHF/BRL Specification
Spread
Spread is the difference among the bid-ask price that is set at the exchanges. Below are the spread values of the CHF/BRL currency pair in both ECN & STP accounts. The spread charges for ECN and STP brokers for CHF/BRL pair are as follows:
ECN: 24 | STP: 29
Fees
For every spot, a trader enters the stockbroker charges a specific fee for it. Traders must know that this fee is charged only on ECN accounts and does not apply to STP accounts.
Slippage
Slippage is the price distinction between the broker executed price and the trader execution price. The difference is caused due to the market’s high volatility and slow execution speed.
Trading Range in CHF/BRL
A trading range is the explanation of the volatility in CHF/BRL in numerous timeframes. The values are attained from the Average True Range indicator. One can use the table as a risk management tool to distinguish the profit/loss that a trader is possessed.
Below is a table indicating the minimum, average, and max pip movement in several timeframes.
Shrink the chart so you can assess a large time period
Select your desired timeframe
Measure the floor level and set this value as the min
Measure the level of the 200-period SMA and set this as the average
Measure the peak levels and set this as Max.
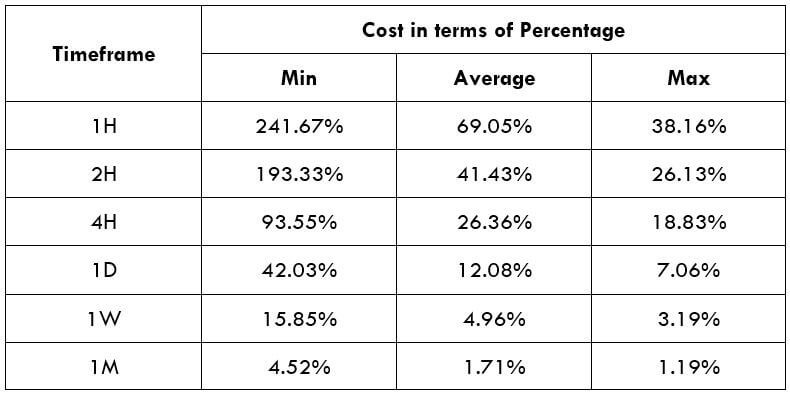
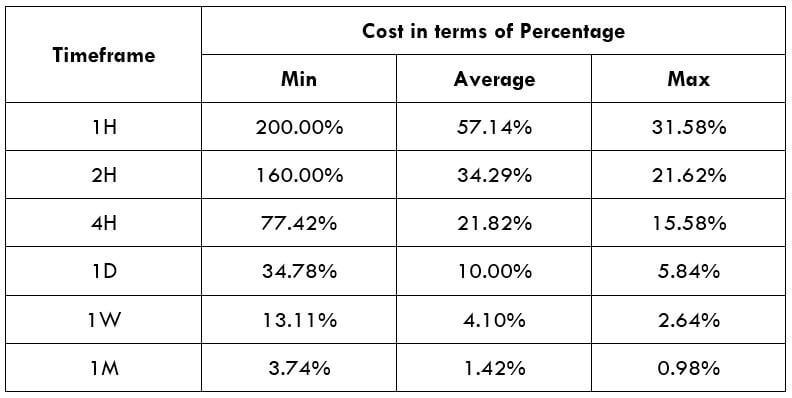
CHF/BRL Cost as a Percent of the Trading Range
The total cost of the trade changes based on the volatility of the market, hence we must number out the occasions when the costs are less to place ourselves in the market. The table below displays the variation in the costs based on the change in the market’s volatility.
Note: The ratio represents the relative scale of costs and not the fixed costs on the trade.
With the help of the above tables, let us assess these two factors to the trade the CHF/BRL. Volatility and cost are two elements a trader must consider for trading any security in the Forex market.
In various timeframes, we can see the pip movement being very high between the minimum volatility and the average volatility. As a day trader, the aim is to make profits from the pip variation in the market. It becomes tricky to extract some profits from the market if there are no variations in the pip value.
When the cost goes higher, the volatility of the market decreases. In other words, the market with high volatility have minimal costs. To strike a balance between the volatility and the cost, traders should find an appropriate time when the volatility is close to the average values or slightly about it.
Additionally, traders can also reduce their total costs by placing ‘limit orders’ instead of ‘market orders.’ This will ultimately cut the slippage on the trade and consequently lower the total cost. In the below example, the total cost would decrease by five pips, which is a modest reduction for just altering the type of order execution.
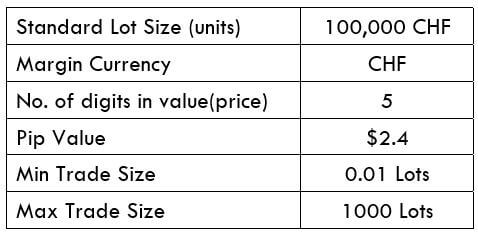
CHF/PLN is the abbreviation for the Swiss Franc alongside the Poland złoty. It is categorized as an exotic currency pair that usually has high volatility and low trading volume. Here, the CHF is the base currency, and the PLN is the quote currency. CHF is the official currency of Switzerland, whereas PLN is the national currency of Poland.
Understanding CHF/PLN
The current value of the pair represents the value of PLN that is corresponding to one CHF. It is quoted as 1 CHF per X PLN. For example, if the value of this pair is 4.1627, these many units of PLN are required to buy one Swiss Franc.
CHF/PLN Specification
Spread
In trading, the difference between the bid-ask price is described as the spread. Spread normally fluctuates from broker to broker. The estimated spread on ECN and STP accounts is given below.
ECN: 49 | STP: 54
Fees
There is a small fee or payment charged by the broker for each trade a trader does. This varies on both types of accounts and broker. There are zero fees charged on STP accounts, but a few extra pips are charged on ECN accounts.
Slippage
The difference between the cost at which the trader executed the trade and the cost he received from the broker is termed as Slippage. Fundamentally, Slippage hangs on two factors – Broker’s execution & market’s volatility
Trading Range in CHF/PLN
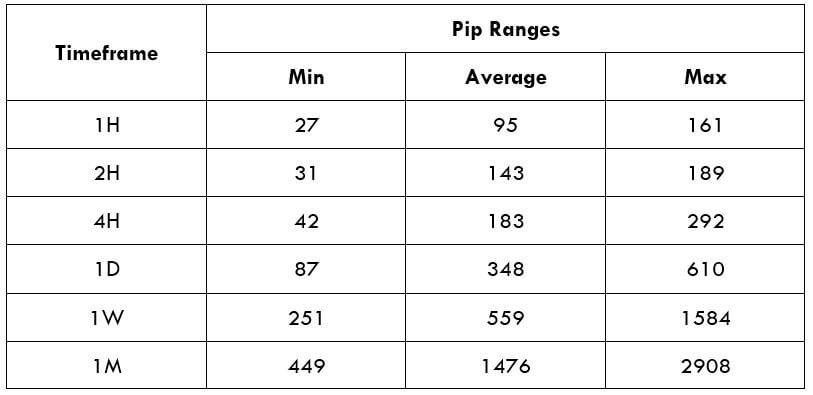
The trading range is a tabular interpretation of the minimum, average, and maximum pip movement in a different timeframe. Having expertise about this is necessary because it helps in handling risk as well as determine the appropriate times of the day to enter and exit a trade with marginal costs. Below is a table that illustrates the minimum, average, and maximum volatility (pip movement) on several timeframes.
Shrink the chart so you can assess a large time period
Select your desired timeframe
Measure the floor level and set this value as the min
Measure the level of the 200-period SMA and set this as the average
Measure the peak levels and set this as Max.
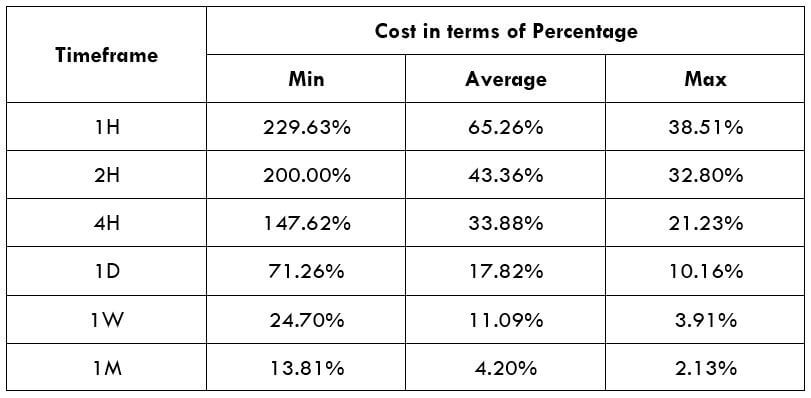
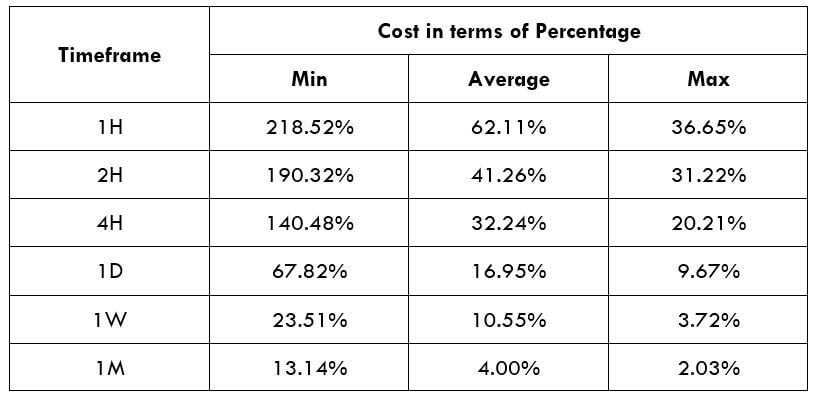
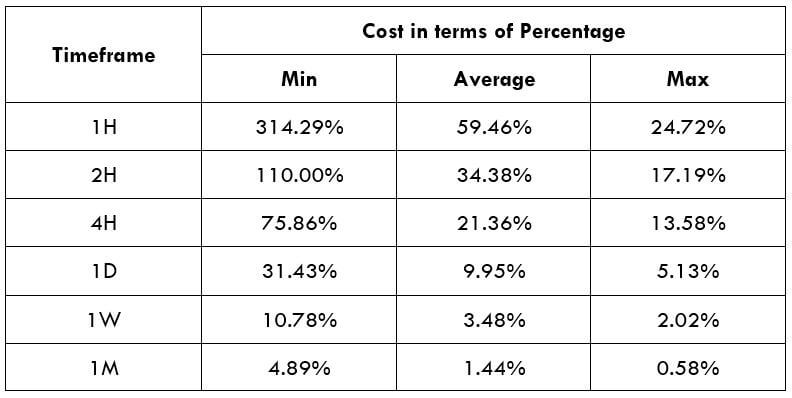
CHF/PLN Cost as a Percent of the Trading Range
The number of pips the currency pair change in various timeframes is demonstrated in the table above. With this, we apply these values to get the cost percentage when the volatility is minimum, average, and maximum. This cost percentage will help us sort out an ideal time of the day to enter trades.
The understanding of the cost percentage is easy. If the percentage is above average, then the cost is higher for that specific timeframe and range. If the percentage is at a low level, then the cost is comparatively low for that timeframe and range. Note that, the total cost on a particular trade is calculated by combining the spread, Slippage, and trading fee.
There are specific times a trader must deal with their trade to decrease both hazard and cost on the trade. This can be made feasible by understanding the above tables. Entering and exiting trades during any time of the day is highly not advised.
The percentages are most elevated in the min column. This means the cost is fairly high when the volatility of the market is low. For instance, on the 1H timeframe, when the volatility is 27 pips, the cost percentage is 218.5%. Meaning, one must bear high costs if they open or close trades when the volatility is around 27 pips. So, ideally, it is proposed to trade when the market volatility is above the average mark.
CHF/AUD is the acronym for the Swiss Franc against the Australian Dollar, and it is an exotic Forex currency pair. Here, the CHF is the base currency, and the AUD is the quote currency. Both CHF and AUD are major currencies and are vastly traded in the foreign exchange market. CHF is the official currency of Switzerland, while AUD is the national currency of Australia.
Understanding CHF/AUD
The price of this pair in the trade market defines the value of AUD equivalent to one Swiss Franc. It is quoted as 1 CHF per X AUD. For instance, if the value of this pair is 1.5318, these many Australian Dollars are required to acquire one CHF.
Spread
The difference between the ask-bid price is referred to as Spread, which is charged by the broker. This value is different in the ECN and STP accounts. The estimated Spreads for CHF/AUD pair is given below.
A fee is a price that one pays for the trade. There are zero fees charged on STP accounts, but a few pips are charged on ECN accounts. Slippage is the difference calculated between the price by the trader and the price the trader received from the broker.
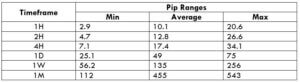
Trading Range in CHF/AUD
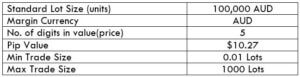
The trading range is represented in the tabular format to showcase the pip movement of a currency pair in various timeframes. These values are useful in ascertaining the profit that can be generated from trade in advance. To discover the trading costs, we must multiply the below volatility value with the pip value of this pair.
Shrink the chart so you can assess a large time period
Select your desired timeframe
Measure the floor level and set this value as the min
Measure the level of the 200-period SMA and set this as the average
Measure the peak levels and set this as Max.
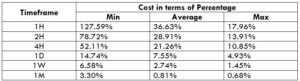
CHF/AUD Cost as a Percent of the Trading Range
The trading range is obtained by identifying the ratio between total cost and volatility; it expressed in terms of percentage. Below is the representation of the cost differences of traders in various timeframes and volatilities.
When the percentage value is higher, the cost of the trade gets more expensive. From the above tables, we can conclude the values are significant in the min column and relatively less significant in the max column. It means that the costs are high when the market’s volatility is low. It is not advisable to trade when both the volatility and cost of trading is high. Balancing both these factors is ideal to trade when the pair’s volatility is in the range of the average values.
Additionally, to lower your costs even further, you can place trades using limit orders instead of market orders. By executing limit orders, the slippage will not be involved in the calculation of the total costs. And this will set the cost of the trades low by a decent number. An example of the same is given below.
CHF/HKD is the abbreviation for the Swiss Franc against the Hong Kong Dollar. It is categorized as an exotic currency pair that usually has high volatility and low trading volume. Here, the CHF (on the left) is the base currency, and the HKD (on the right) is the quote currency.
Understanding CHF/HKD
The market price of CHF/HKD represents the value of HKD that are obliged to purchase to one CHF. It is quoted as 1 CHF per X HKD. If at all the market price of this pair is 8.1718, then this amount of HKD is required to buy one CHF.
Spread
The difference between the bid-ask price is described as the spread. Its value differs from the ECN account model and STP account model. The approximate value for the two is specified below:
ECN: 35 pips | STP: 40 pips
Fees
A fee is a price that one pays to the broker for executing a trade. There is no fee charged on STP accounts, but a few pips are charged on ECN accounts.
Slippage
The difference between price called for by the client and price that was offered by the broker is described as the slippage. Its value varies on the volatility of the market and the broker’s execution.
Trading Range in CHF/HKD
The trading range is that the tabular representation of the pip movement of a currency pair in several timeframes. These values are useful in determining the profit, which will be generated from trade in advance. To seek out the worth, you need to multiply the below volatility value with the pip value of this pair.
Shrink the chart so you can assess a large time period
Select your desired timeframe
Measure the floor level and set this value as the min
Measure the level of the 200-period SMA and set this as the average
Measure the peak levels and set this as Max.
CHFHKD Cost as a Percent of the Trading Range
By implementing the total cost to the mentioned table, we can ascertain the cost differences in a trade. The values are attained by finding a proportion between total cost and volatility value and are indicated as a percentage.
Comprehending the above tables is important. The ratio to the total cost of trade is directly proportional to the value. It is seen that the rates are nearly high on the min section (less volatility) and the other way around. Now, the perfect chance to enter the market would be the point at which the volatility of CHF/HKD is somewhere between the average pip movement. Trading this pair during such minutes will guarantee low trading costs just as lower liquidity.
You can reduce the trading costs by placing orders using limit/pending orders instead of market orders. This will considerably reduce the total cost with slippage being zero. I hope this article will assist you in trading this pair in a much efficient way. Cheers!
The Swizz Franc, known among traders as the Swissie, is one of the major currencies, with the USDCHF being the sixth most traded currency pair. It is considered to be a safe haven currency, where investors will often buy the currency in times of Risk-off, or market uncertainty. The Swiss National Bank decided to artificially peg the Franc at 1.20 against the Euro in 2011 because the Swizz policymakers wanted to stop the Franc from being too strong because it was hurting its exports.
However, in January 2015, the SNB suddenly severed this artificial cap, without fair notice, which sent shock waves through the market and where the Franc currency spiked in value and where the EURCHF plunged from the artificial cap of 1.20 to 0.85. Many investors, traders, and institutions were caught out, with the broker Alpari going bankrupt and where some traders had their accounts blown and where they went into negative equity due to this unprecedented move.
Since then, the currency has stabilized and where the USDCHF pair is nowadays less volatile compared to other currency pairs, and this, of course, makes it difficult to trade from a technical standpoint. Things that affect this pair are decisions by the US Federal Reserve and the Swiss National Bank and their respective gross domestic product estimates, unemployment data, industrial growth figures, and national debt.
Despite previous turmoil with the currency, the bottom line is that investors continue to see the Swiss Franc as a safe haven currency, and this is being born out in the markets at this time because of the Coronavirus epidemic.
And while the risk associated with trading this currency, from a historical standpoint, would be that the SMB has proven to be ruthless and unsympathetic when setting policy decisions and clearly they do not want a strong currency, nevertheless the markets have decided to heavily buy the Swiss Franc which is at a 16 month high at the moment, where the USDCHF pair decreased 0.0060 or 0.62% to 0.9634 on Friday, January 31 from 0.9694 in the previous trading session.
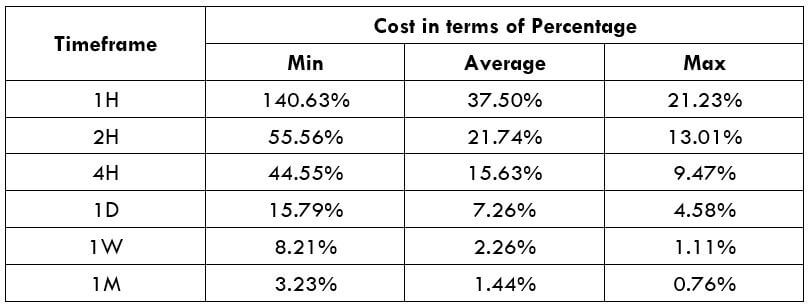
Example A
In example A, which is a daily chart of the USDCHF going back to April 2019, the pair has, for the majority of this period, been stuck in a sideways action after rejecting the high of 1.02 at position 1. This keeps in line with our notion that this pair has been fairly steady throughout this period. We can see clear support and resistance at position 3 and position 4. However, when we come to position 5, there is no bounce higher from the support line back up to the resistance line. We simply see price action fairly muted and then having a second attempt to pierce through the support line at position 6, which was short-lived. But the bullish candlestick and more convincing pierce of this support line at position 7 falls into line with our theory that the Swiss Franc is being bought as a safe haven currency at this time. And therefore, traders should be looking to this support line, subsequently becoming an area of resistance and with a possible continuation to the downside perhaps to 0.95.
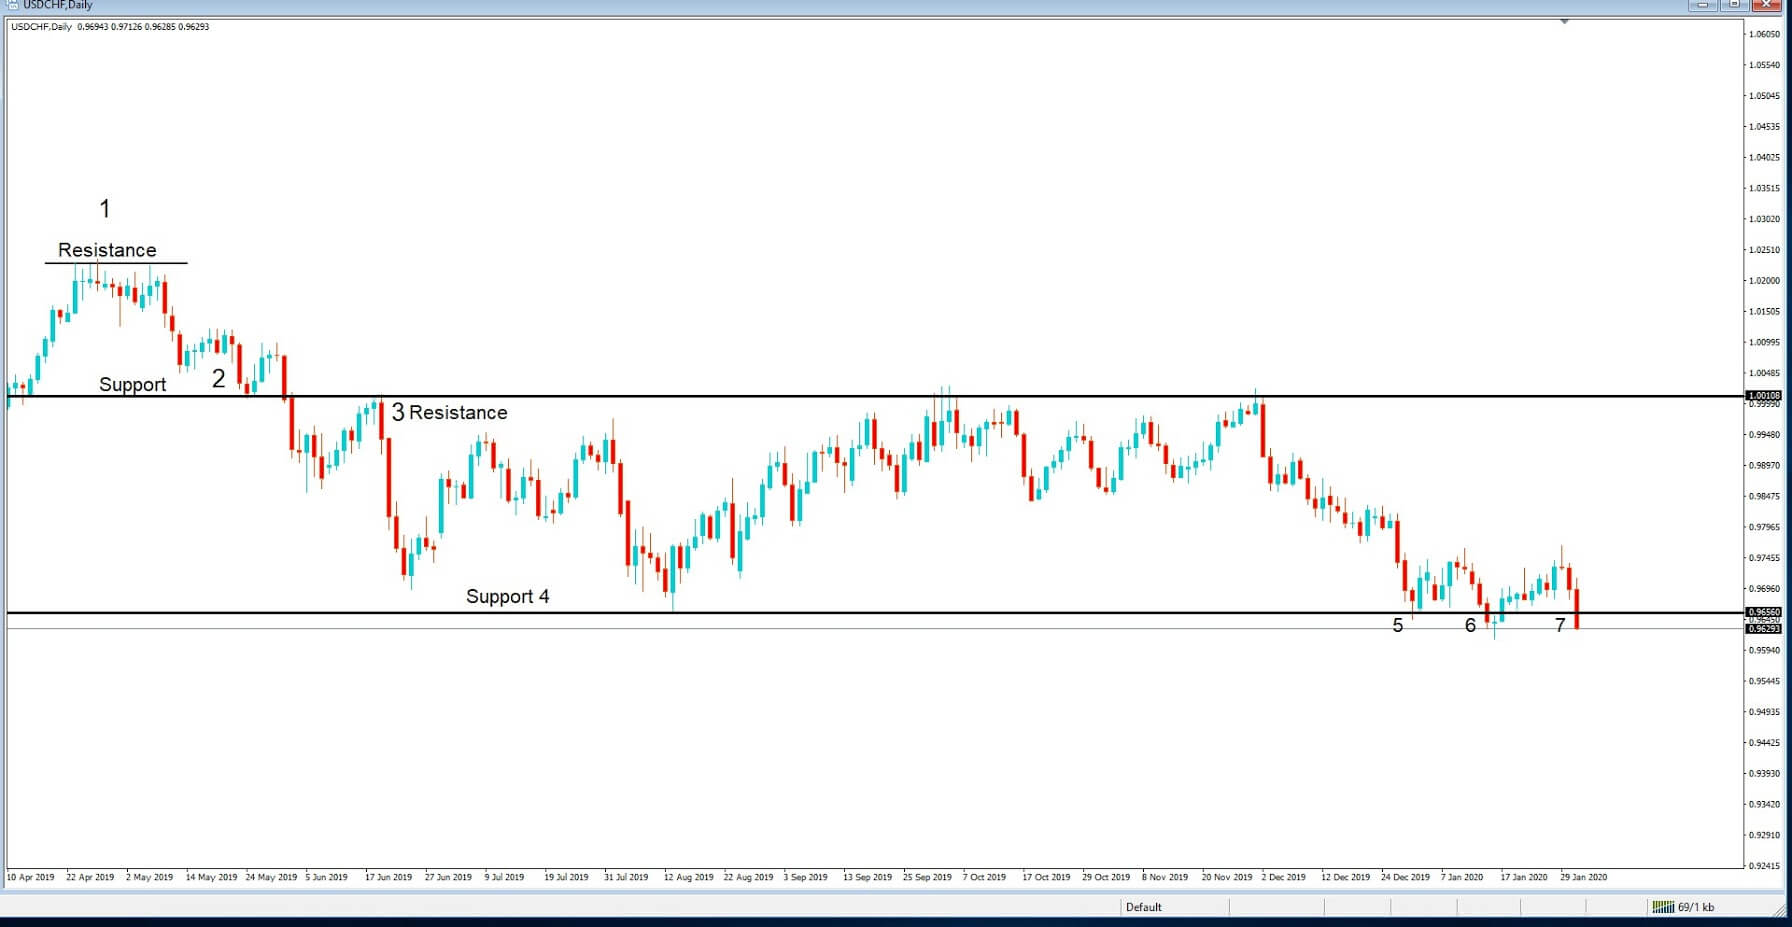
Example B
Example B is a daily chart of the EURCHF pair. Having looked at the previous chart, it is fairly straightforward to see what is going on with this pair. We have an overriding move lower with the pair at position 1, and where a support line has subsequently become a resistance line, with sideways price action at position 2, and where at position 3, price action has continued its move lower and reached the support line, which temporarily became an area of resistance before being breached and then moved lower.
Therefore this chart backs up our beliefs that we should be looking for opportunities to buy the Swiss Franc in the short to medium term. Perhaps during pullbacks, because we do not want to be entering trades, for example, the two pairs in question, which under any other circumstances than the current coronavirus outbreak, might be considered to be oversold.
CHFJPY is a symbolic representation of the Swiss franc against the Japanese yen. Here, CHF is the base currency, and JPY is the quote currency. Since it does not have USD involved, it is classified as a cross-currency pair.
Understanding CHF/JPY
The market price of this pair is the number of JPY that are required to purchase one CHF. It is quoted as 1 CHF per X JPY. For example, it’s current value is 112.31, then 112.31 yen are needed to buy one Swiss franc.
Spread
Spread in forex is the difference between the bid price of a currency and the ask price of it. And this pip difference is used up by the brokers as a form of fee. However, it is not a fixed value. It varies from brokers to brokers.
ECN: 1.3 | STP: 2.1
Fees
Spread is not the only form of fee that is levied by the brokers. There is a commission on the trade as well. The commission is nil on STP accounts, but pips on ECN accounts.
Slippage
When entering a trade using market orders, the trader does not get the exact price he intended when he executed it. There might be a difference in pips. This difference is referred to as slippage. Slippage may be in favor of or against the trader.
Trading Range in CHF/JPY
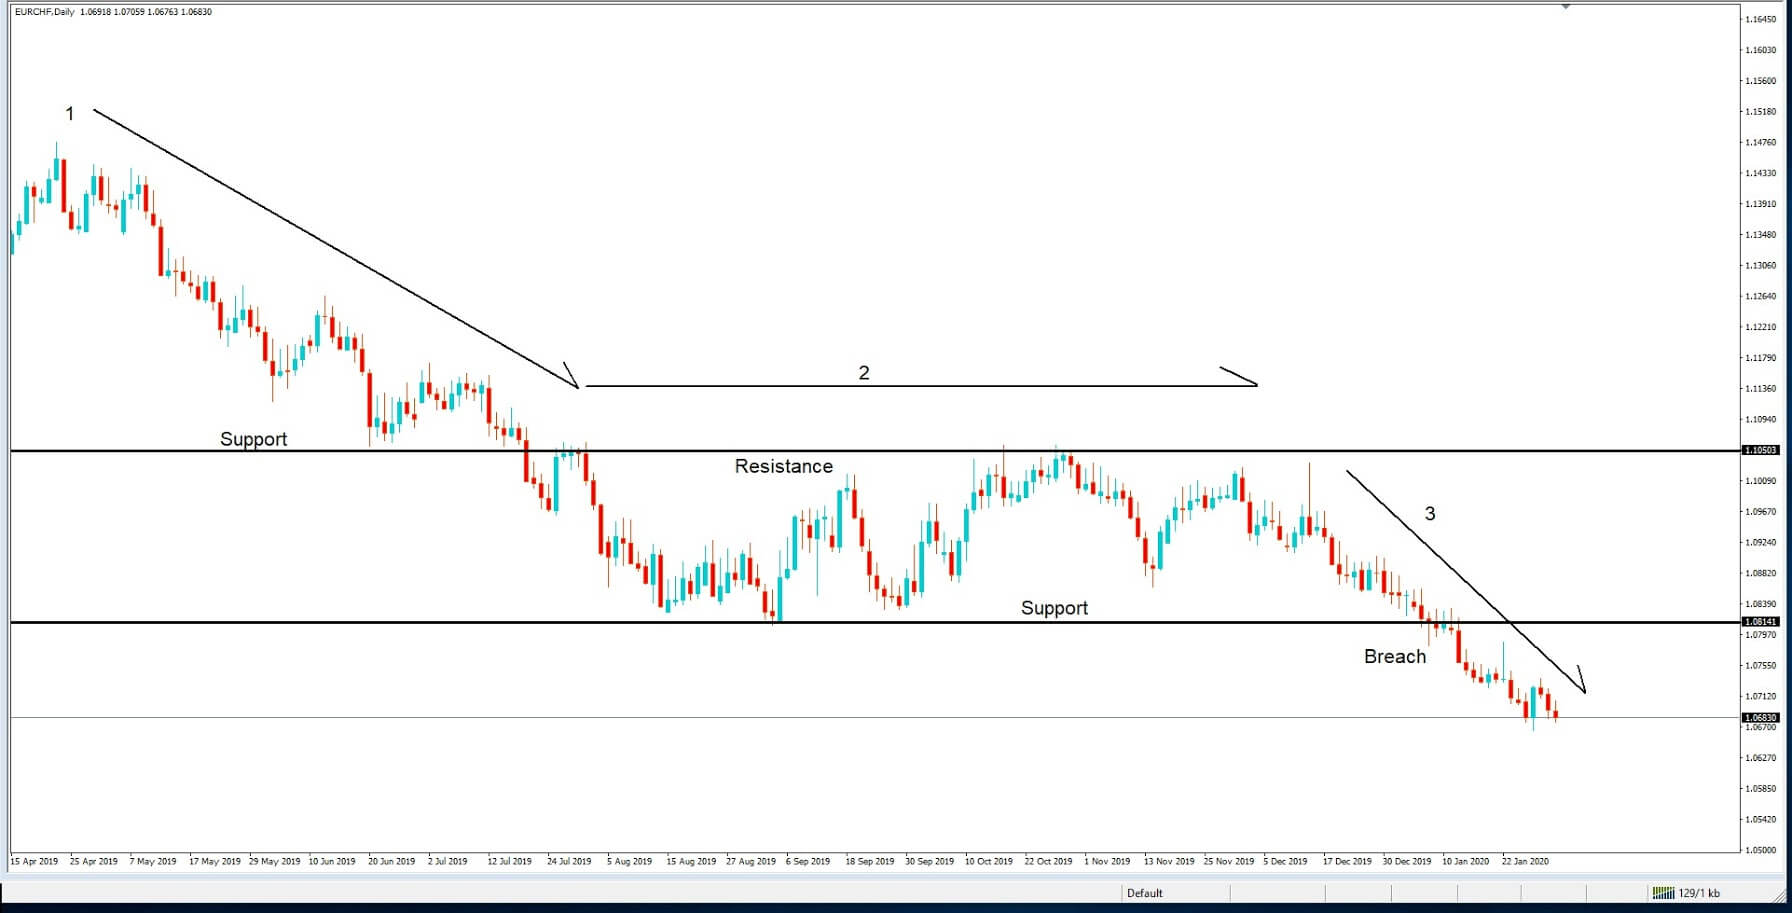
The trading range is simply a representation of the minimum, average, and maximum pip movement in a currency pair. With these values, one can assess how much money a trader will be risking in a particular timeframe. For example, if the average pip movement on the 4H in this pair is 15 pips, then a trader can expect to win or lose $150.6 in about 4H or so.
Shrink the chart so you can determine a large time period
Select your desired timeframe
Measure the floor level and set this value as the min
Measure the level of the 200-period SMA and set this as the average
Measure the peak levels and set this as Max.
CHF/JPY Cost as a Percent of the Trading Range
Apart from knowing the profit or loss can one can incur in a given timeframe, it is necessary to assess the cost of these trades as well. Below is a table that represents the cost variation in different volatilities. And these costs are determined by finding the ratio between the total cost and the volatility.
The forex market is open 24hours. However, it is not ideal to enter the market at any time. There are times when the costs are low, and times when it’s high.
The percentages in the table are directly proportional to the costs of the trade. It is seen that the percentages are high in the minimum column, and low in the maximum column. Hence, we can conclude that costs are inversely proportional to the volatility of the market. Now, when it comes to choosing the right time to trade, it is best to enter during those times when the volatility of the market is around the average values. This will ensure enough volatility in the market and low costs as well.
In addition, placing orders using limit/pending orders reduces costs too because this will completely nullify the slippage on the trade and will bring down the total cost significantly.
AUDCHF is the abbreviation for the Australian dollar and the Swiss franc. It is a cross-currency pair in the market. AUD being on the left is the base currency, and CHF (on the right) is the quote currency. One can expect high volatility and liquidity during the Australian session.
Understanding AUD/CHF
The value of AUDCHF represents the amount of Swiss Francs required to buy one Australian dollar. It is quoted as 1 AUD per X CHF. For example, if the value of AUDCHF is 0.6885, then this number represents the CHF that is to be produced by the trader to buy one AUD.
AUD/CHF Specification
Spread
Spread is the difference between the bid price and the ask price of the market set by the brokers. It is not a fixed value. It differs from the account type as well as the broker.
ECN: 0.7 | STP: 1.7
Fees
Brokers charge a fee on every trade a trader takes. It could be per execution or finished trade (round trip). Also, it varies from the type of account model. Typically, fee on ECN type is 5-10 pips, and 0 on STP type.
Slippage
Slippage is the difference between the price demanded by the trader and the price he actually received from the broker. There is always a variation in this due to the broker’s execution speed and market volatility.
Trading Range in AUD/CHF
Wanting to know how much profit one can make in a given time? If so, then you may find the answer in the table illustrated below. This table is the representation of the min, average, and max volatility of the currency pair in different timeframes. And with these values in the table, one can determine the profit on a trade.
Shrink the chart so you can determine a significant period
Select your desired timeframe
Measure the floor level and set this value as the min
Measure the level of the 200-period SMA and set this as the average
Measure the peak levels and set this as Max.
AUD/CHF Cost as a Percent of the Trading Range
The cost as a percent of the trading range is determined in the following table using different volatilities, assuming that the trading range can be seen as the potential profit on a given timeframe. The percentages are obtained by finding the ratio between the total cost of the trade and the range values. These values, thus, help in assessing the right moments in the day to trade the currency pair.
Firstly, the higher the value of the percentage, the higher is the cost of the trade. It is pretty evident from the above tables that the costs are higher in the min column and keep decreasing in the subsequent columns. Meaning, as the volatility increases, the total cost of the trade reduces. But, it is not ideal to trade in either of the extremes. To have an affordable cost and optimal volatility, it is best to enter during those times of the day when the pip movement for the pair is more or less equal to the average values.
Furthermore, the total cost can easily be reduced by trading using limit order instead of market orders. This methodology would bring down the slippage to zero. Hence, significantly affecting the percentage values. And an example of the same is depicted below.
NZDCHF is a cross-currency pair in the Forex market. It is an abbreviation for the New Zealand dollar and the Swiss franc. Here, NZD is the base currency, and CHF is the quote currency.
Understanding NZD/CHF
The value of NZDCHF simply represents the units of CHF equivalent to one unit of NZD. It is quoted as 1 NZD per X CHF. For example, in the market, if the price of NZDCHF is 0.64535, then it requires those many units of CHF to buy one NZD.
NZD/CHF Specification
Spread
The bid price and ask price in the market is typically not the same. The difference between these two prices is referred to as the spread. And this difference amount is used by the broker. It varies from the type of account model.
ECN: 1.1 | STP: 1.9
Fees
The fee is basically the commission that has to be paid on each trade you take. It varies from broker to broker and their execution type. Typically, there is no fee on STP accounts, but a few pips on ECN accounts.
Slippage
Another type of fee traders have to bear is the slippage. It is the difference between the trader’s requested price and the broker’s executed price. Slippage always is changing due to the ups and downs in market volatility and the broker’s execution speed.
Trading Range in NZD/CHF
Many novice traders randomly take trades without determining the amount they’re going to risk. The trading range is that representation, which indirectly illustrates the risk and profit area in a trade, in a given time frame. For example, if the average pip movement on NZDCAD on the 4H timeframe is 20 pips, then the trader will be risking $205.4 in an hour on an average.
Shrink the chart so you can assess a large time period
Select your desired timeframe
Measure the floor level and set this value as the min
Measure the level of the 200-period SMA and set this as the average
Measure the peak levels and set this as Max.
NZD/CHF Cost as a Percent of the Trading Range
Apart from knowing the profit/loss that can be made from a trade in a given time, it is also necessary to know the cost variation in different volatilities and timeframes. Below is a table representing the cost as a percentage that is obtained by considering the volatility, timeframe, and the total cost on a trade.
Trading on any timeframe and during any volatility is not an efficient way of trading. There are specific times in the market when you must enter/exit. This can be determined from the above two tables. Firstly, the higher the magnitude of the percentage, the higher is the cost of a trade for that particular timeframe and volatility. It can be ascertained from the table that the costs are low for high volatilities and high for low volatilities. And neither of the two states is ideal to trade. To keep your cost affordable and volatility moderate, it is ideal to trade when the volatility is nearby the average values.
Furthermore, it is recommended to have strategies that enable the use of limit orders. Because trading with limit orders will completely cut off the slippage on the trade Nullifying it, the total cost will significantly reduce, which, in turn, will reduce the cost percentage as well. For example, it was observed that cost percentages were reduced by about 50% when the slippage was removed.
Introduction GBPCHF is the abbreviation for the Great Britain pound and the Swiss franc. Since USD is not involved in this pair, it is called a minor currency pair. However, there is an excellent liquidity and volatility in this pair. In this pair, GBP is the base currency, and CHF is the quote currency. GBPCHF […]
Introduction GBPCHF is the abbreviation for the Great Britain pound and the Swiss franc. Since USD is not involved in this pair, it is called a minor currency pair. However, there is an excellent liquidity and volatility in this pair. In this pair, GBP is the base currency, and CHF is the quote currency. GBPCHF […]
Introduction
GBPCHF is the abbreviation for the Great Britain pound and the Swiss franc. Since USD is not involved in this pair, it is called a minor currency pair. However, there is an excellent liquidity and volatility in this pair. In this pair, GBP is the base currency, and CHF is the quote currency. GBPCHF is often referred to as “pound Swiss franc.”
Understanding GBP/CHF
The value of GBPCHF determines the Swiss francs required to purchase one pound. It is quoted as 1 GBP per X CHF. For example, if the value of GBPCHF is 1.2740, then one needs to pay 1.2740 Swiss francs to buy a pound.
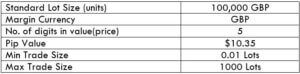
GBP/CHF Specification
Spread
Spread is the difference between the bid price and the ask price in the market. The bid price is the price used for shorting, and the bid price is the price used for buying a currency pair. These prices differ from broker to broker as well as the account type.
ECN: 0.8 | STP: 1.6
Fees
For every trade a trader takes, there is a fee associated with it. This fee is basically the commission charged by the broker. This fee varies from broker to broker. Note that there is no fee on STP accounts, and on ECN accounts, the fee is around 6 to10 pips.
Slippage
Slippage in trading is the difference between the price requested by the trader and the price given by the broker. Due to variation in volatility and the broker’s execution speed, it is not quite possible to get the exact intended price. Slippage happens only on market orders.
Trading Range in GBP/CHF
Knowing the number of pips the currency pair moved in a given timeframe is a good add-on to a trader’s analysis. This will help them get an idea of the profit/loss that can be made in a specified amount of time. For example, if the average pip movement on the 1D timeframe is 50 pips, then a trader can expect to gain or lose $517.5 (50 pips x 10.35 value per pip).
Shrink the chart so you can determine an extensive period
Select your desired timeframe
Measure the floor level and set this value as the min
Measure the level of the 200-period SMA and set this as the average
Measure the peak levels and set this as Max.
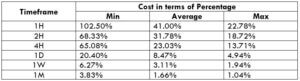
GBP/CHF Cost as a Percent of the Trading Range
The cost as a percent of the trading range depicts the magnitude of the variation in the cost in different timeframes for different variable volatility. The percentages are useful in determining the ideal time to enter into this currency pair with marginal costs. Below are the tables representing the cost percentages for minimum, average, and maximum volatility.
The lower the percentage, the lower are cost on the trade. In the table, we can infer that the costs are on the lower side in the max column. This implies that the cost of the trade is less when the volatility of the market is low and vice versa. Now, when it comes to the best time to trade this pair, it is ideal to pick at times when the volatility is decent, and the costs are affordable. For example, a 1D trader may trade during those times when the volatility is around 100 pips.
Moreover, the total cost of the trade can be reduced by entering and exiting trades using limit/pending orders. This way, the slippage on the trade will be fully cut off. The impact on the cost percentage when slippage is made 0 is shown below.
From the above table, it is evident that the costs have reduced by over 50% or so. Hence, it is preferable to trade using limit orders rather than market orders.
EURCHF is the abbreviation for the Euro area’s euro and the Swiss franc. This currency pair is a minor/cross currency pair. Here, EUR is the base currency, and CHF is the quote currency. Trading the EURCHF is commonly called trading the ‘swissie.’
Understanding EUR/CHF
The value of EURCHF determines the number of units of Swiss francs required to purchase one euro. It is quoted as 1 euro per X francs. For example, if the value of 1.3000, it means that one must pay 1.3000 francs to buy one euro.
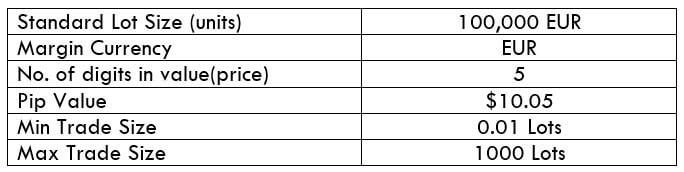
EUR/CHF Specification
Spread
Spreads are the way by which brokers make their money. There is a separate price to buy a currency pair and a separate price to sell it. To buy, one must refer to the ask price, and to sell, one must refer to the bid price of the currency pair. The difference between these two prices is known as the spread. This spread usually differs from account type. The average spread on ECN and STP model account are as follows:
ECN: 0.9 | STP: 1.6
Fees
The fee is nothing but the commission charged by the broker on a single trade. The fee also varies base on account type.
Note: The fee depends from broker to broker. Here, we have taken the average value by referring to some brokers.
Slippage
Slippage in trading is the difference between the trader’s desired price and the real executed price by the broker. The slippage value depends on two factors:
Broker’s execution speed
Currency pair’s volatility
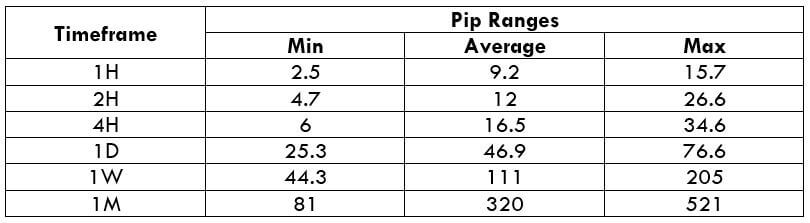
Trading Range in EUR/CHF
The trading range in EURCHF is the representation of the minimum, average, and maximum pip movement in different timeframes. These values can be used to assess one’s approximate profit or loss in a given time frame. For example, if the volatility on the 1H timeframe is five pips, then one can expect to be in a profit or loss of $50.25 (5 pips x $10.05 value per pip) in an hour or two.
Shrink the chart so you can assess a large time period
Select your desired timeframe
Measure the floor level and set this value as the min
Measure the level of the 200-period SMA and set this as the average
Measure the peak levels and set this as Max.
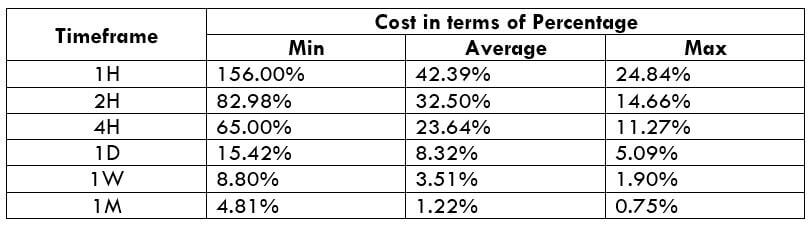
EUR/CHF Cost as a Percent of the Trading Range
Apart from assessing your profit and loss, one can find the best time of the day to enter and exit a trade. For this, another table is inserted that represents costs in terms of percentage. And the magnitude of these percentages determines the range of costs on each trade.
Comprehending ‘Cost as a percentage of trading range’
Note that the mentioned percentages are a unitless quantity, and we consider only the magnitude of it. If the percentage value is high, then the costs are high. If they’re low, the costs are low too. Relating it to volatility, if the volatility is high, the costs are low and vice versa.
The Ideal way to trade the EUR/CHF
Now that we’ve comprehended what the cost percentages mean, let us determine the best times to trade the EURCHF currency pair. The minimum column of the table has the highest percentages, while the max column has the lowest percentages for each timeframe. It is neither ideal to trade when the volatility is high & costs are low nor when the volatility is low, and the costs are high. The only option left is the average column. The average column consists of the median values for both volatility and costs. Hence, this becomes the most suitable time to enter into this currency pair for trading.
Limit orders and their benefits
Traders usually enter and exit trades using market orders. This is the sole reason for slippage to take place. This has a significant weight on the cost of the trade. However, placing a limit order instead will nullify the slippage on the trade.
The difference in the ‘costs as a percentage of trading range’ when the slippage is made nil is illustrated below.
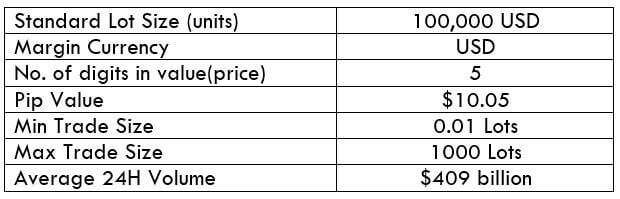
USD/CHF is the abbreviation for the US dollar and the Swiss franc. This pair is a major currency pair. USD is the base currency, while CHF is the quote currency. The pair as a whole tells how many units of the quote currency is needed to purchase one unit of the base currency. Trading USDCHF is as good as saying, trading the ‘Swissie.’
Understanding USD/CHF
The exchange value of USDCHF represents the number of Swiss francs required to buy one US dollar. For example, if the value of USDCHF is 0.9820, to purchase one USD, the trader must pay 0.9820 Swiss francs.
USD/CHF Specification
Spread
Spread in trading is the difference between the bid price and the ask price offered by the broker. It is measured in terms of pips and varies on the type of account and type of broker.
Spread on ECN: 0.8
Spread on STP: 1.6
Fees
There is a small fee or commission charged by the broker for every trade a trader takes. This depends on both types of accounts and broker. For our analysis, we have kept the fee fixed at one pip.
Slippage
Due to volatility in the market, a trader does not usually get the price that he demanded. The actual price differs from the demanded price. This difference is referred to as slippage. For example, if a trader executes a trade at 0.9890, the real price received would be 0.9892. This difference of two pips is known as slippage.
Trading Range in USD/CHF
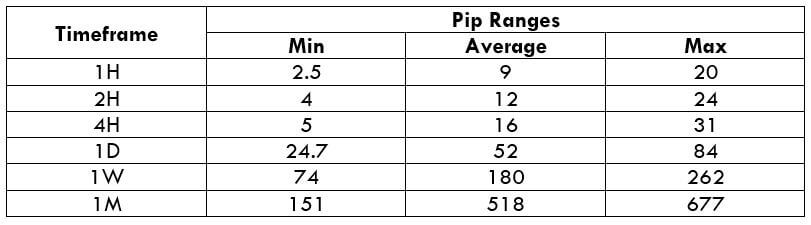
The trading range is a tabular representation of the minimum, average, and maximum pip movement on a particular timeframe. Having knowledge about this is necessary because it helps in managing risk as well as determining the right times of the day to enter and exit a trade with minimal costs.
Below is a table that depicts the minimum, average, and maximum volatility (pip movement) on different timeframes.
Shrink the chart so you can assess a large time period
Select your desired timeframe
Measure the floor level and set this value as the min
Measure the level of the 200-period SMA and set this as the average
Measure the peak levels and set this as Max.
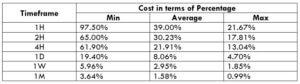
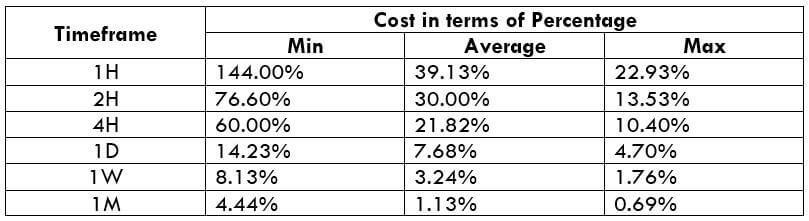
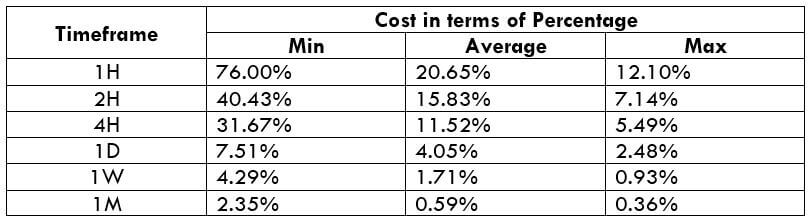
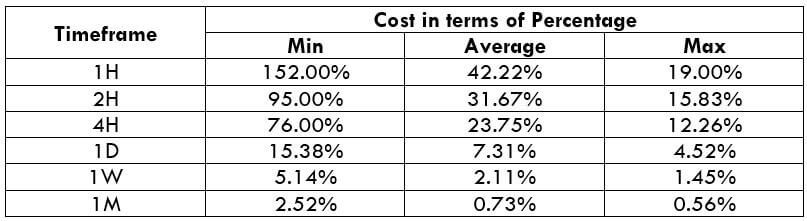
USD/CHF Cost as a Percent of the Trading Range
The number of pips the currency pair move in each timeframe is shown in the above table. Now, we apply these values to find the cost percentage when the volatility is minimum, average, and max. This cost percentage will then help us filter out the most optimal time of the day to take trades.
The comprehension of the cost percentage is simple. If the percentage is high, then the cost is high for that particular timeframe and range. If the percentage is low, then the cost is relatively low for that timeframe and range.
Note that, the total cost on a single trade is calculated by adding up the spread, slippage, and trading fee.
Entering and exiting trades during any time of the day might not be the smartest move. There are particular times of the day a trader must manage their trade to reduce both risk and cost on the trade. This can be made possible by comprehending the above two tables.
The percentages are highest in the min column. Meaning, the cost is pretty high when the volatility of the market is low. For example, on the 1H timeframe, when the volatility is 2.5 pips, the cost percentage is 152%. This means that one must bear high costs if they open or close trades when the volatility is around 2.5 pips. So, ideally, it is recommended to trade when the market volatility is above the average mark.
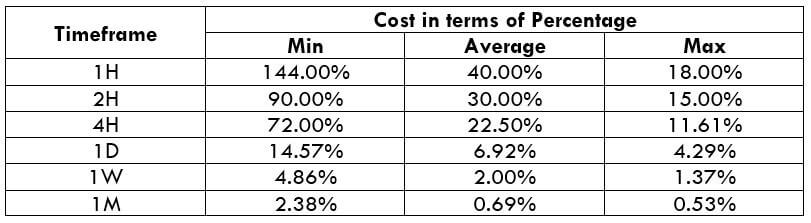
Apart from that, it is much better if one trades using the limit orders rather than market orders, as it nullifies the slippage on the trade. In doing so, the costs of each trade will reduce by about 50%.


 Spread