Categories
Forex Videos

Forex Price Action Noise! How To Analyse Timeframes!

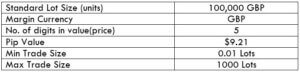
aThe Problem With Price Action Noise

In forex trading, a term that is used quite often in technical analysis is market or price action ‘noise.’ Quite often, we find that price action in Any Given currency pair spends an awful lot of time sideways or consolidation motion. Or where price action seems to be rising and falling in small increments, but where these moves tend to form the basis of a trend. However, the lower you go on a time frame and especially with regard to the 1-minute and 5-minutes time frame, the more difficult it becomes in ascertaining exactly where the trend is going, whether it be a part of a bullish move or a bearish move or if it is a part of a consolidation phase.


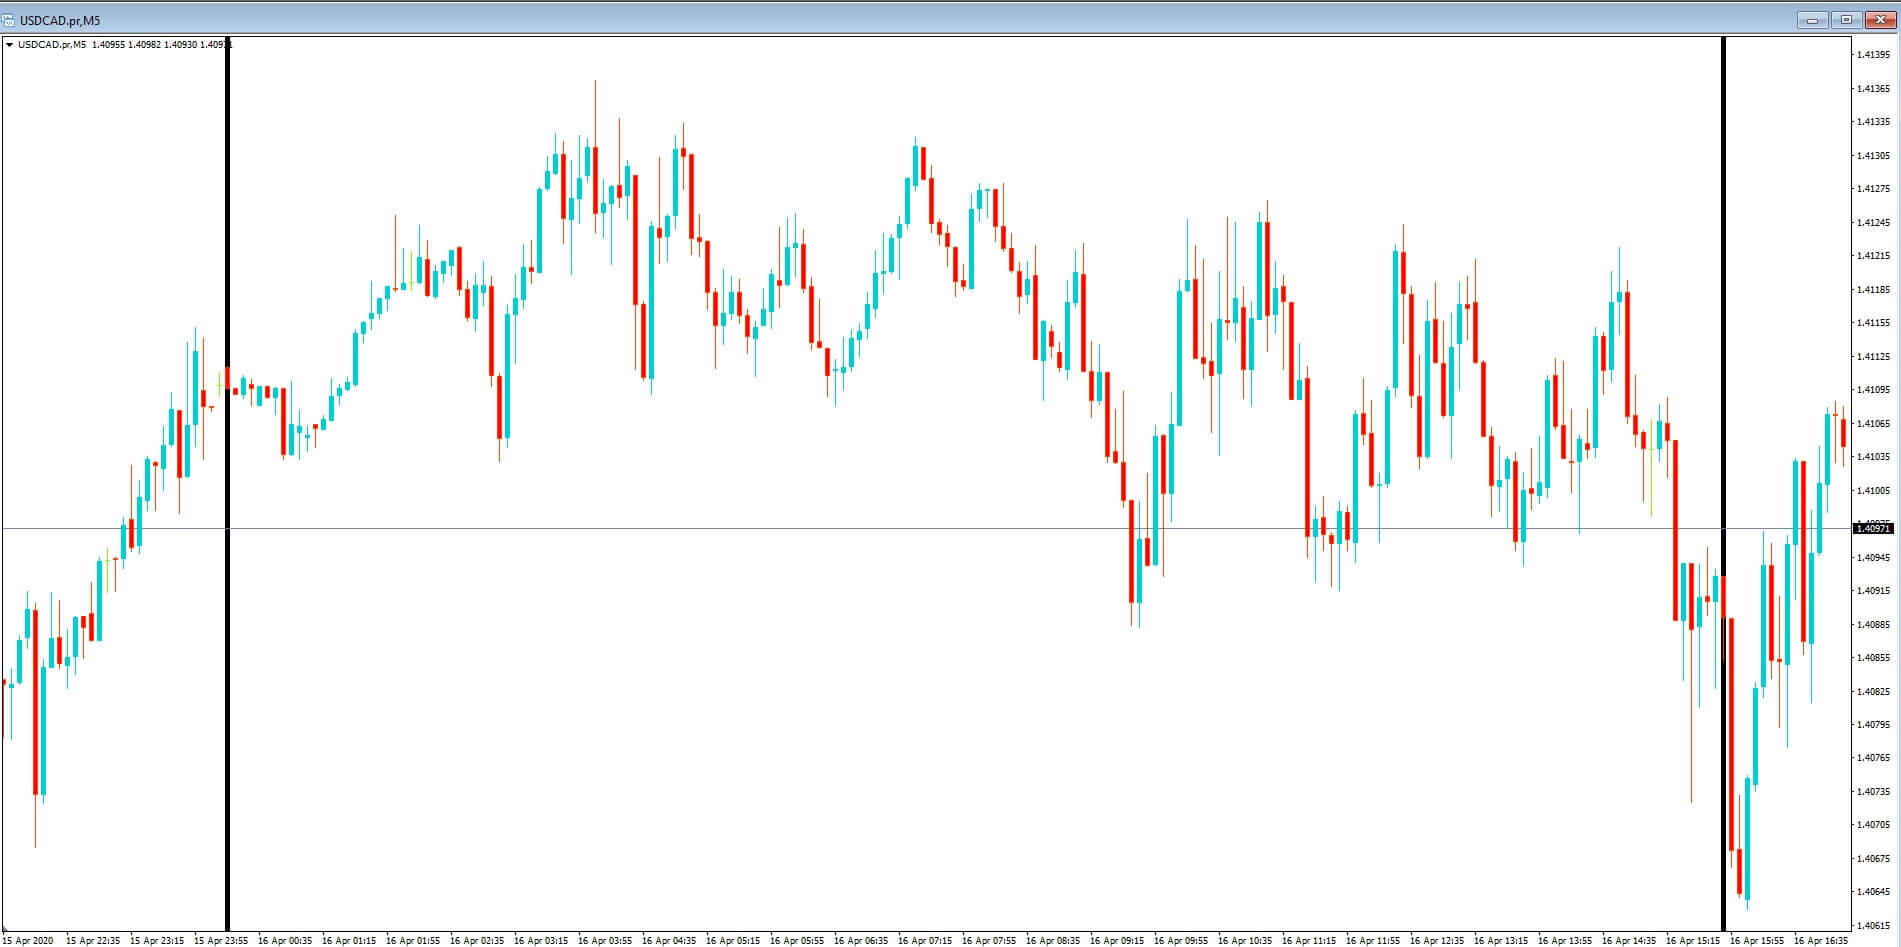
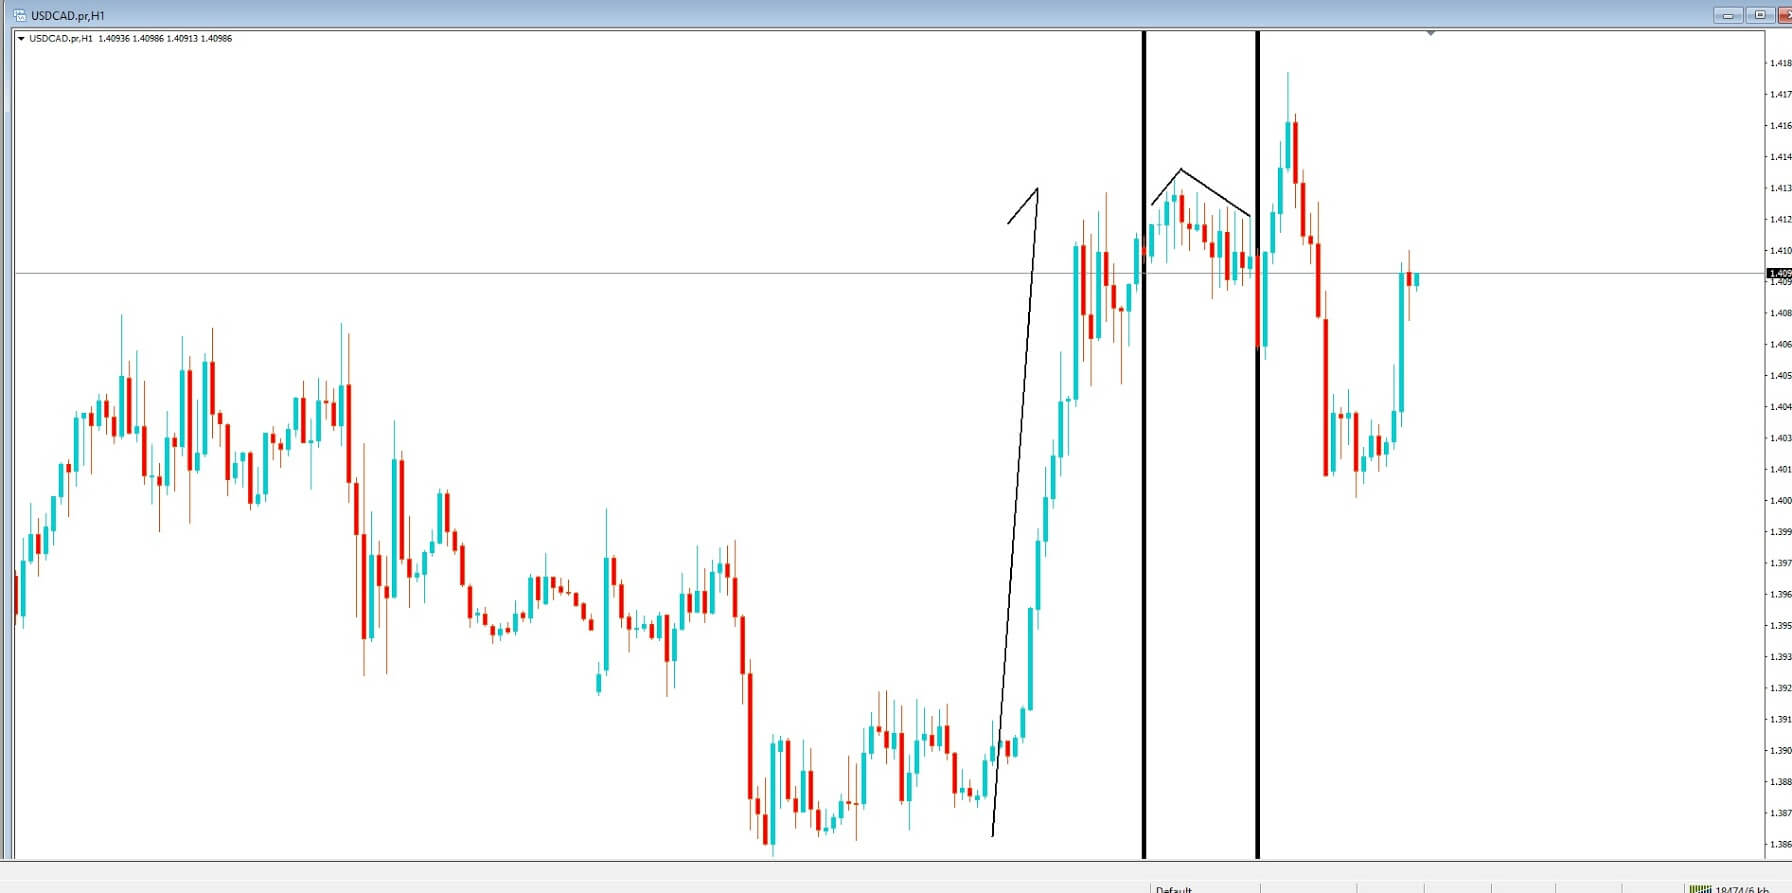
Insert A: This is a section of price action on a 5-minute chart of the USDCAD pair. We have added two vertical bars because this is the period that we want to drill down on a little bit more.


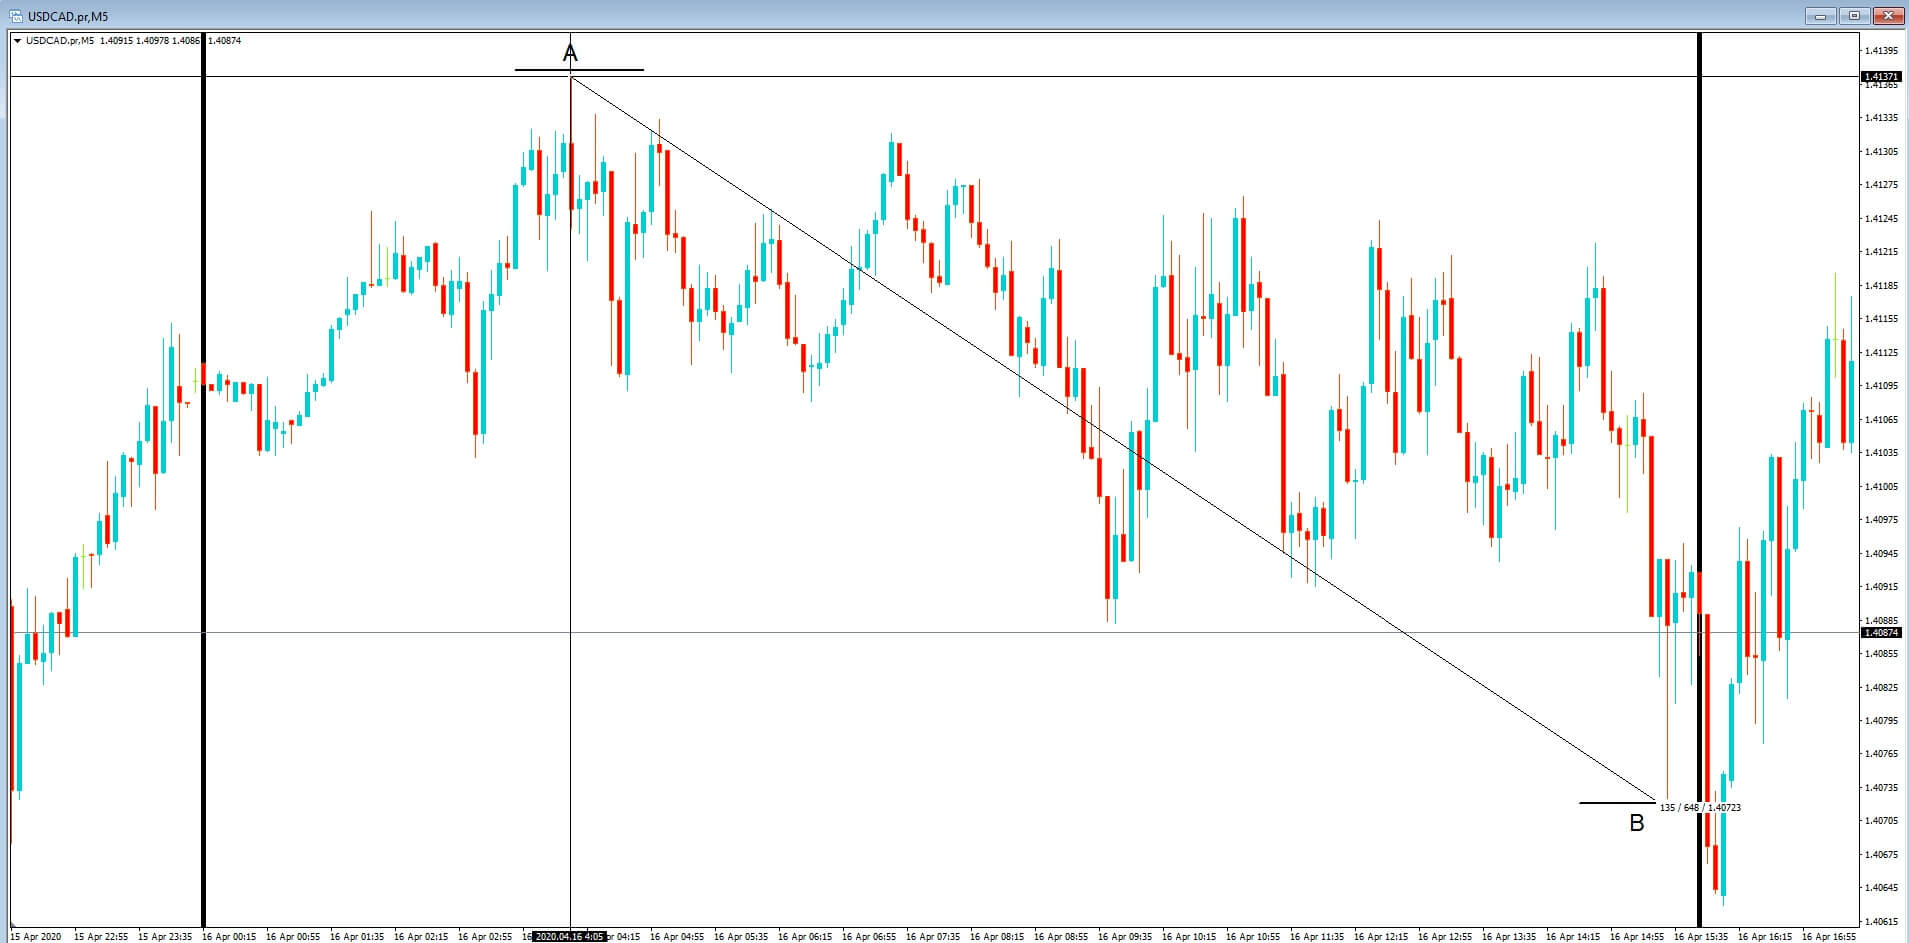
Insert B: This is the same section, but we have added 2 points on the charts at position a and b, and where the interest rate differential is 64 pips. That is to say, had you gone short at position a the maximum you would have made had you got out at position B would have been 64 pips less your spread. And of course had you bought the pair at position A and still being in the trade at position B you would have been offside by 64, pips plus your spread.


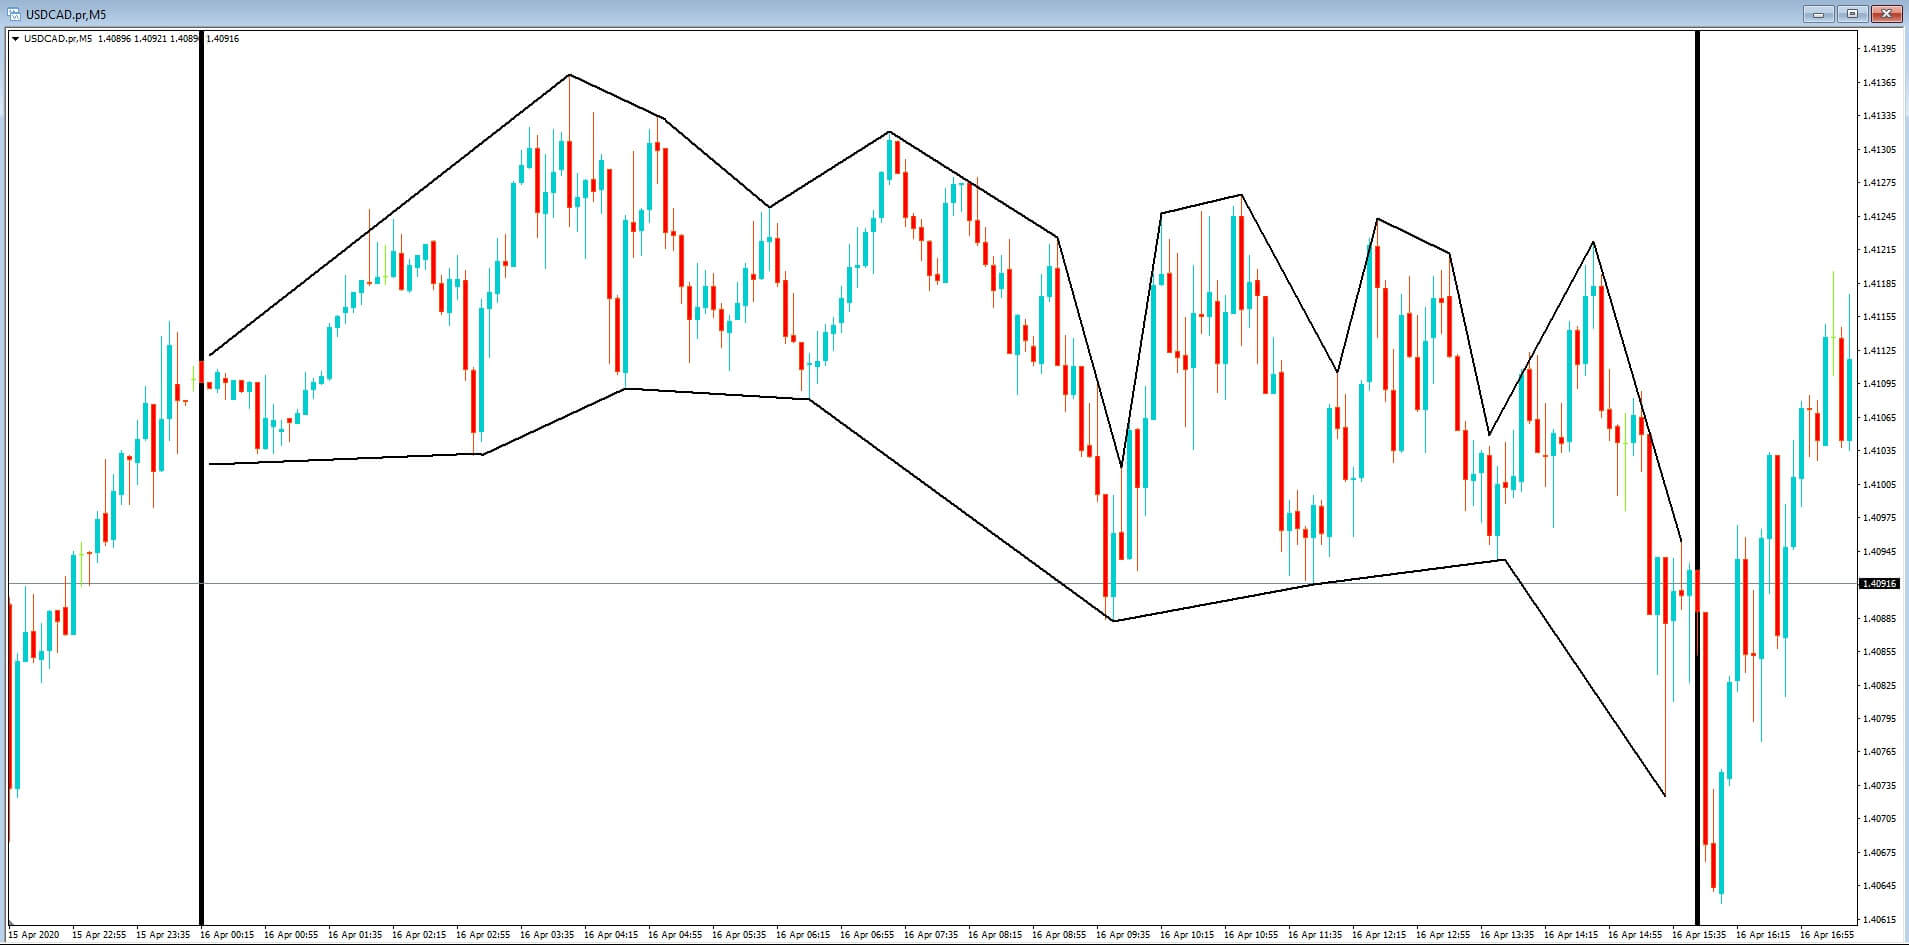
Insert C: In this section, we have added our own channel, where we can see a lot of rise and fall and tight consolidation in periods where the price is contracting within the range, but this in itself would become difficult to trade, especially if looking for trends.


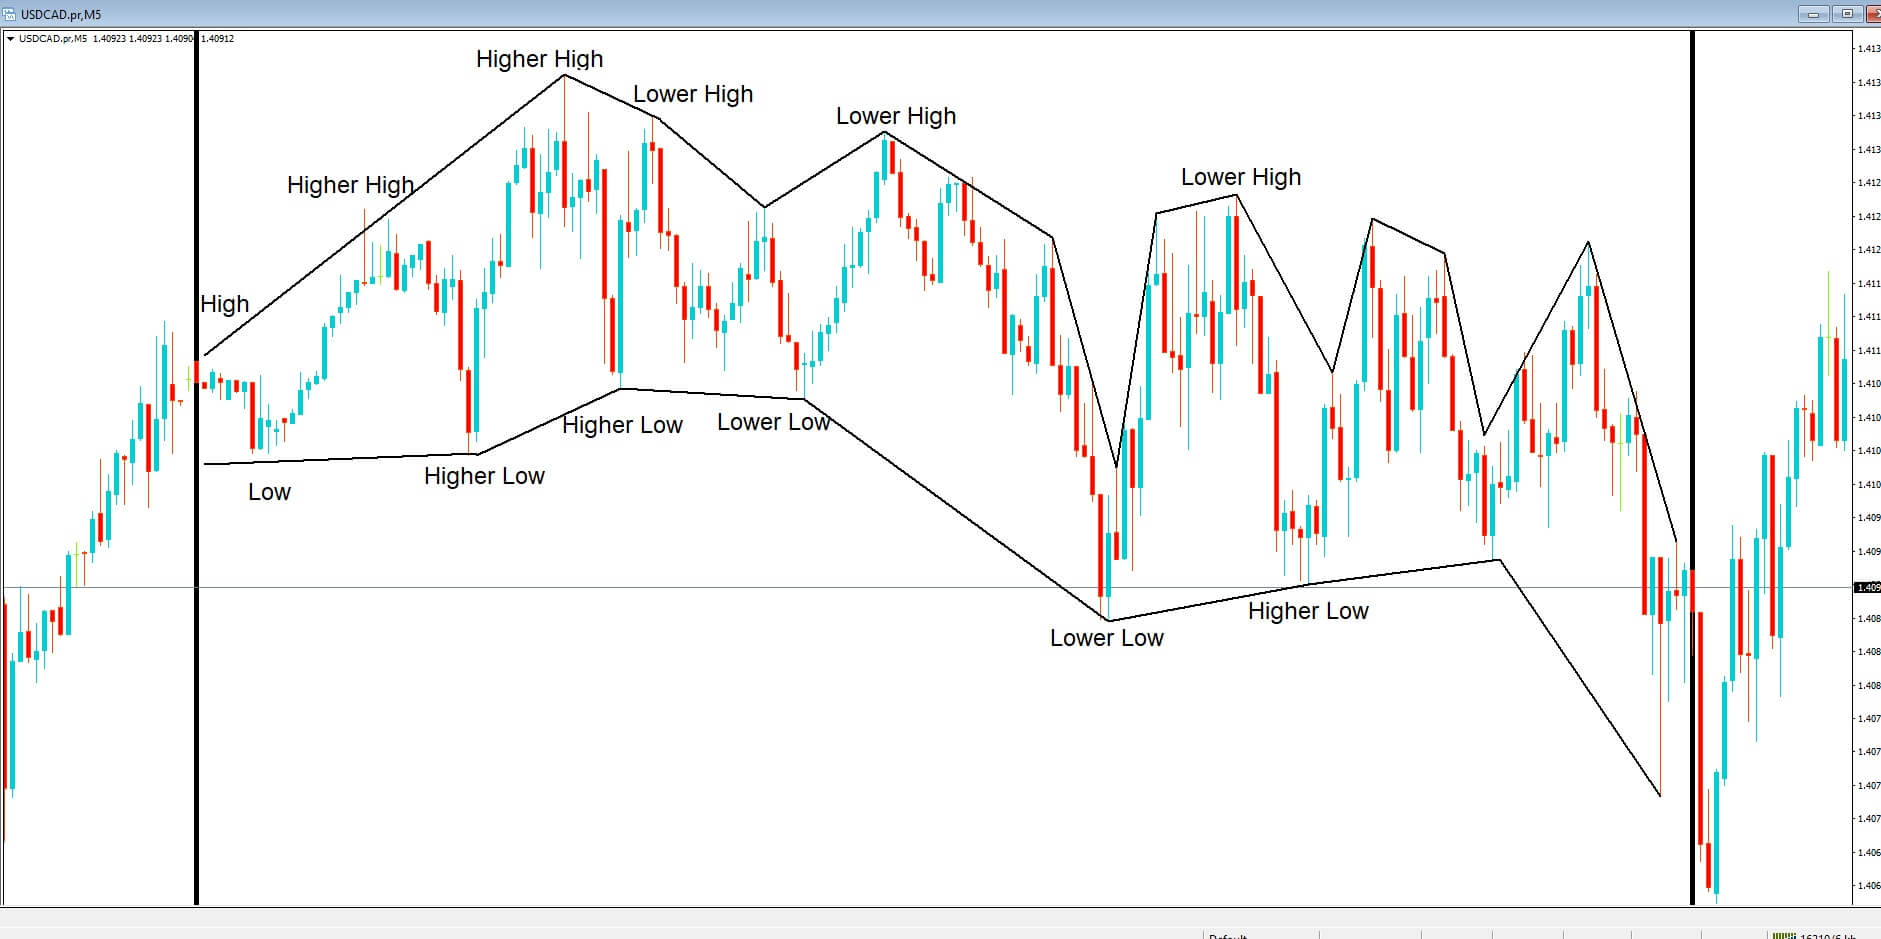
Insert D, Now scalpers, while incorporating technical tools such as statistics, might argue that a few pips could be made here and there possibly based on highs with higher highs and lower lows, etc.

Insert E, But this type of technical analysis can quickly fall out of kilter in areas such as where we have highlighted we suddenly have a lower or high which is followed by buy a higher low, where we would need a lower low in order for the pair to remain in a bearish price pattern.


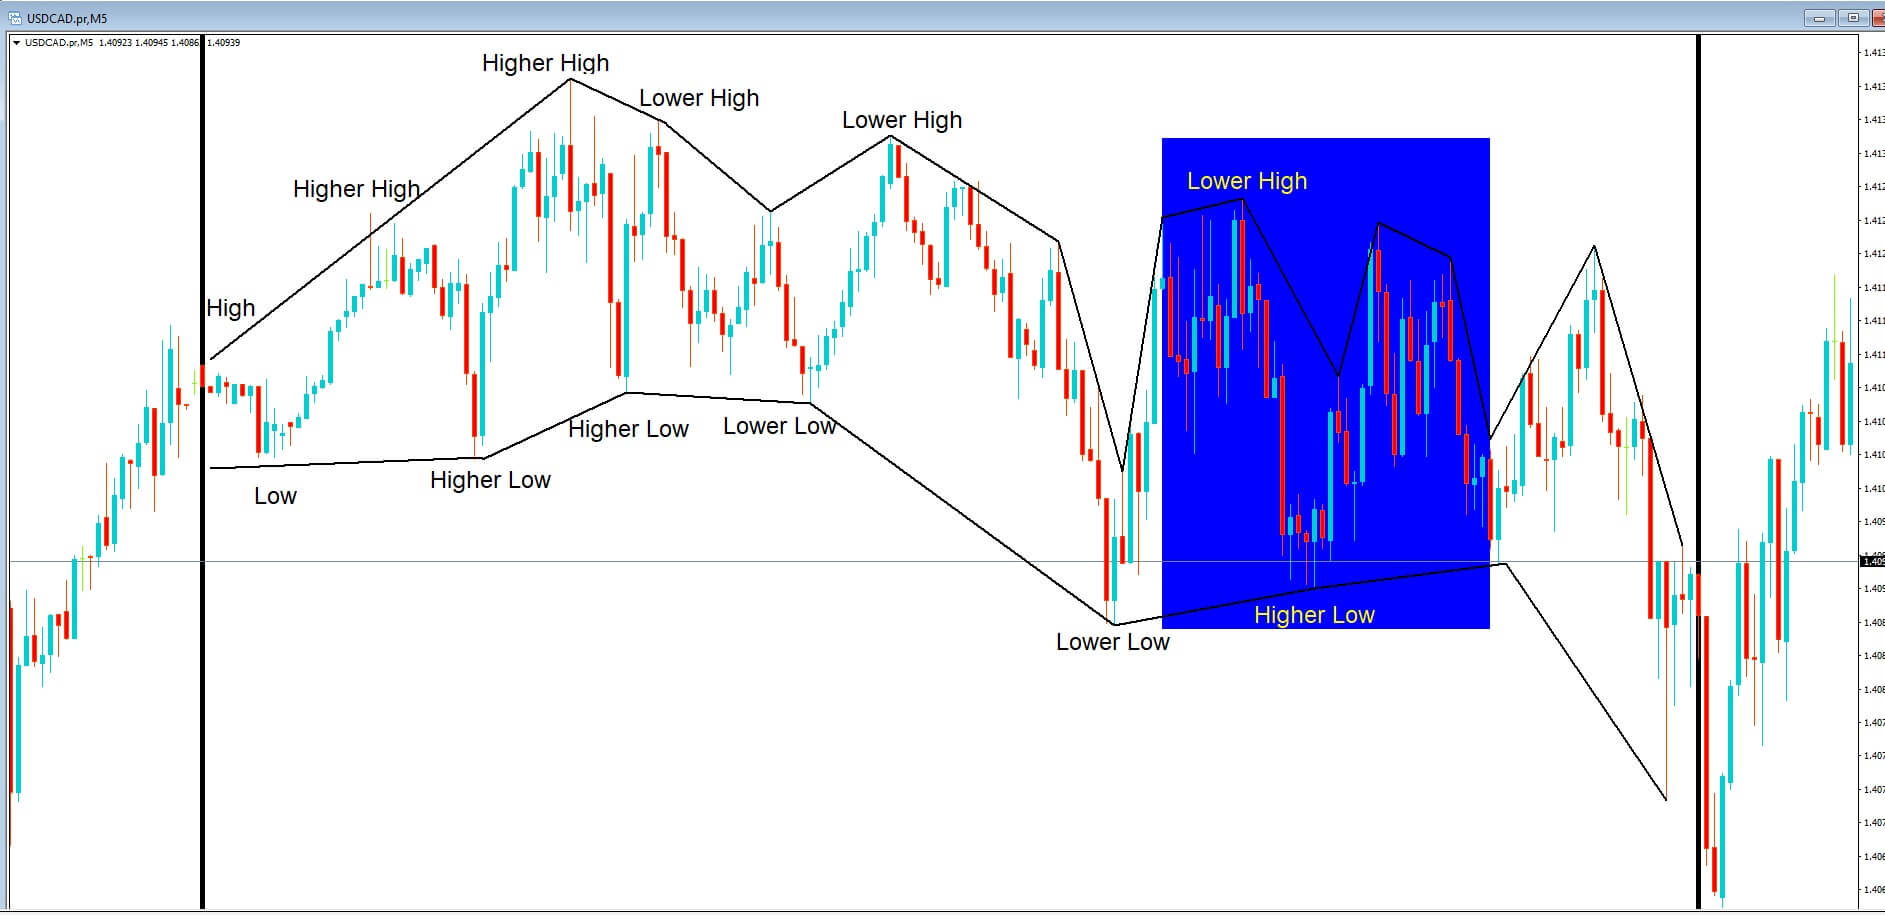
Insert F. This is also complicated in the area where we have highlighted where we see candles grouped together, which are both bullish and bearish and where several are more wick than candle telling traders that neither bulls nor the bears have this pair under control at this time. This is market noise. And while such noise can be seen in all time frames, the trick is to move up to a higher one to find out where directional bias might be heading.


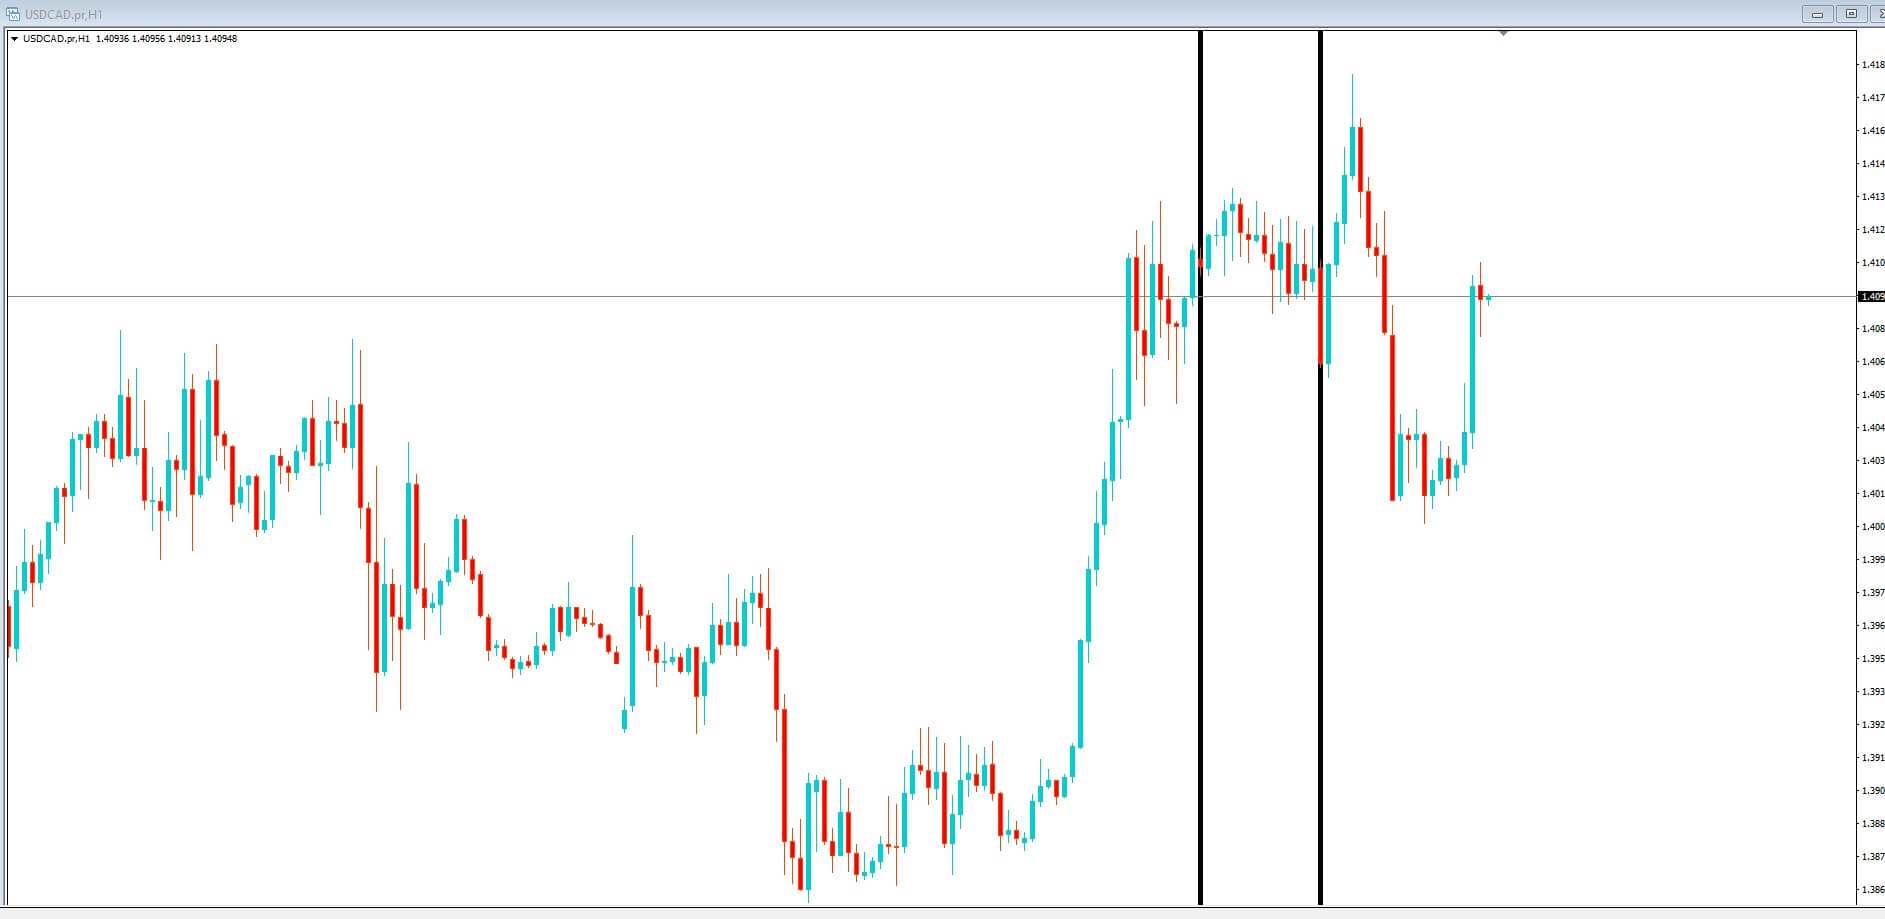
Insert G. However if we moved to a higher time frame, such as the 1-hour time frame here and again, look at the price action within the two horizontal lines we get some more clarity about what is really happening to this pair over the time period which we have highlighted.


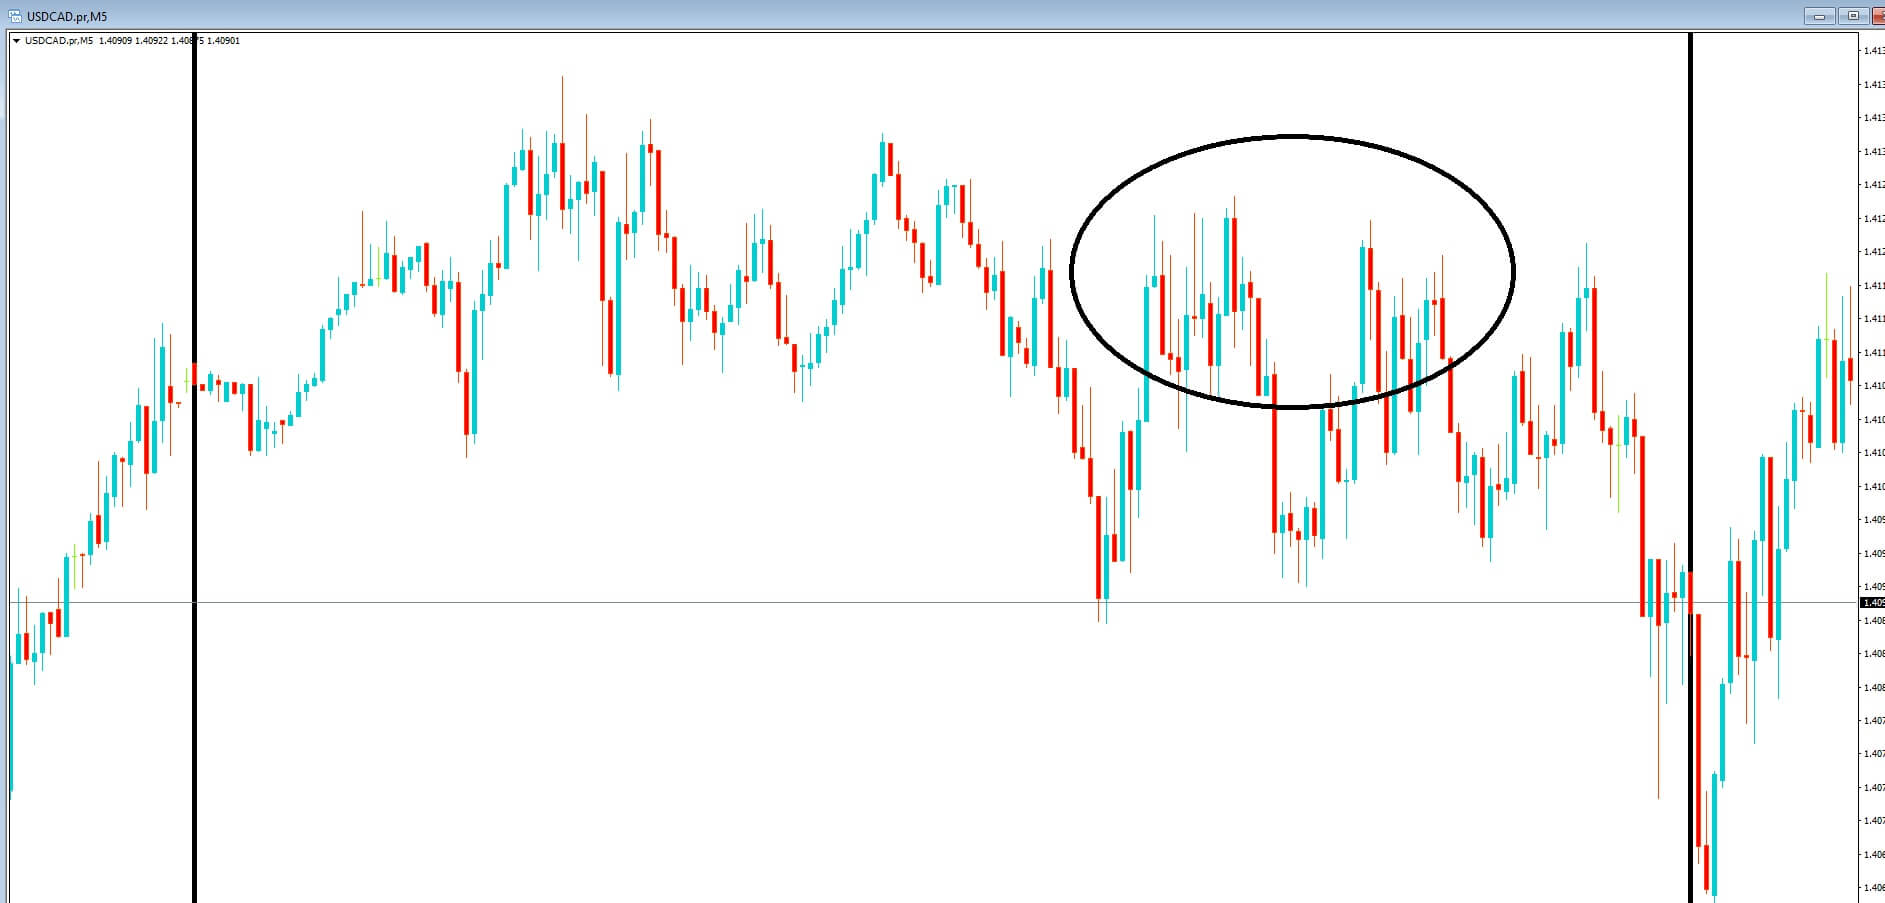
Insert H, And here we can see that the price action is consolidating after a rally to the upside and where we have a V-shaped potential reversal pattern within our highlighted area.
There is an old saying which I’m sure you’ve heard of that sometimes you can’t see the wood for the trees. Well, this is a perfectly good example, where in order to avoid the noise of the lower time frames, we must always look to the higher time frames to try and ascertain what the general bias is, even if you prefer to trade the lower ones.

Categories
Forex Assets

Information About The GBP/JPY Forex Currency Pair

Introduction

The Great Britain pound versus the Japanese yen is a cross-currency pair in the forex market. It is a widely traded pair with great liquidity and volatility. In this currency pair, GBP is the base currency, and JPY is the quote currency.

Understanding GBP/JPY

The market price of GBPJPY shows the units of yens required to purchase one pound. It is quoted as 1 GBP per X JPY. For example, if the value of GBPJPY is 143.82, then 143.82 yen are to be produced by the trader to buy one pound.

GBP/JPY Specification

Spread

Spread is the difference between the bid price and the ask price set by the broker. These prices vary from broker to broker and type of account model as well. The approximate spread on ECN and SPT accounts is mentioned as follows.

ECN: 0.7 | STP: 1.6

Fees

There is a fixed round-trip fee on every trade a trader takes. On ECN accounts, the spread is around 6 to 10 pips. And on STP accounts, there is no fee as such. However, though there is no fee on STP accounts, the total fee is still compensated with the high spread on it.

Slippage

Slippage is another parameter that adds up to the total fee. It is the difference between price executed by the trader and price he actually received from the broker. This happens solely due to the change in volatility of the market and the broker’s execution speed.

Trading Range in GBP/JPY

The trading range is a pip depiction tool that determines the minimum, average, and maximum pip movement in a different timeframe. This volatility table is pretty useful in analyzing the amount of risk that is involved in a trade. For example, if the max pip movement on the 4H is 60 pips, then a trader can get an idea that he can gain/lose a max of $552.6 in a time frame of 4 hours.

Procedure to assess Pip Ranges

  1. Add the ATR indicator to your chart
  2. Set the period to 1
  3. Add a 200-period SMA to this indicator
  4. Shrink the chart so you can assess a large time period
  5. Select your desired timeframe
  6. Measure the floor level and set this value as the min
  7. Measure the level of the 200-period SMA and set this as the average
  8. Measure the peak levels and set this as Max.

GBP/JPY Cost as a Percent of the Trading Range

The cost as a percent of the trading range is again the volatility but combined with total cost on a trade. It is a tabular representation of the cost of trading in varying timeframes and volatilities. The percentages are obtained simply by finding the ratio between the total cost and volatility.

ECN Model Account

Spread = 0.7 | Slippage = 2 |Trading fee = 1

Total cost = Slippage + Spread + Trading Fee = 2 + 0.7 + 1 = 3.7

STP Model Account

Spread = 1.6 | Slippage = 2 | Trading fee = 0

Total cost = Slippage + Spread + Trading Fee = 2 + 1.6 + 0 = 3.6

The Ideal way to trade the GBP/JPY

The magnitude of the percentages basically determines how high or how low the costs are for each trade. If the percentage is high, the costs are high. If they are low, the costs are low. The very first observation that can be made is that the costs are high in the min column comparative to the average column and maximum column. Hence, the costs are high for low volatile markets, and low for high volatile markets. But, it is not ideal to trade in either of these markets. The best time to get into the pair is when the volatility is around the average values. As far as the timeframes are concerned, the cost decreases as the width of the timeframe increases.

Placing limit orders is another way to minimize your cost significantly. Because this will not take slippage into consideration for calculating the total costs. Thus, the total cost reduces greatly. An example of the same is illustrated below.

Hence, we can see that the percentages have reduced by around 50% or so.