Categories
Forex Course

171. The Best Timeframe for Forex Markets

Introduction

In our previous lesson, we looked at which timeframes you should trade in the forex market. We established that the timeframes you trade depend on the type of forex trader that you are. This lesson will cover the best timeframes to trade using illustrations depending on the type of forex trader you are.

Best Timeframe for Forex Position Trading

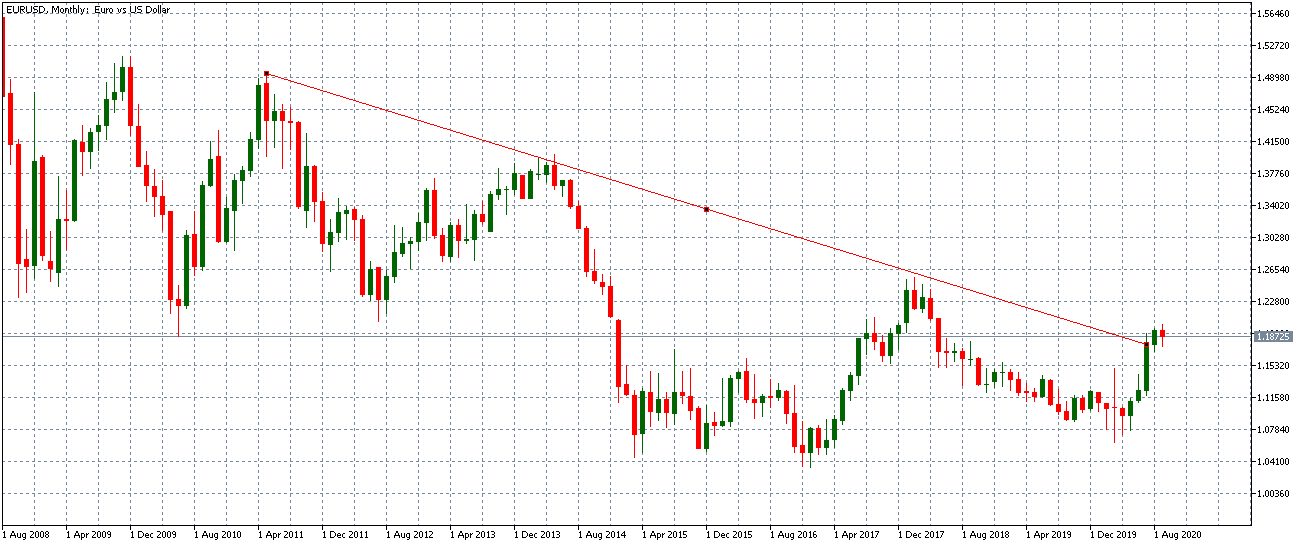
1-Month EUR/USD Primary Trend Timeframe

The monthly timeframe shows a downtrend in the pair.

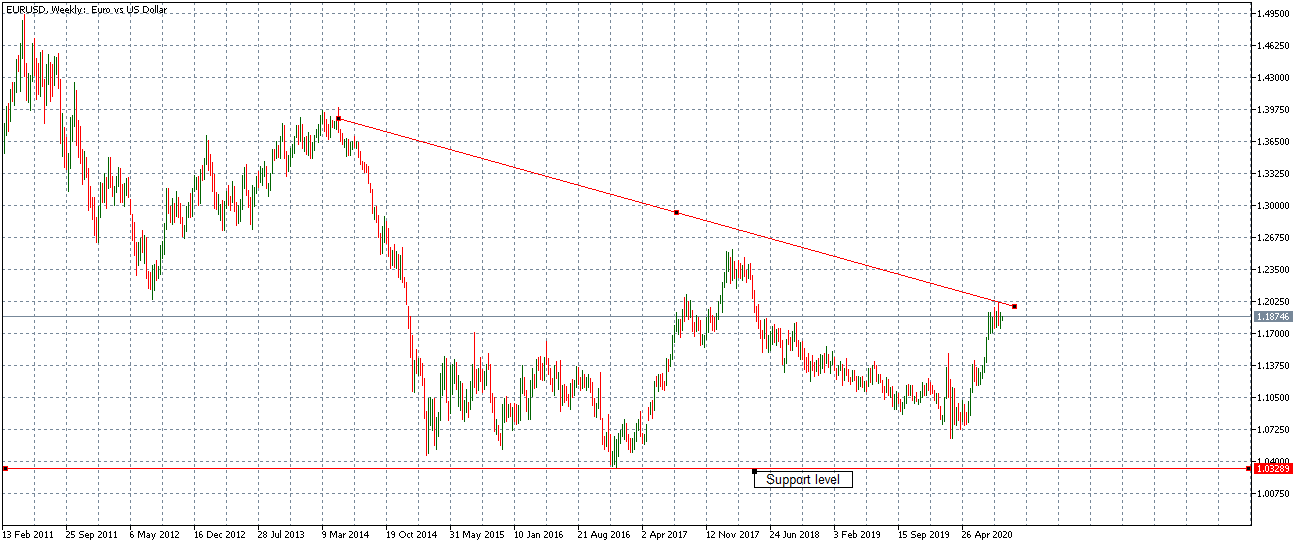
1-Week EUR/USD Trigger Timeframe

For a forex position trader, the 1-week timeframe can be used to establish the support level. This level will make the best entry point when the price trends below it.

Best Timeframe for Forex Swing Trading

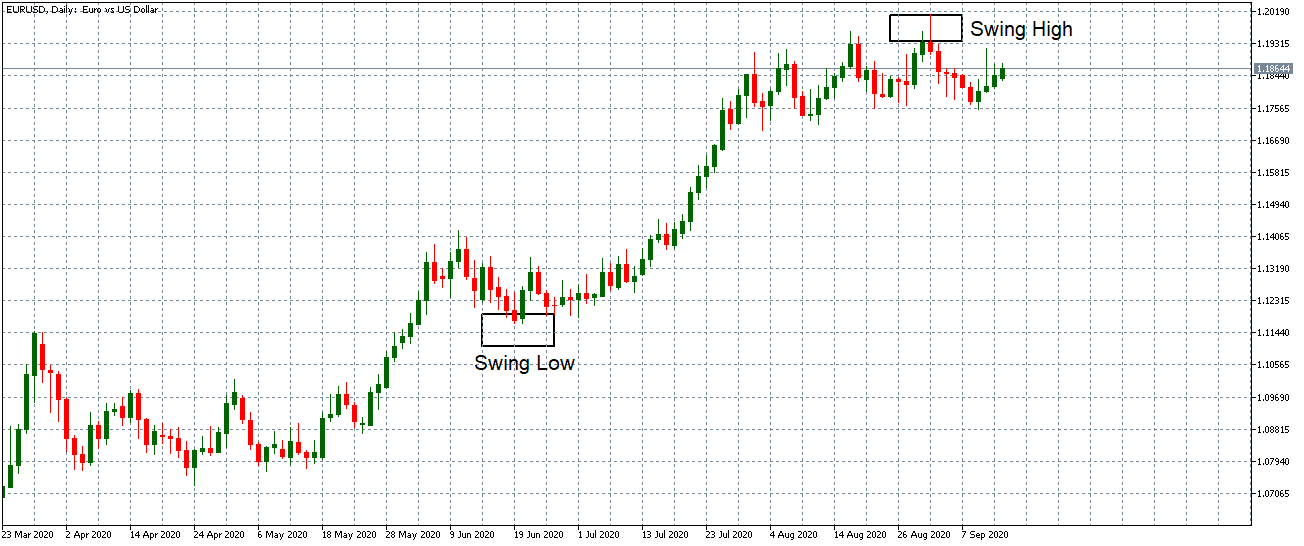
Daily EUR/USD Primary Trend Timeframe

Forex swing traders trade in the direction of the preceding trend, which in this example, is a downtrend.

4-hour EUR/USD Trigger Timeframe

For a forex swing trader, using the 4-hour timeframe is the best to identify the ideal entry and exit points.

Best Timeframe for Forex Day Trading

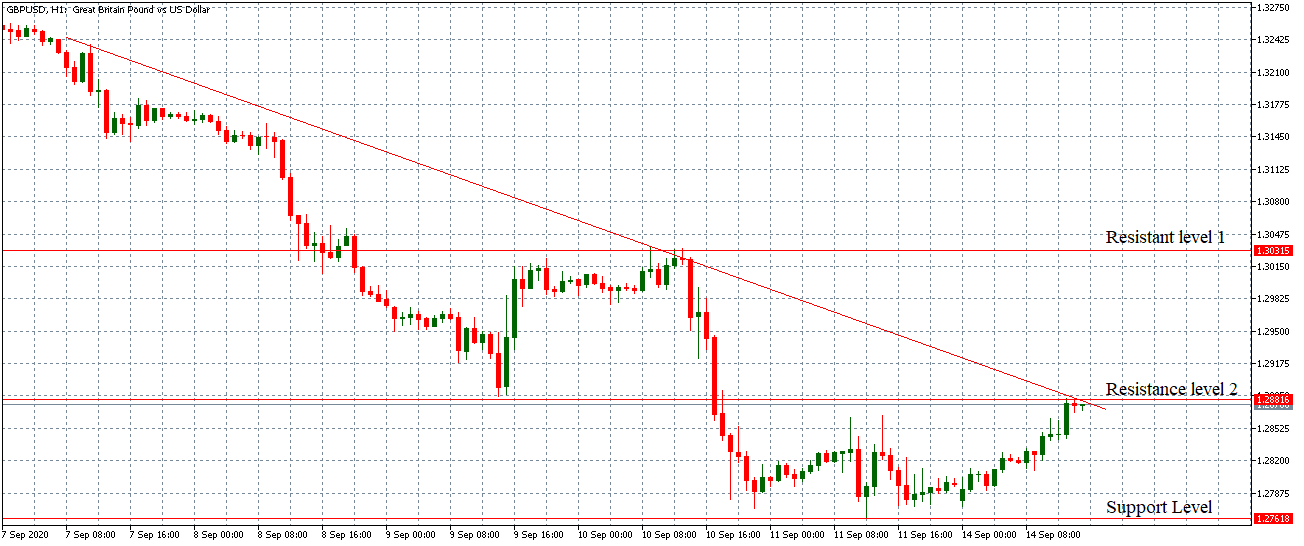
1-hour GBP/USD Primary Trend Timeframe

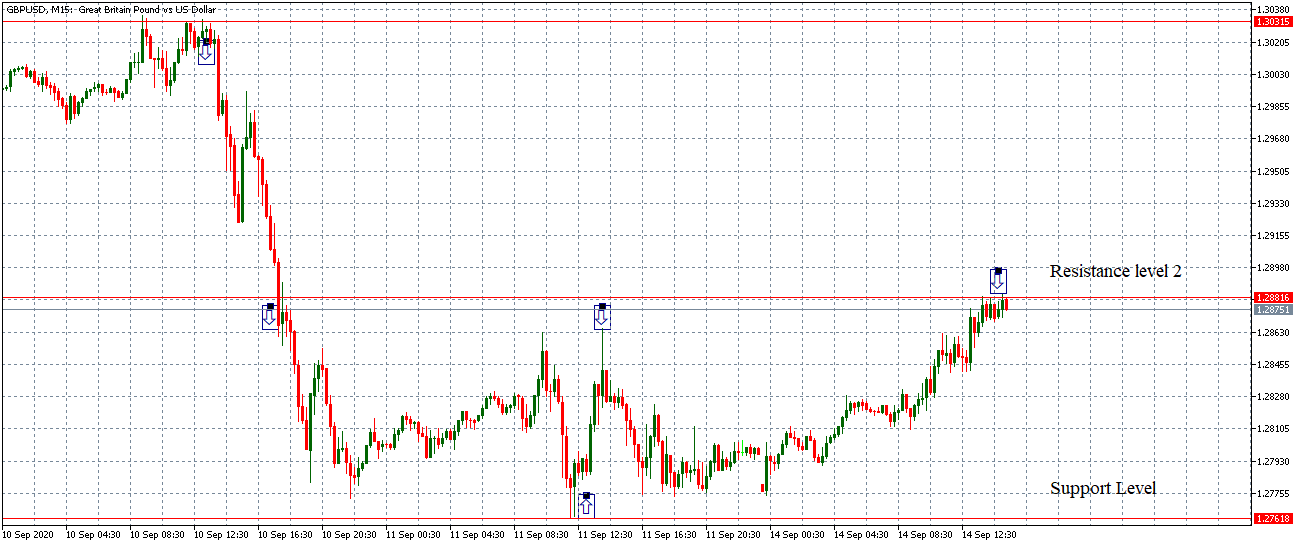
For a forex day trader, the dominant market trend is a downtrend. With this chart, the day trader can establish multiple support and resistance levels. The 15-minute timeframe is used to establish the best market entry positions.

15-minute GBP/USD Trigger Timeframe

With the 15-minute timeframe, multiple entries and exit points can be established.

Best Timeframe for Forex Scalping

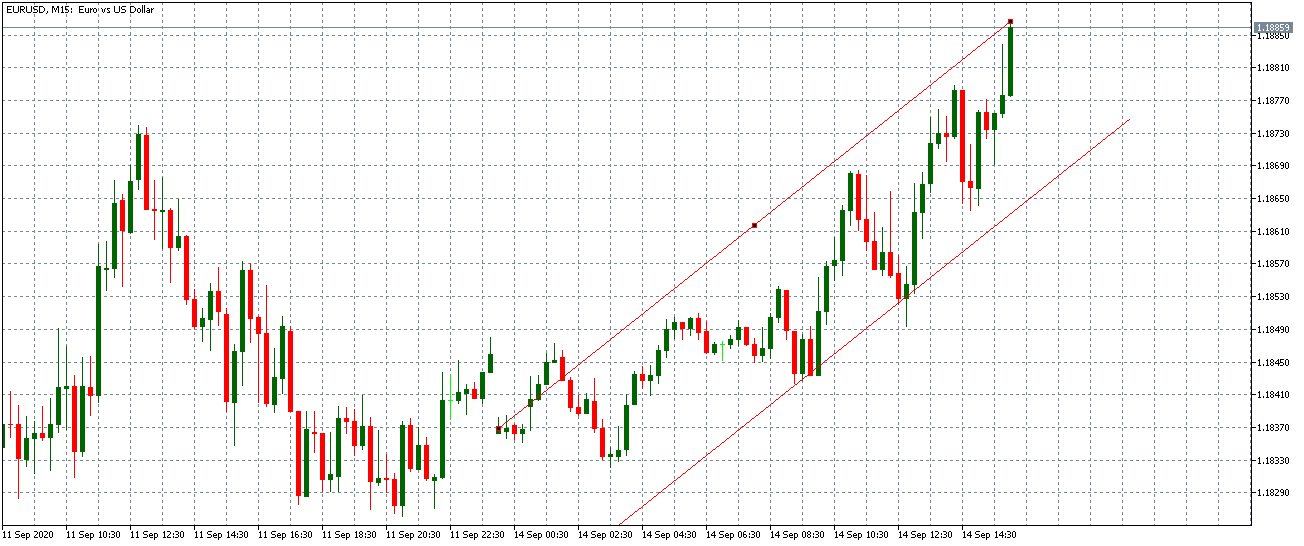
15-minute EUR/USD Primary Trend Timeframe

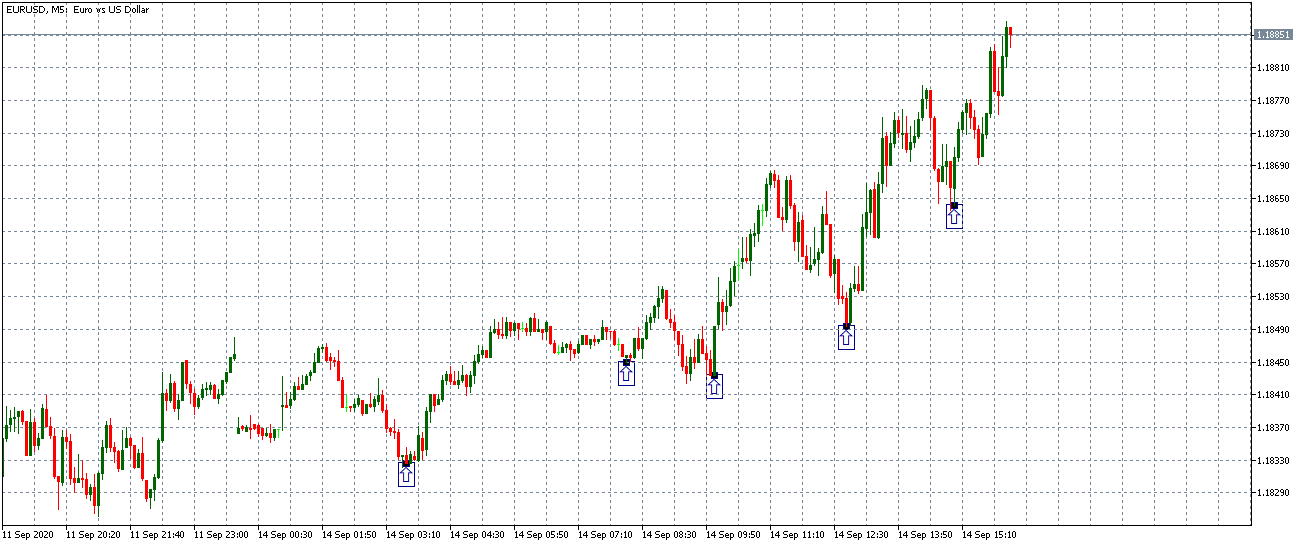
For a forex scalper, the 15-minute timeframe shows an uptrend. The 5-minute timeframe will be used to establish the best points of entry into the market.

5-minute Trigger Timeframe

The 5-minute timeframe presents the forex scalper with the best points for entry into the uptrend market.

Best Timeframe for Fundamental Forex Traders

Fundamental forex traders can also use timeframe analysis to establish the magnitude and volatility resulting from the release of an economic indicator. Therefore, depending on whether the indicator is high- or low-impact, you can determine which timeframe is best to trade.

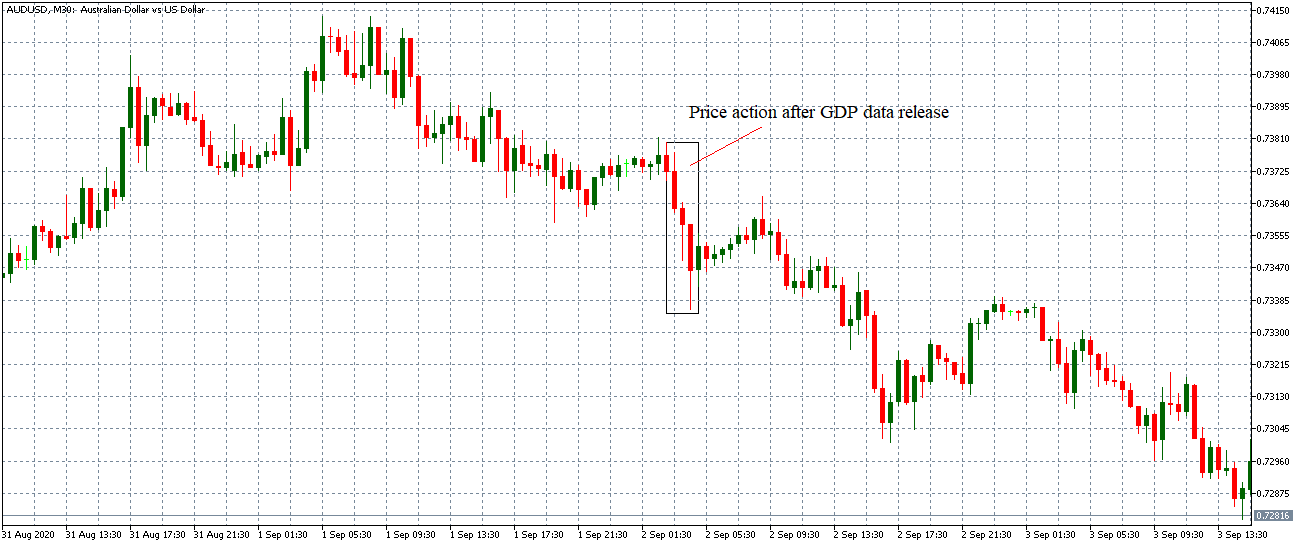
With high-impact indicators, you can trade from the 30-minute timeframe.

30-minute timeframe for Australia’s GDP data release. September 2, 2020, 1.30 AM GMT

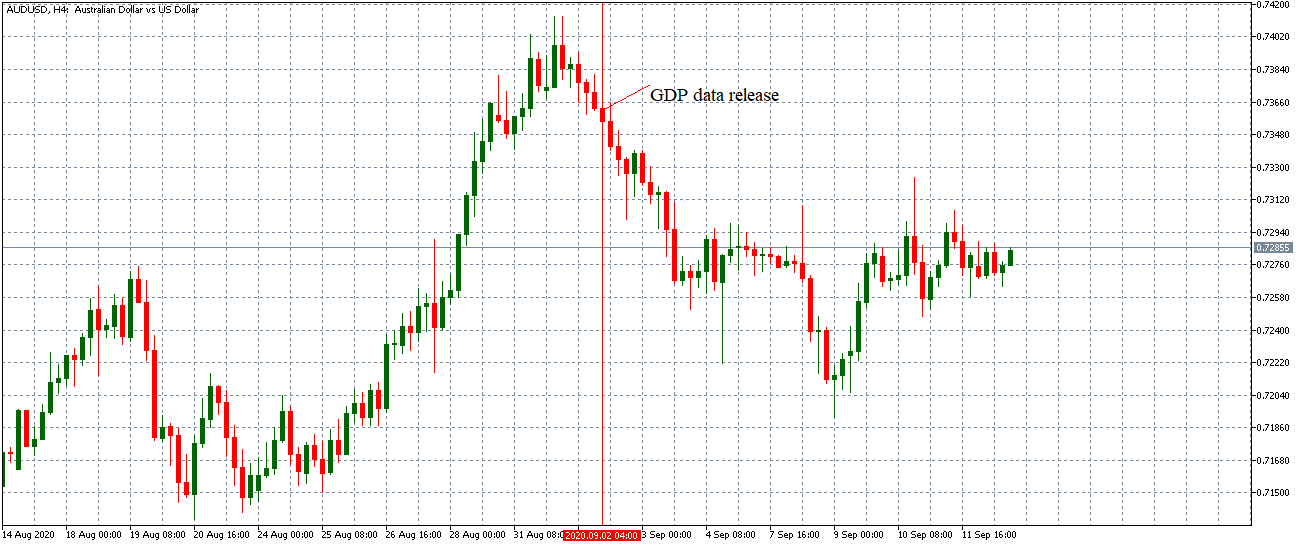
Furthermore, the price action from the release of a high-impact economic indicator can persist in the market for the long-term.

30-minute timeframe for Australia’s GDP data release. September 2, 2020, 1.30 AM GMT

The 4-hour chart shows that the AUD/USD pair continued trending downwards due to the less than expected GDP growth data.

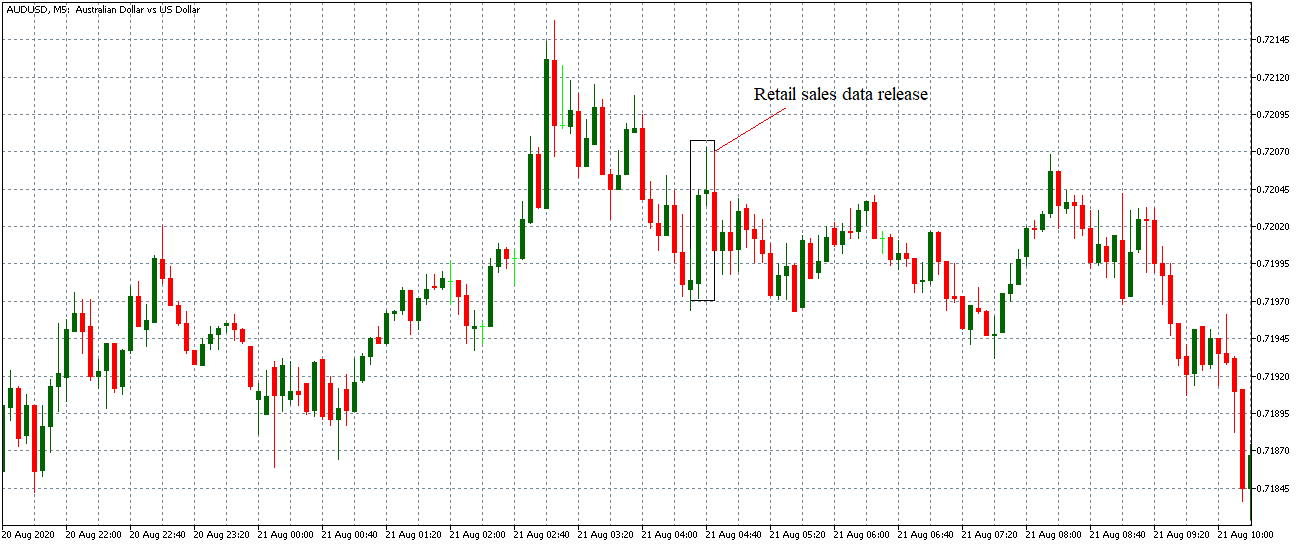
For low- to medium-impact economic indicators, it is best to trade shorter timeframes from 1-minute to 15-minutes.

5-minute timeframe for Australia’s retail sales data release. August 21, 2020, 1.30 AM GMT

At longer timeframes, the effects of these indicators on the price action dissipates.

1-hour timeframe for Australia’s retail sales data release. August 21, 2020, 1.30 AM GMT

[wp_quiz id=”89173″]
Categories
Forex Videos

Forex Price Action Noise! How To Analyse Timeframes!

aThe Problem With Price Action Noise

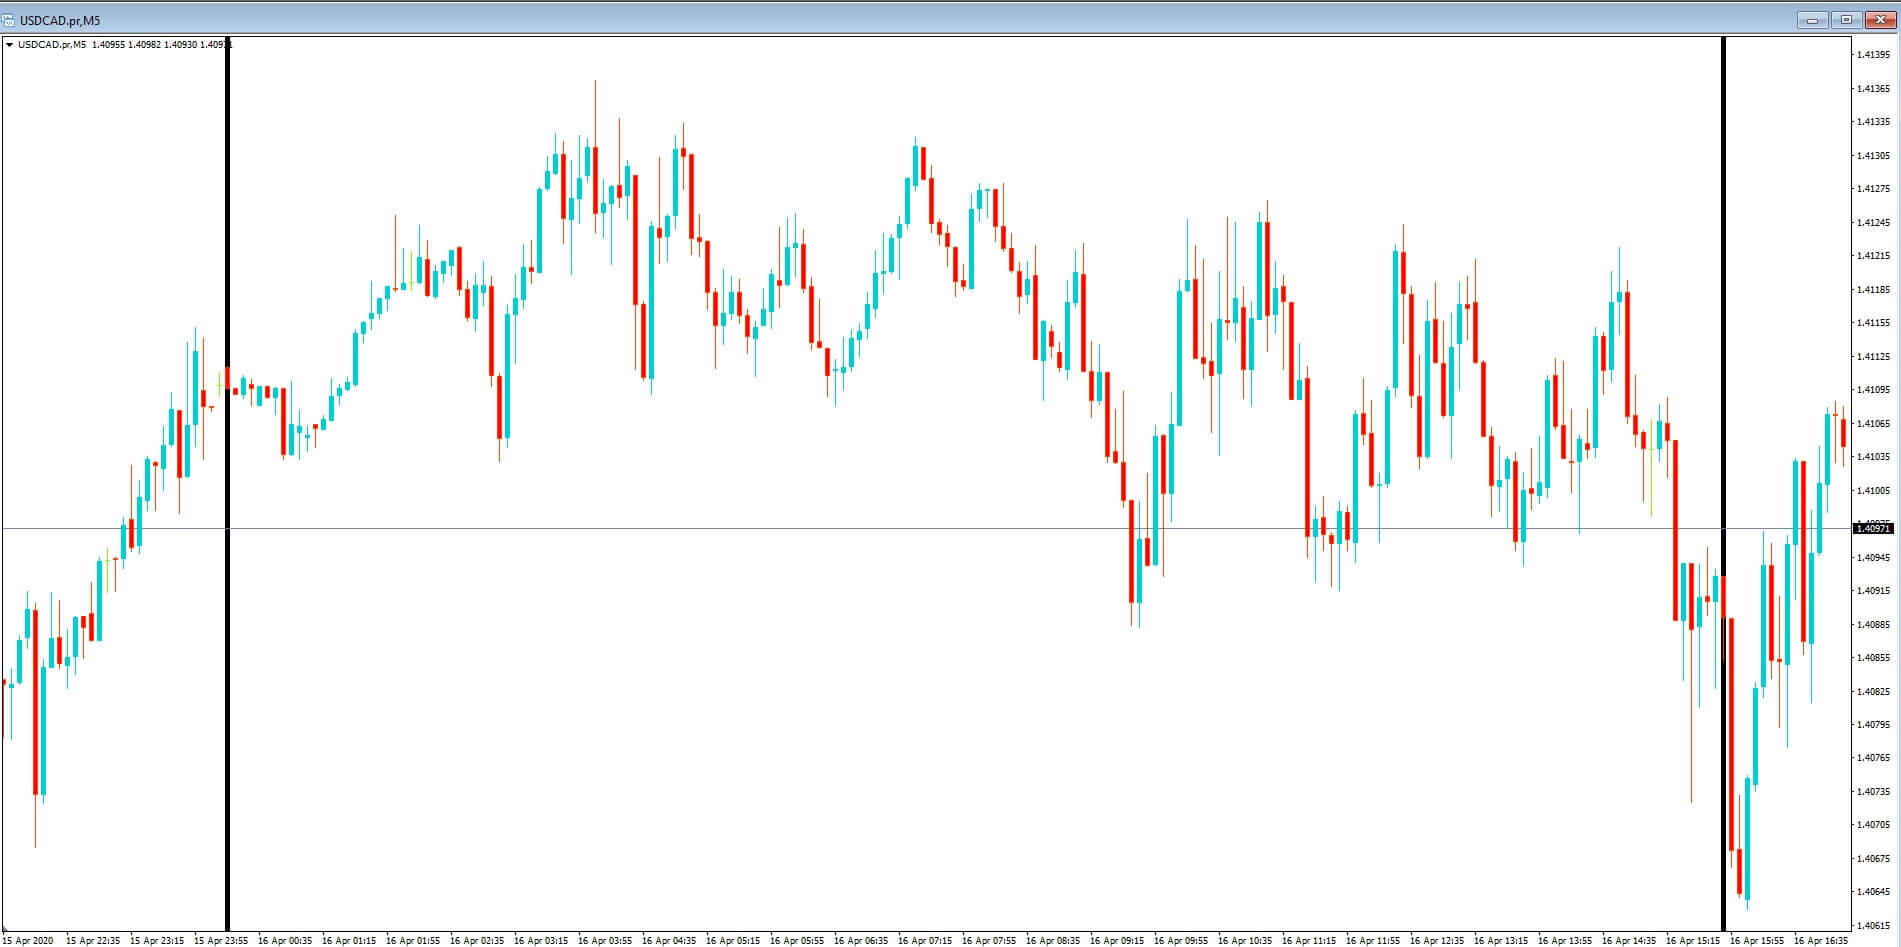
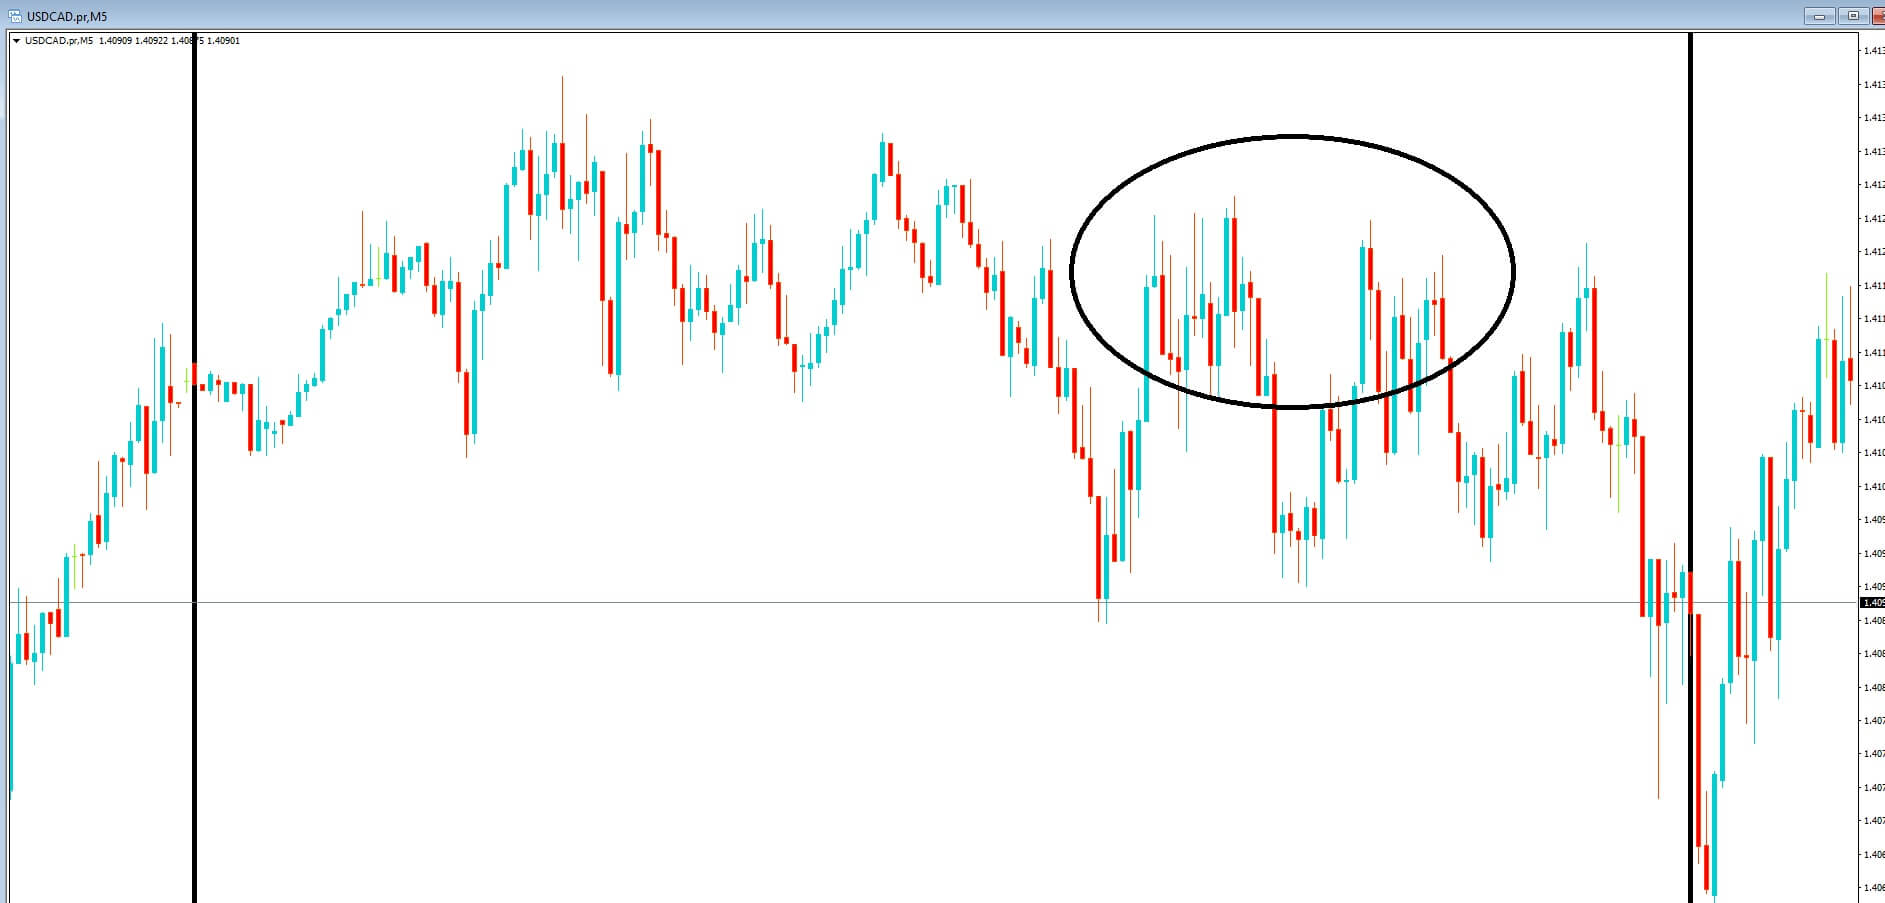
In forex trading, a term that is used quite often in technical analysis is market or price action ‘noise.’ Quite often, we find that price action in Any Given currency pair spends an awful lot of time sideways or consolidation motion. Or where price action seems to be rising and falling in small increments, but where these moves tend to form the basis of a trend. However, the lower you go on a time frame and especially with regard to the 1-minute and 5-minutes time frame, the more difficult it becomes in ascertaining exactly where the trend is going, whether it be a part of a bullish move or a bearish move or if it is a part of a consolidation phase.


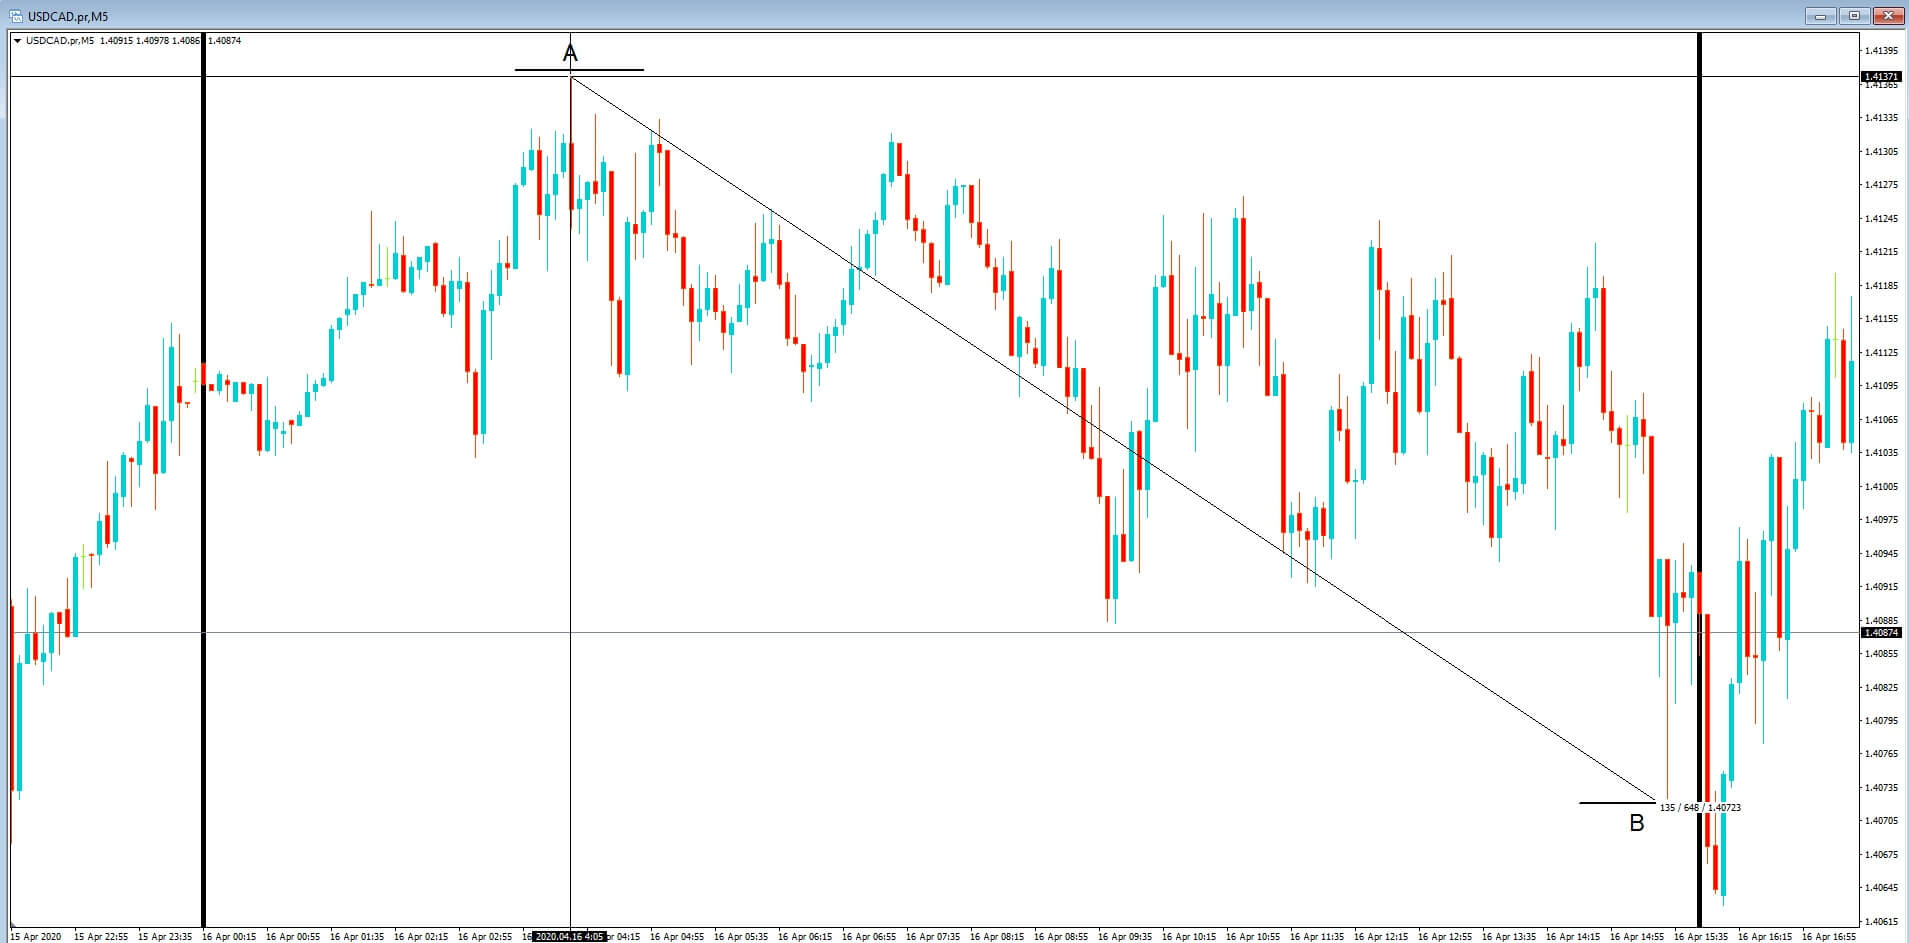
Insert A: This is a section of price action on a 5-minute chart of the USDCAD pair. We have added two vertical bars because this is the period that we want to drill down on a little bit more.


Insert B: This is the same section, but we have added 2 points on the charts at position a and b, and where the interest rate differential is 64 pips. That is to say, had you gone short at position a the maximum you would have made had you got out at position B would have been 64 pips less your spread. And of course had you bought the pair at position A and still being in the trade at position B you would have been offside by 64, pips plus your spread.


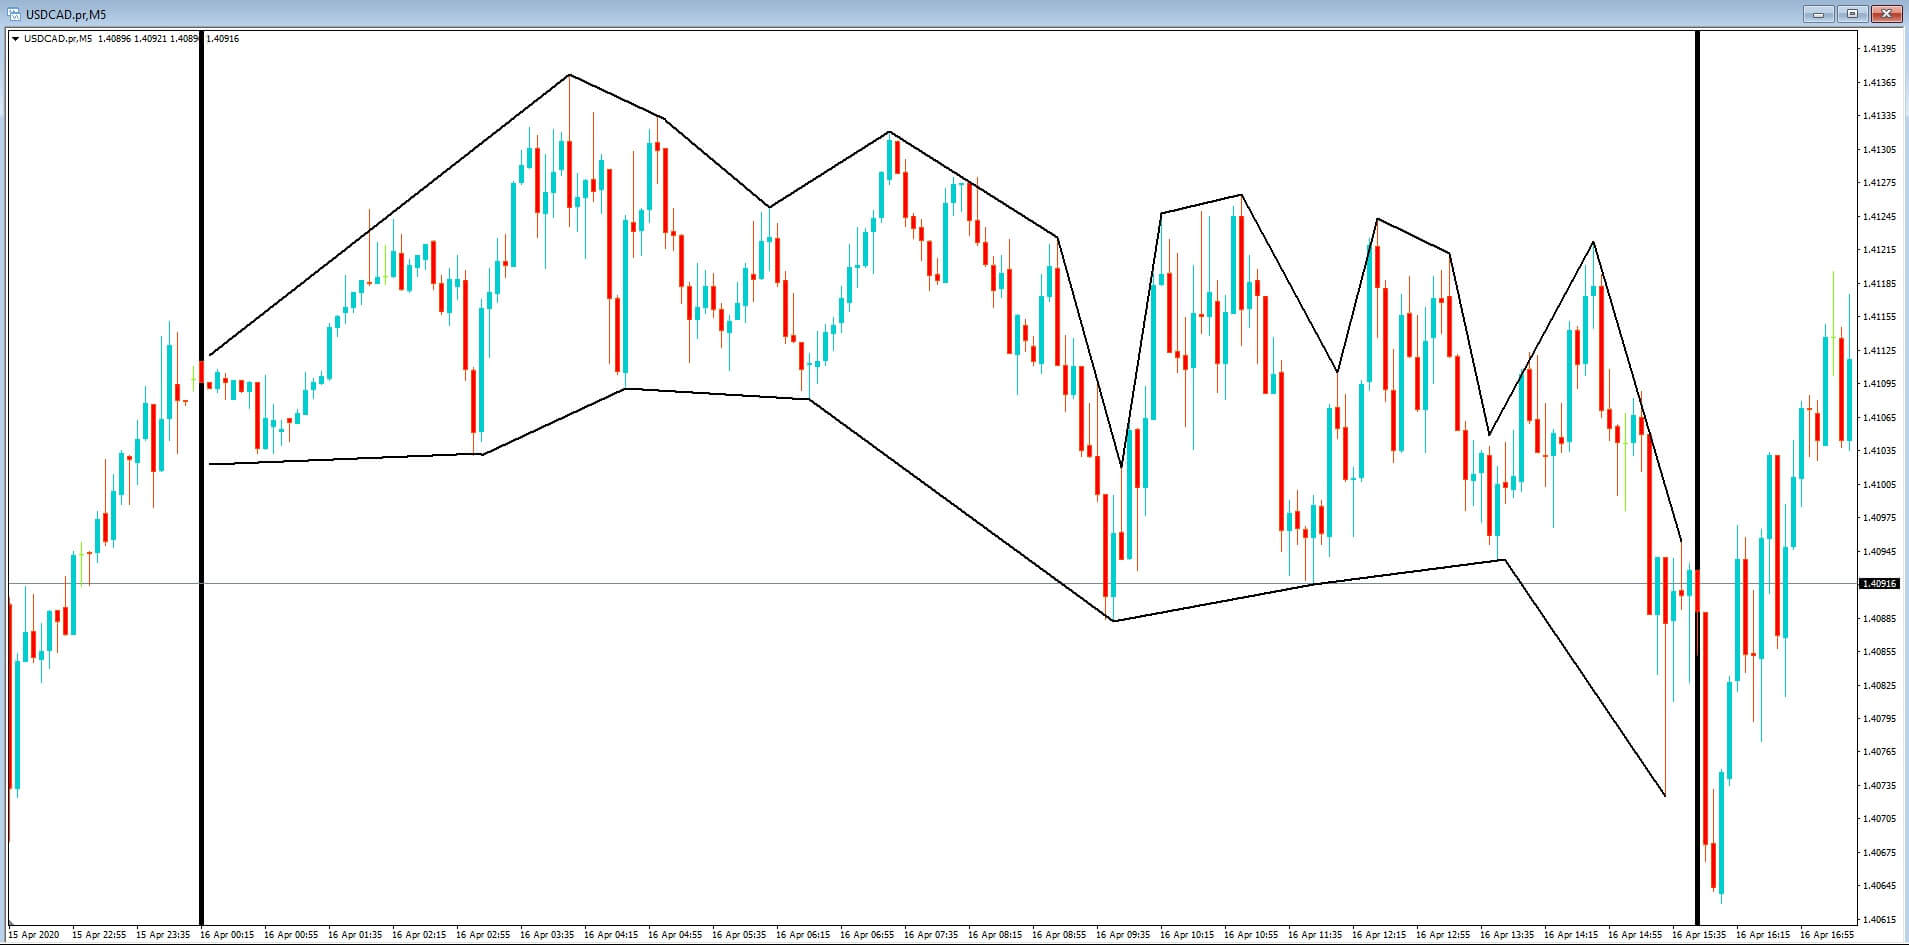
Insert C: In this section, we have added our own channel, where we can see a lot of rise and fall and tight consolidation in periods where the price is contracting within the range, but this in itself would become difficult to trade, especially if looking for trends.


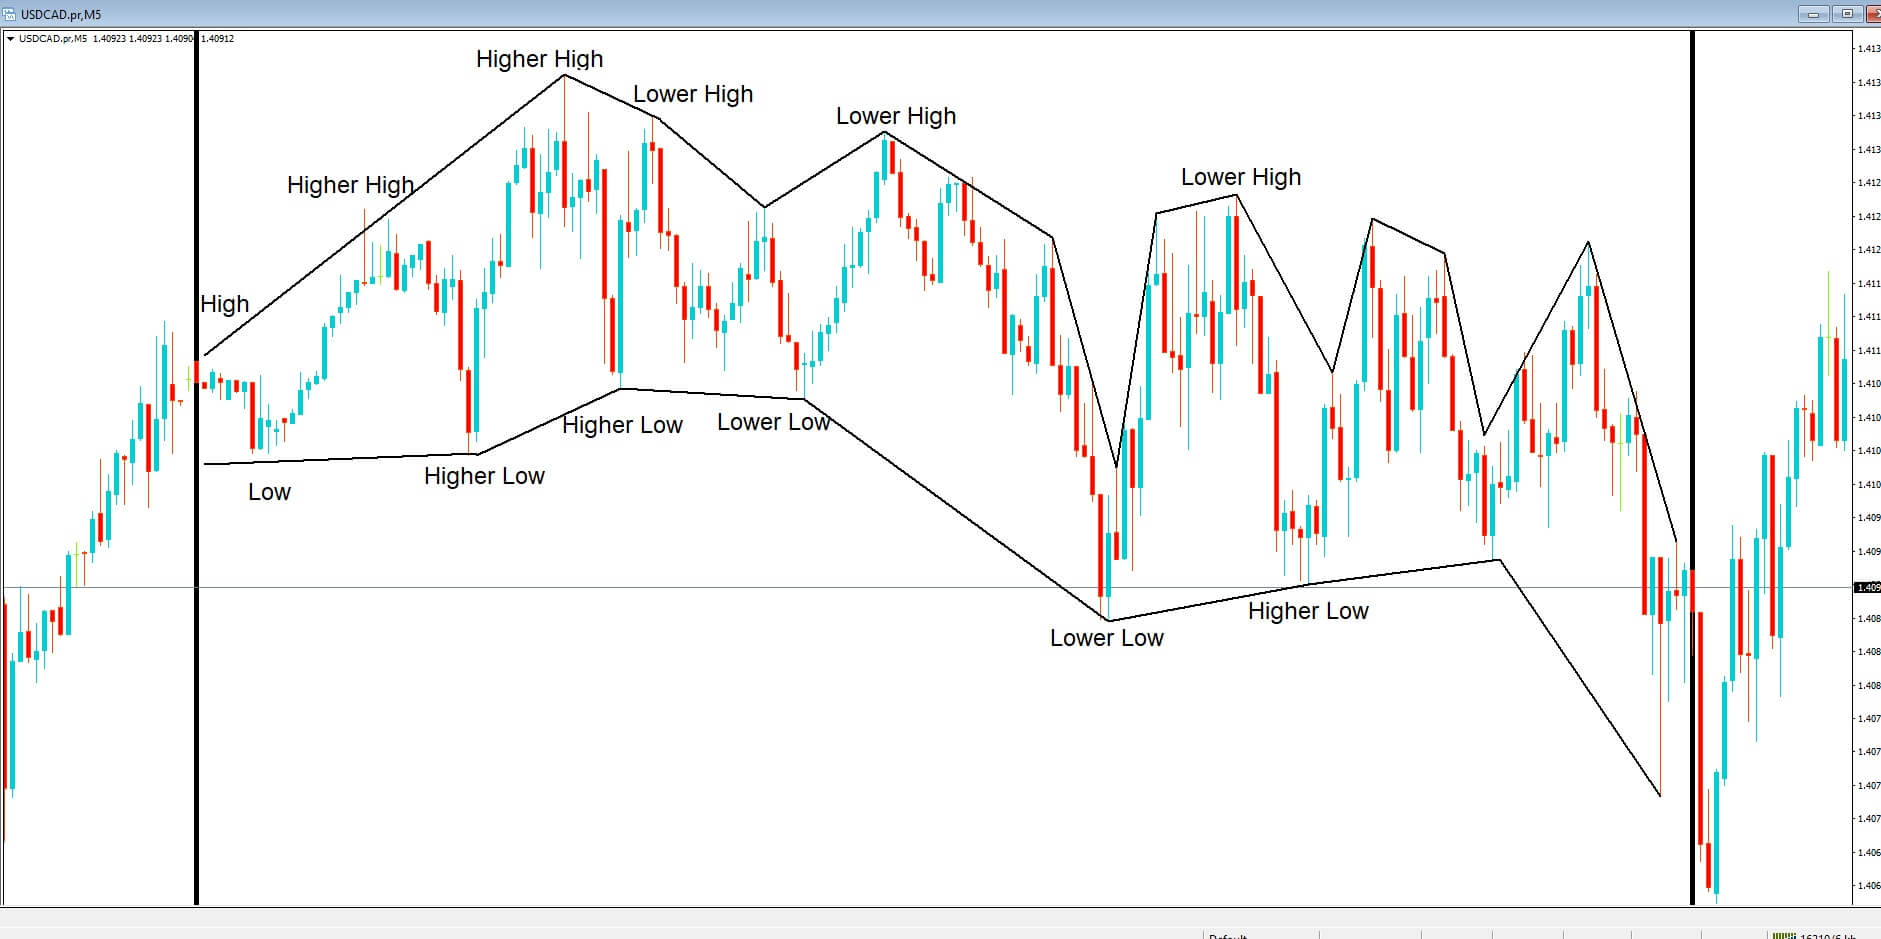
Insert D, Now scalpers, while incorporating technical tools such as statistics, might argue that a few pips could be made here and there possibly based on highs with higher highs and lower lows, etc.

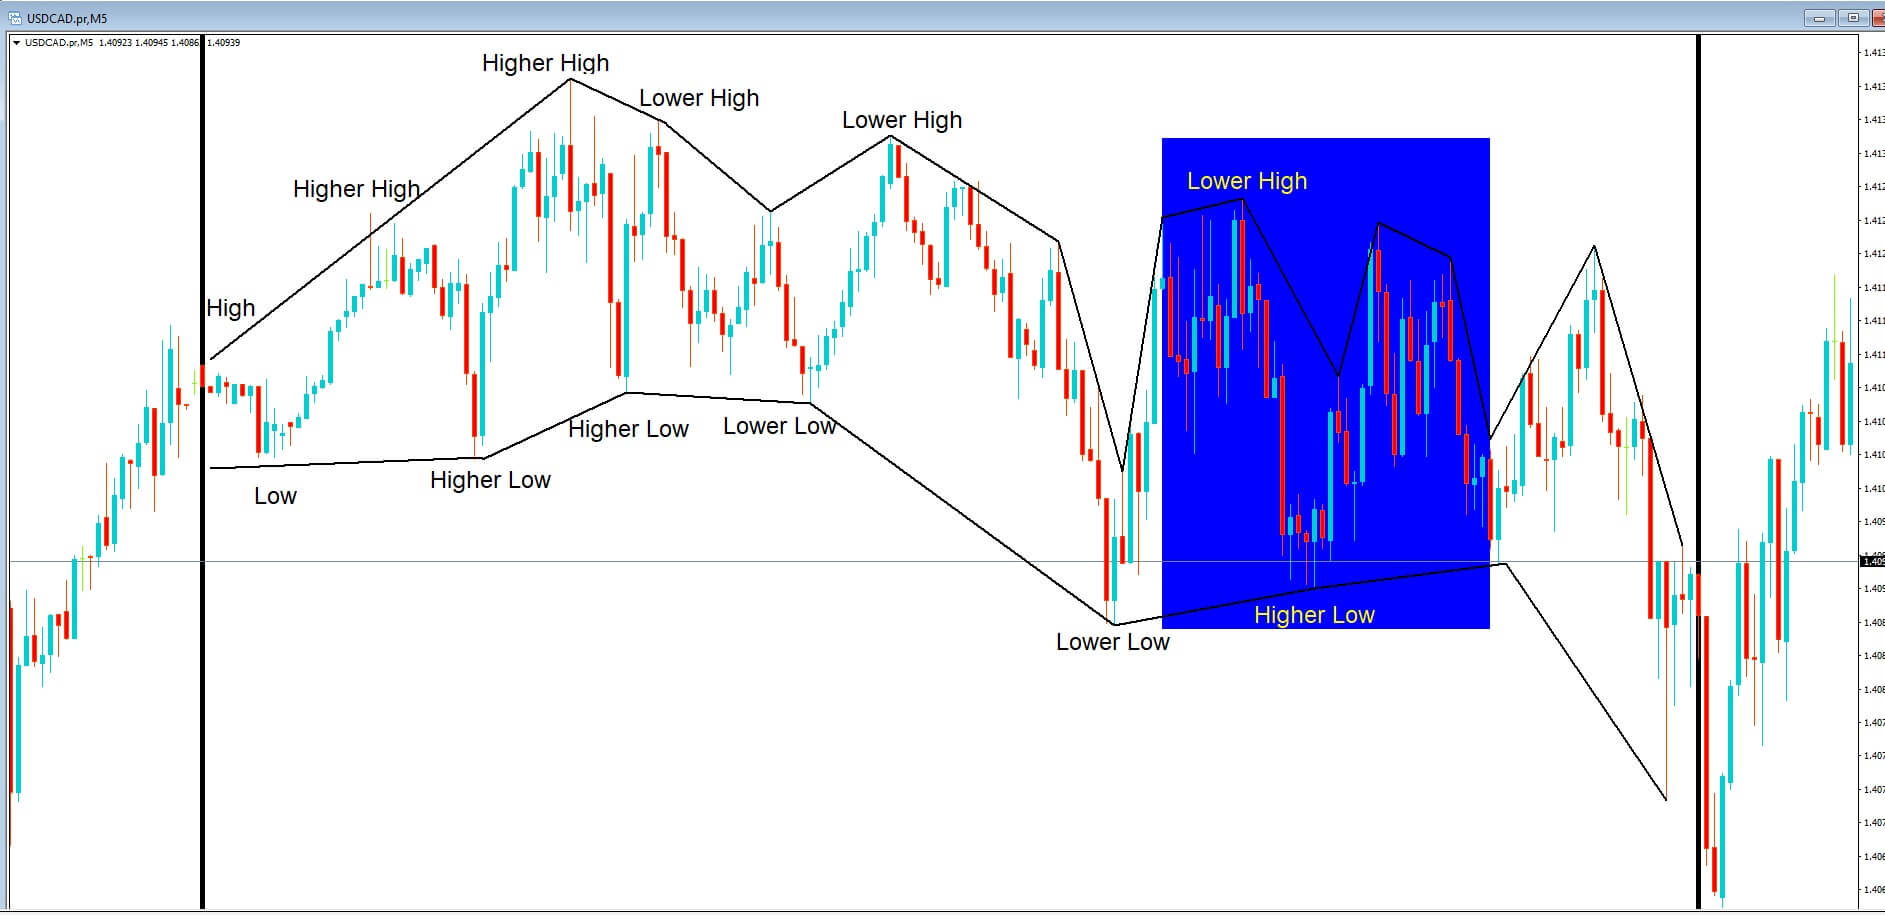
Insert E, But this type of technical analysis can quickly fall out of kilter in areas such as where we have highlighted we suddenly have a lower or high which is followed by buy a higher low, where we would need a lower low in order for the pair to remain in a bearish price pattern.


Insert F. This is also complicated in the area where we have highlighted where we see candles grouped together, which are both bullish and bearish and where several are more wick than candle telling traders that neither bulls nor the bears have this pair under control at this time. This is market noise. And while such noise can be seen in all time frames, the trick is to move up to a higher one to find out where directional bias might be heading.


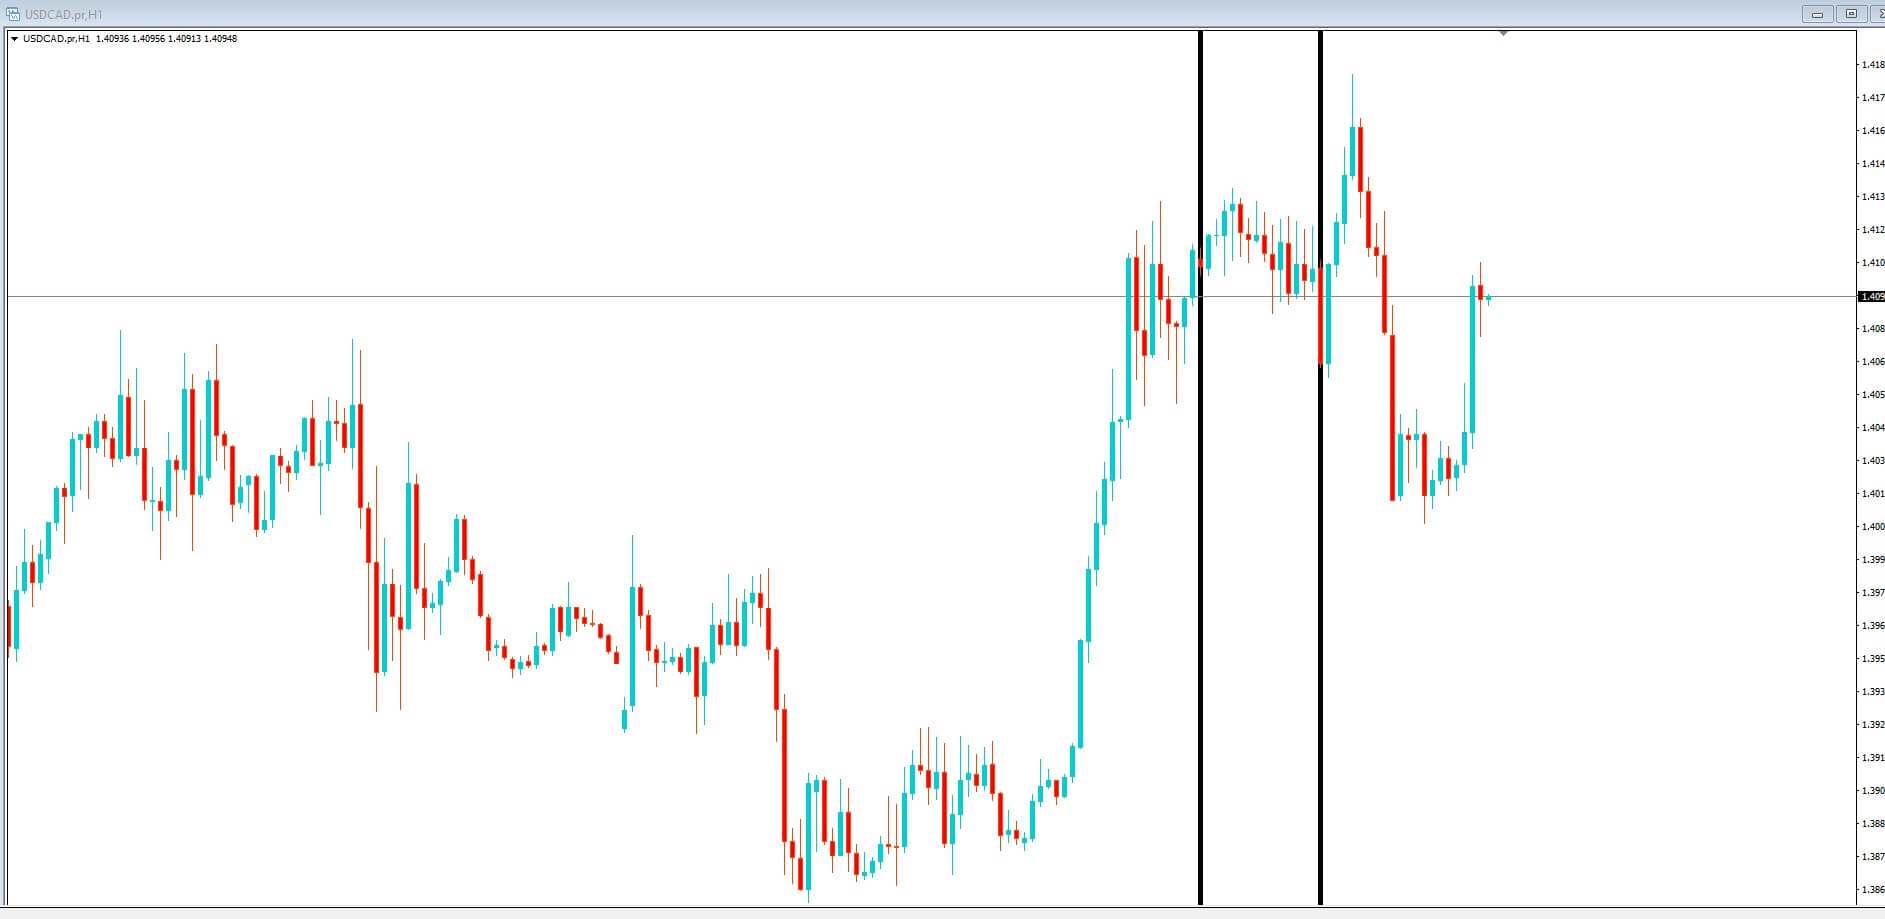
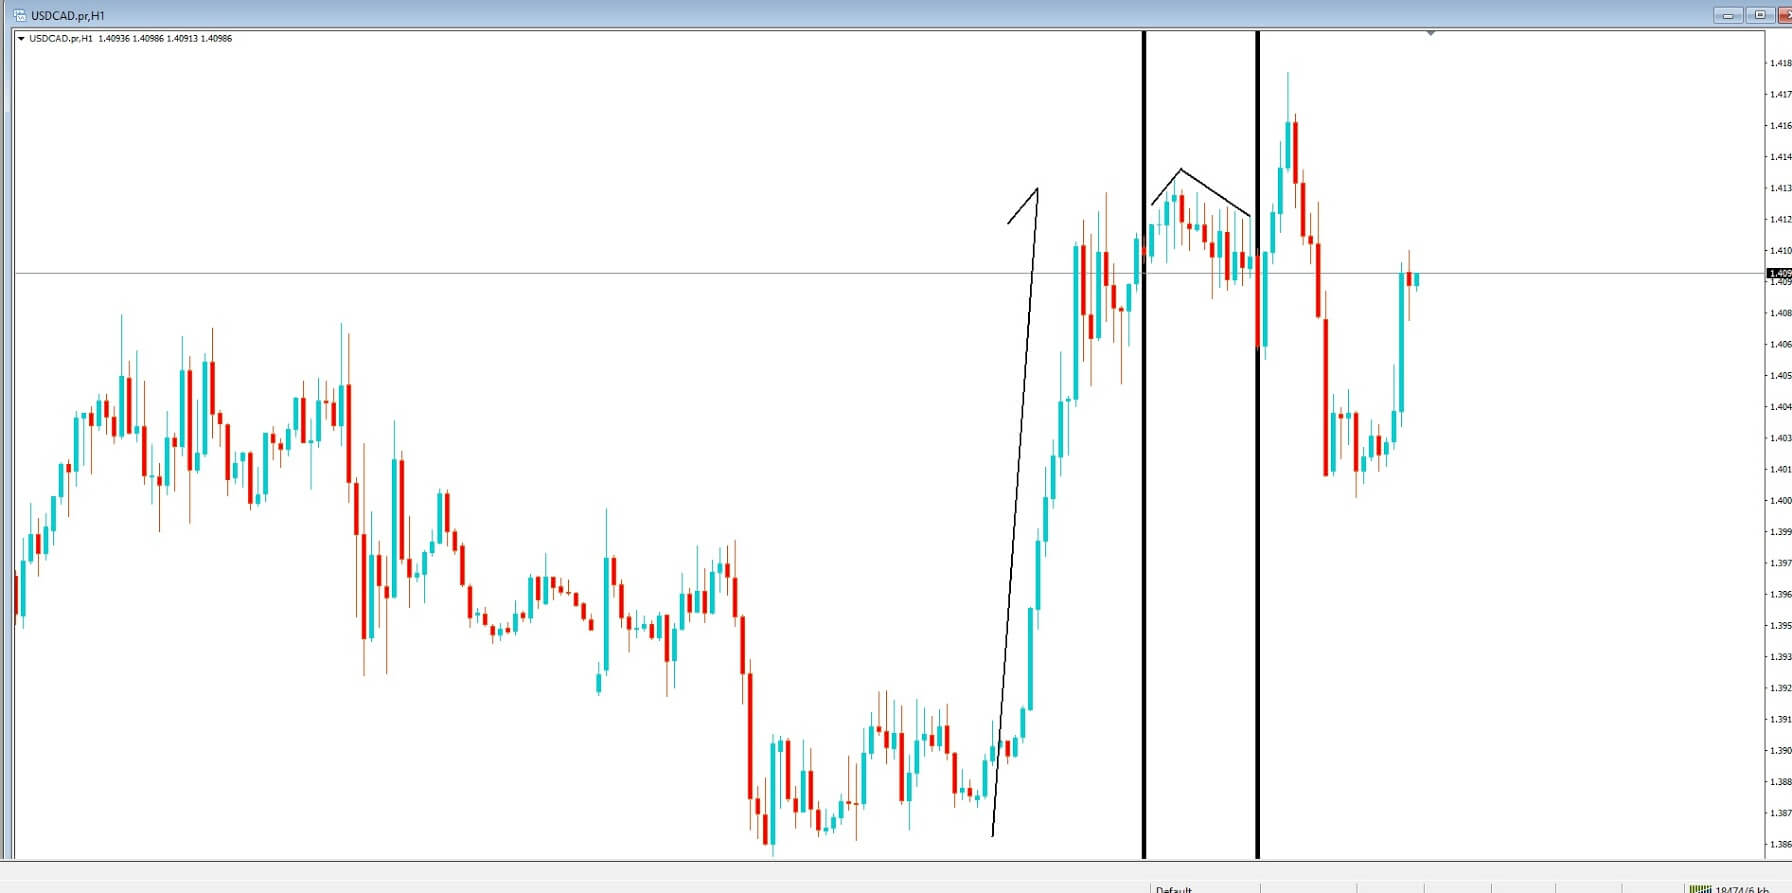
Insert G. However if we moved to a higher time frame, such as the 1-hour time frame here and again, look at the price action within the two horizontal lines we get some more clarity about what is really happening to this pair over the time period which we have highlighted.


Insert H, And here we can see that the price action is consolidating after a rally to the upside and where we have a V-shaped potential reversal pattern within our highlighted area.
There is an old saying which I’m sure you’ve heard of that sometimes you can’t see the wood for the trees. Well, this is a perfectly good example, where in order to avoid the noise of the lower time frames, we must always look to the higher time frames to try and ascertain what the general bias is, even if you prefer to trade the lower ones.

Categories
Forex Videos

Forex Timeframes & Trading Windows – Which To Choose!

Time frames And Trading Windows Tricks – Maximize Opportunities With Overlap

In this video presentation, we are going to be looking at time frames and trading windows. Although these two subjects are separate by looking at them together, we hope you will see the importance of combining them in one section.

When it comes to time frames, new traders are often confused about which time frames to trade and why. So let’s look at three different types of time frames and traders who prefer to use them.

You will most likely be trading on a short-term, medium-term, or long term time frame, depending on your preferences, including your strategy, lifestyle, and the size of your trading account. Everybody is different, and some traders may use a one-time frame or a combination of all three.

But this can cause a lot of confusion for new traders when they begin to develop their trading strategy. Many new Traders tend to want to be in and out of a trade very quickly, which means they fall into the group known as scalpers and tend to use 1-minute and 5-minute time frames.

Other traders tend to want to look for longer-term trends, but do not want their trades to roll over from one day to the next, in which case they might prefer to use 15-minute to 1-hour time frames, and these are known as intraday traders, and larger professionals, including institutional traders, will have a longer-term view and look at 4 hour time frames up to daily, weekly and even monthly time frames. These are commonly referred to as swing traders.
Scalpers team to only use 1-minute and 5-minute they might only be in a trade for 1 to 2 minutes. Whereas day traders might be in a trade all day long, and institutional long-term or swing traders might be in a trade for days, weeks, months, or even years.

One of the reasons why trading can be inherently difficult is because all of these traders have different ideas about where the price of a pair is heading based on the various time frames that are used by the various groups of time frames, and therefore the majority of them will all be trading at odds with each other, not only within their own time frame but the other time frames as well.

No matter what time frame you choose to use, it is always advisable to look at the longer-term time frames before you place a trade and then filter down to the time frame that you want to use because a great deal of price action sentiment can be gained from doing so. This is the only way that you will be able to see if trends are developing and trade accordingly. You may have heard of the phrase let the trains be your friend, well this is the best way to find a trend, by looking at a higher time frame than the one you want to use and then filter down once you have established what is happening to price action overall.


Example A. Traders can look to the higher time frame, such as the daily or weekly charts.

Example B. In order to establish what is happening with price action and to find out if trends are available or forming and then simply move down to their preferred time frame. By doing this, they will also be able to more clearly see prominent support and resistance areas which may be being observed by institutional traders, because, after all, this is where the real money is. Institutional traders are the ones that move the market. And so it is always advisable to know what they are doing at the higher time frames.

In summary, the type of time frame that you choose is dependent on the type of trader that you want to be, whether it is a quick in and out scalper style, or perhaps to take a longer longer-term view. But however, you trade it is always advisable to look at other time frames especially, especially longer-term ones than your preferred time frame, in order to help you pick your trade entry more easily.

Next, we are going to look at trading sessions. The forex market is broken up into major trading sessions.

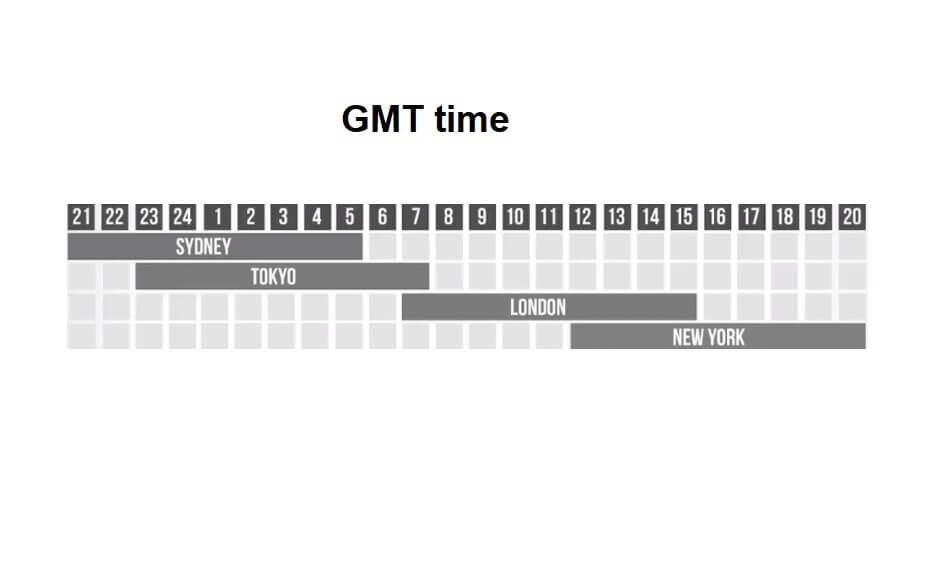
Example C.  The Sydney session, the Tokyo session, the London session, which includes Frankfurt and a New York session. The forex market is open between 10 p.m. Sunday evening GMT and runs all the way through until 10 p, GMT on Friday, non-stop. However, the main centers will typically open at around 7 a.m. their time and finish at around 5 p.m. In other words, business hours. And where we can see on the graph that some of the sessions overlap.
That more centers overlap means that there are more players in the forex market at that time, and this means extra volume and liquidity and, therefore, greater moves in price action or potentially happen during these overlaps.

In summary, the best times I’m two trees are when two sessions overlap, and most volume and liquidity is provided during the London session, which includes Frankfurt and is also known as the European session, and where this overlaps with New York. This is the time of most activity. Generally speaking, in the forex market. Please remember to adjust your trading to reflect the seasonal changes due to daylight saving hours. The middle of the week tends to be the busiest because this is where we find more economic data releases normally. These affect market volatility.

With the worst times to trade being Sundays and Fridays, especially after the US session, public holidays where markets are thin, and volume is low, which means spreads will be at their widest, and during major news events where the markets can be extremely volatile.