Introduction
In our previous lesson, we looked at which timeframes you should trade in the forex market. We established that the timeframes you trade depend on the type of forex trader that you are. This lesson will cover the best timeframes to trade using illustrations depending on the type of forex trader you are.
Best Timeframe for Forex Position Trading
1-Month EUR/USD Primary Trend Timeframe
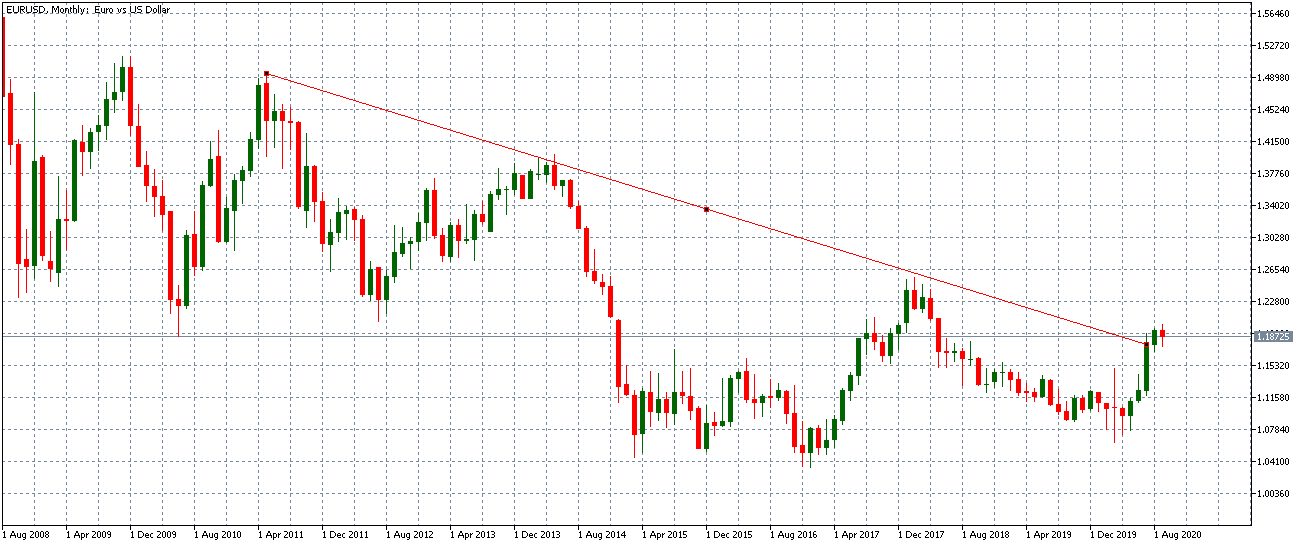
The monthly timeframe shows a downtrend in the pair.
1-Week EUR/USD Trigger Timeframe
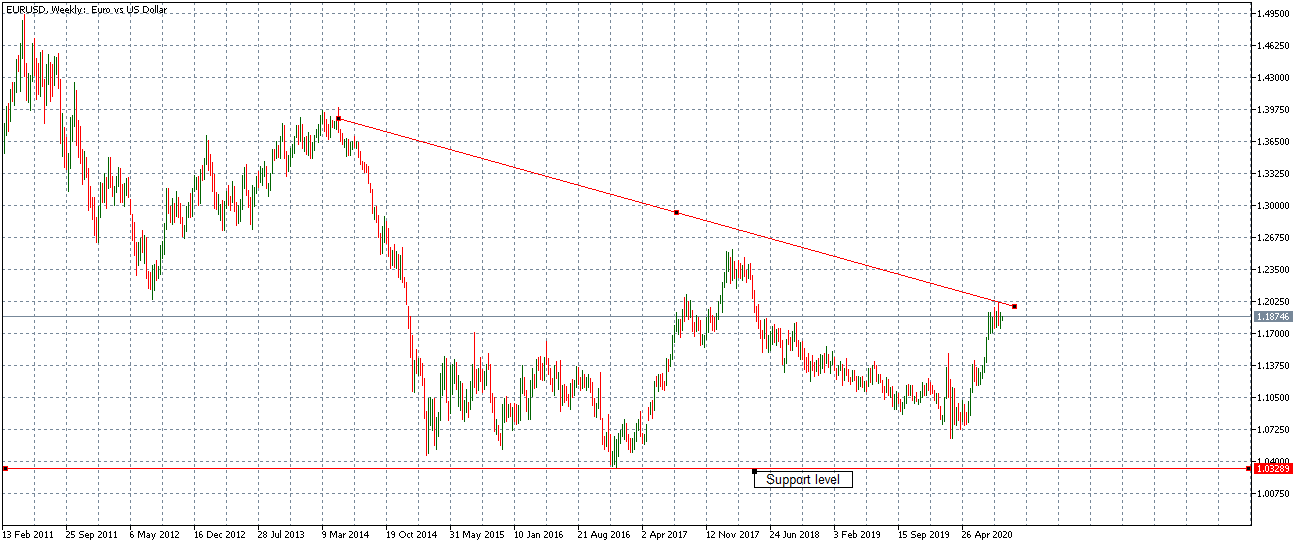
For a forex position trader, the 1-week timeframe can be used to establish the support level. This level will make the best entry point when the price trends below it.
Best Timeframe for Forex Swing Trading
Daily EUR/USD Primary Trend Timeframe
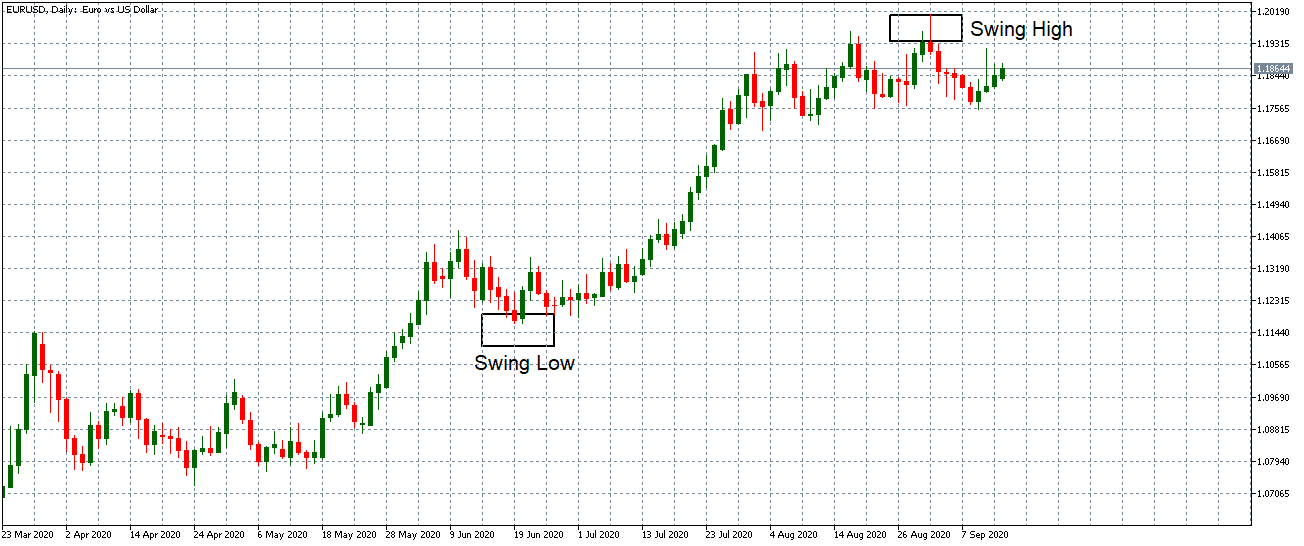
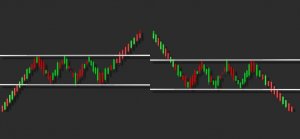
Forex swing traders trade in the direction of the preceding trend, which in this example, is a downtrend.
4-hour EUR/USD Trigger Timeframe

For a forex swing trader, using the 4-hour timeframe is the best to identify the ideal entry and exit points.
Best Timeframe for Forex Day Trading
1-hour GBP/USD Primary Trend Timeframe
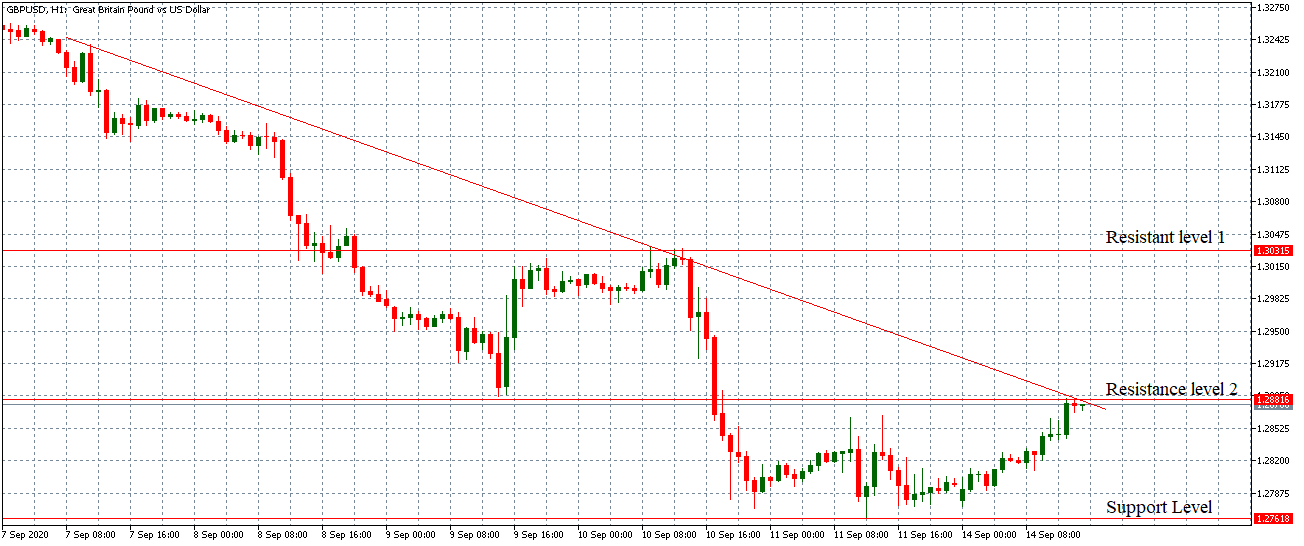
For a forex day trader, the dominant market trend is a downtrend. With this chart, the day trader can establish multiple support and resistance levels. The 15-minute timeframe is used to establish the best market entry positions.
15-minute GBP/USD Trigger Timeframe
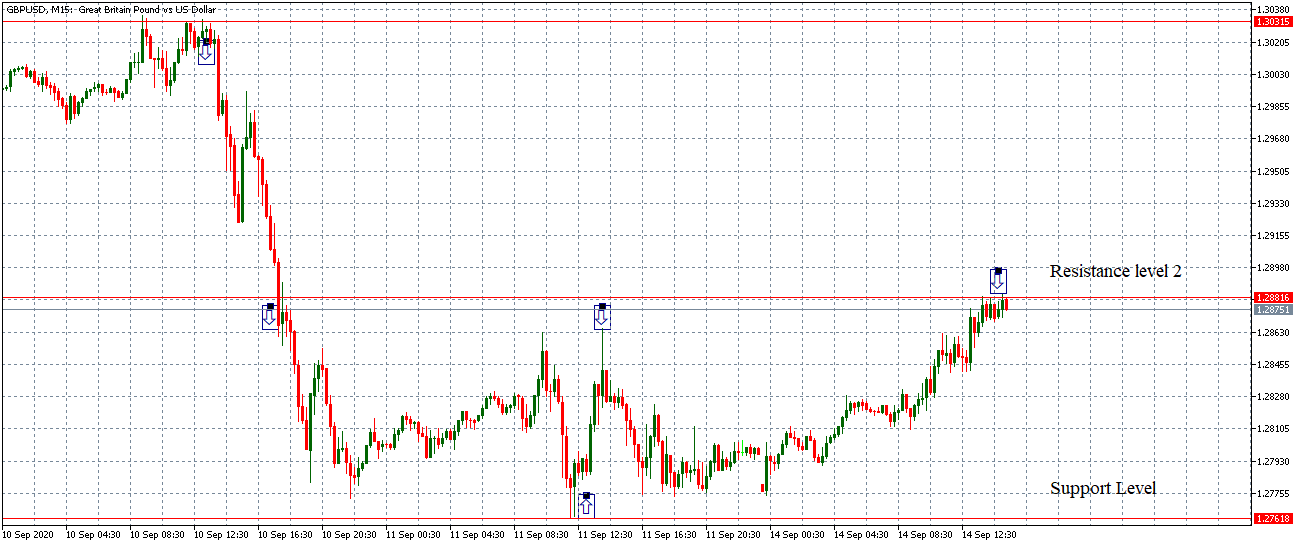
With the 15-minute timeframe, multiple entries and exit points can be established.
Best Timeframe for Forex Scalping
15-minute EUR/USD Primary Trend Timeframe
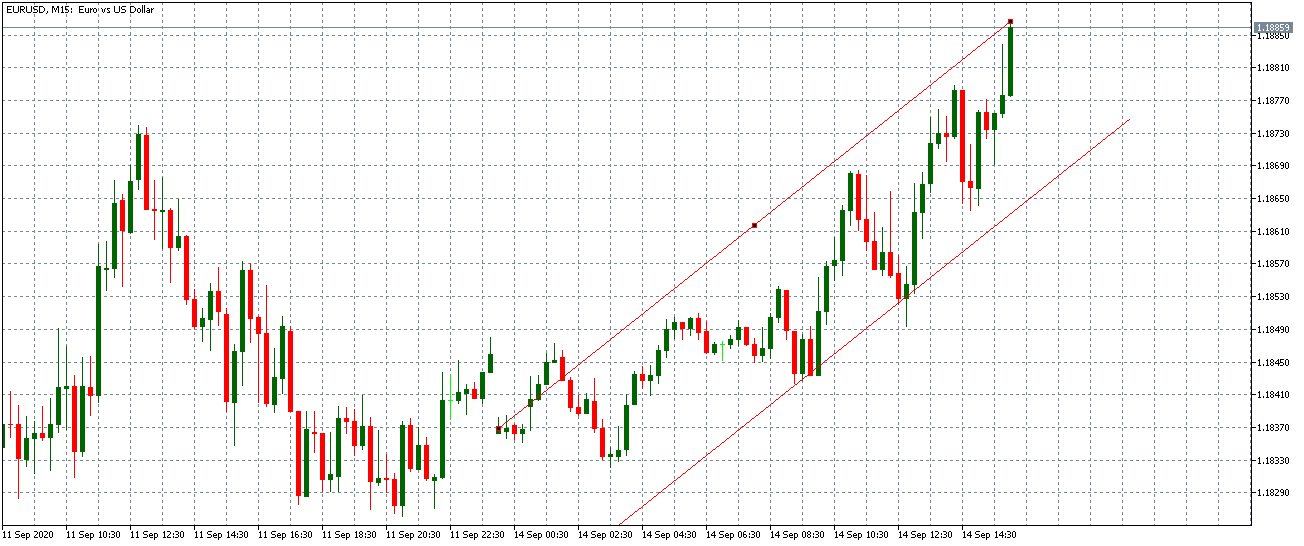
For a forex scalper, the 15-minute timeframe shows an uptrend. The 5-minute timeframe will be used to establish the best points of entry into the market.
5-minute Trigger Timeframe
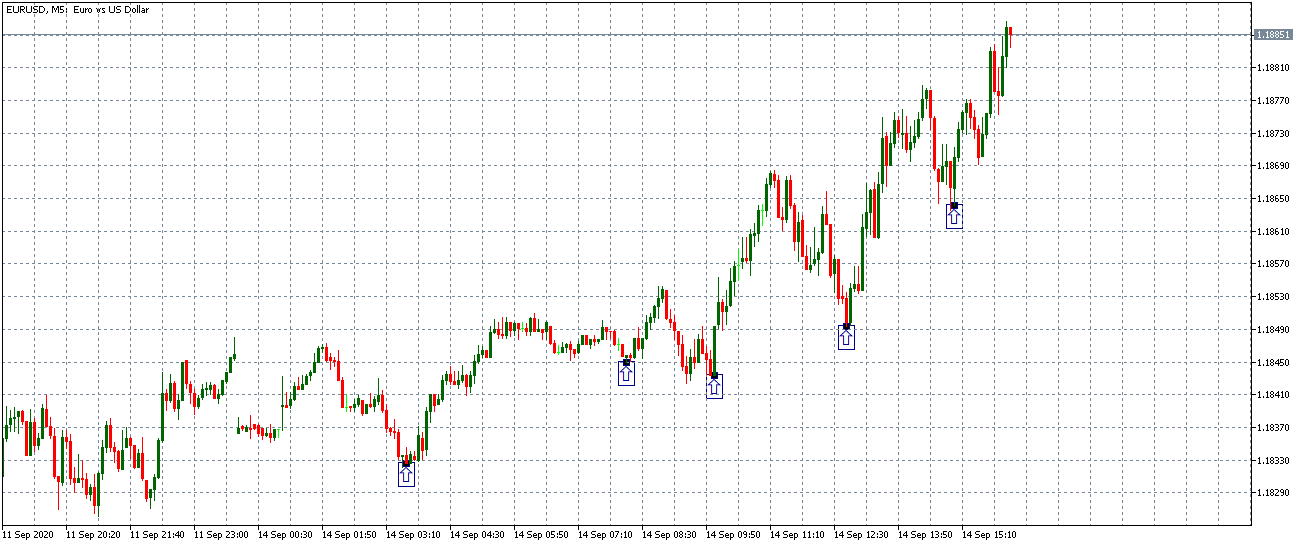
The 5-minute timeframe presents the forex scalper with the best points for entry into the uptrend market.
Best Timeframe for Fundamental Forex Traders
Fundamental forex traders can also use timeframe analysis to establish the magnitude and volatility resulting from the release of an economic indicator. Therefore, depending on whether the indicator is high- or low-impact, you can determine which timeframe is best to trade.
With high-impact indicators, you can trade from the 30-minute timeframe.
30-minute timeframe for Australia’s GDP data release. September 2, 2020, 1.30 AM GMT
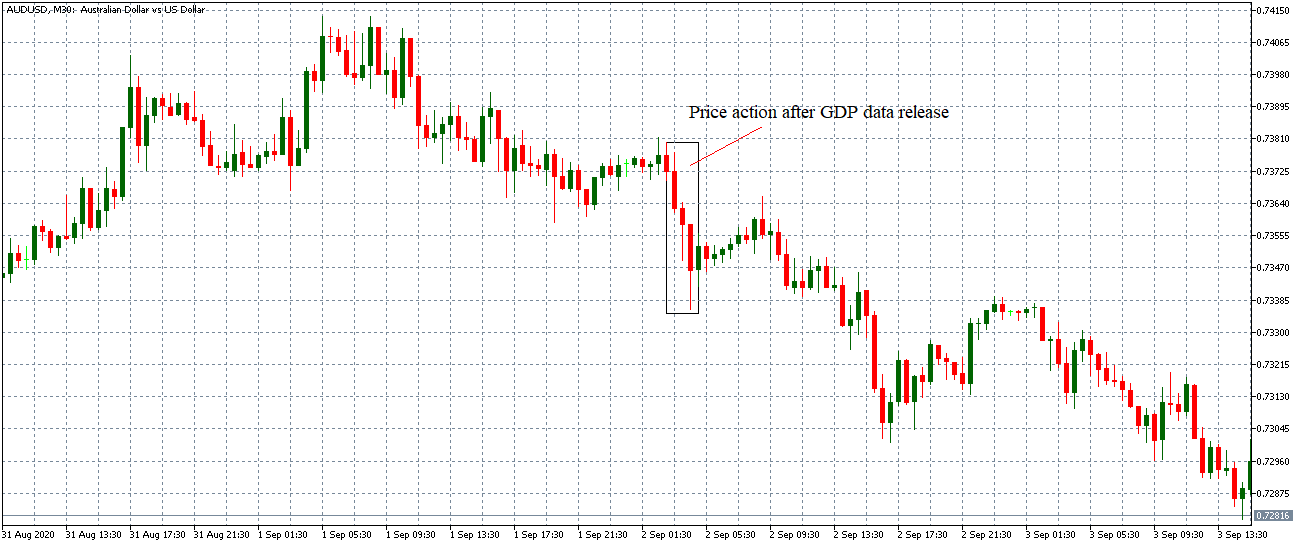
Furthermore, the price action from the release of a high-impact economic indicator can persist in the market for the long-term.
30-minute timeframe for Australia’s GDP data release. September 2, 2020, 1.30 AM GMT
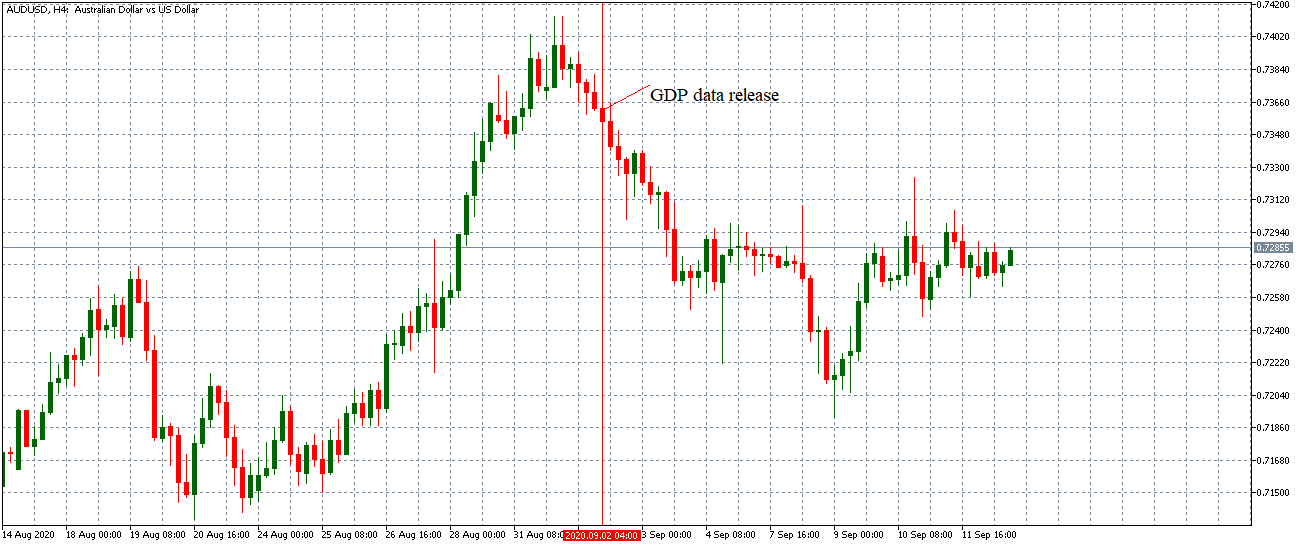
The 4-hour chart shows that the AUD/USD pair continued trending downwards due to the less than expected GDP growth data.
For low- to medium-impact economic indicators, it is best to trade shorter timeframes from 1-minute to 15-minutes.
5-minute timeframe for Australia’s retail sales data release. August 21, 2020, 1.30 AM GMT
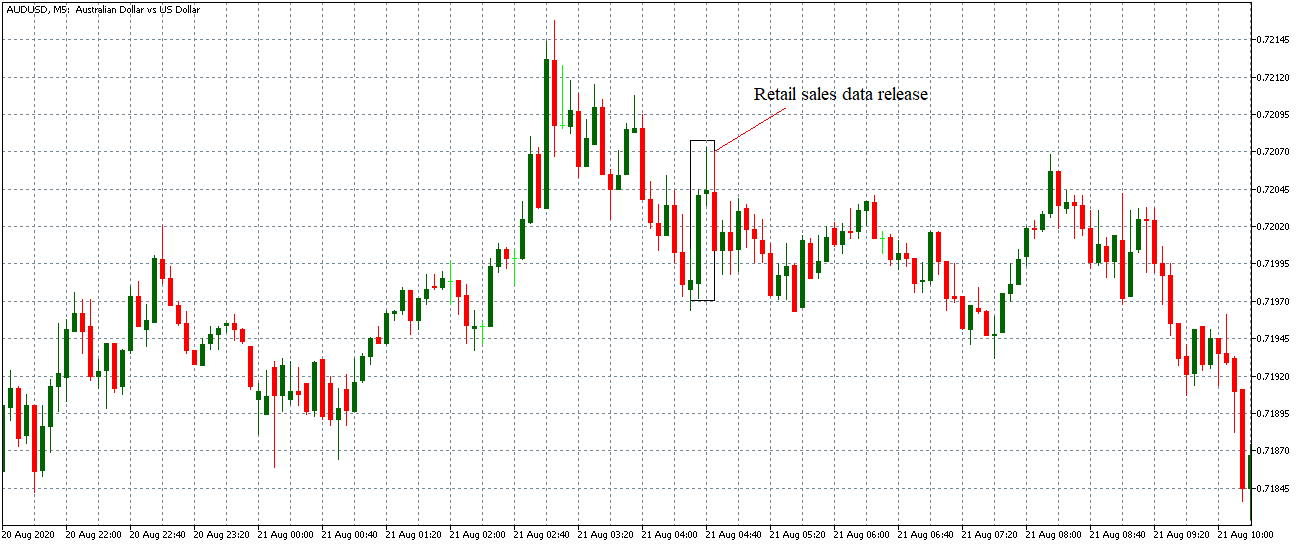
At longer timeframes, the effects of these indicators on the price action dissipates.
1-hour timeframe for Australia’s retail sales data release. August 21, 2020, 1.30 AM GMT
 [wp_quiz id=”89173″]