Categories
Forex Fundamental Analysis

GBP/JPY Global Macro Analysis – Part 2

JPY Endogenous Analysis

Summary

An overall score of -13 implies that this currency (JPY) has depreciated since the beginning of this year.

Indicator Score Total State Comment
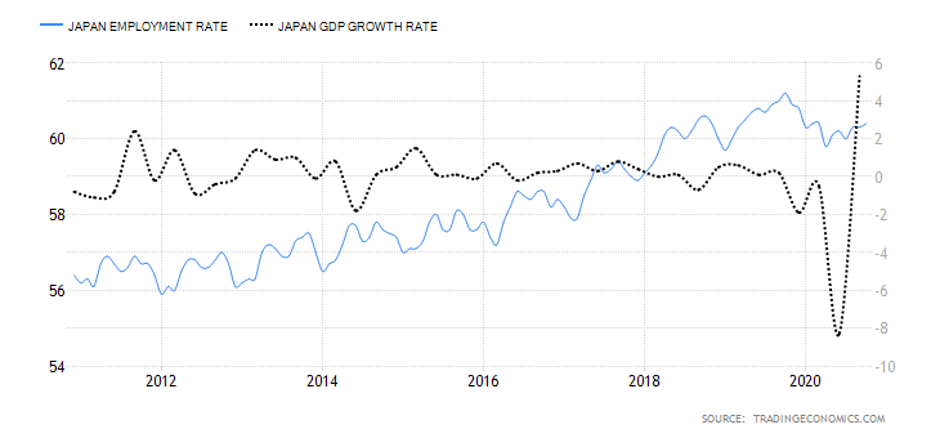
Japan Employment Rate -4 10 60.4% in October 2020 The Japanese labor market has shed about 820,000 jobs between January and October 2020
Japan Core Consumer Prices -1 10 101.2 points in November 2020 The index has dropped marginally by 0.8 points in the first 11 months
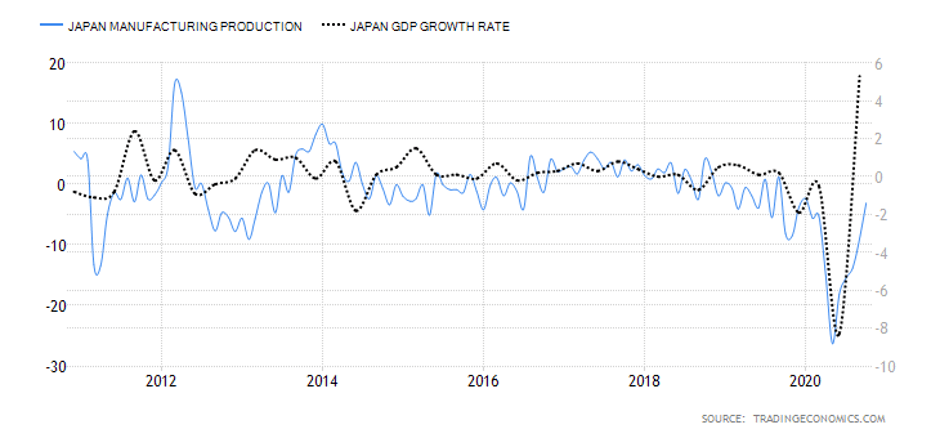
Japan Manufacturing Production 2 10 3.1% drop in October The decrease in YoY manufacturing production is slowing down
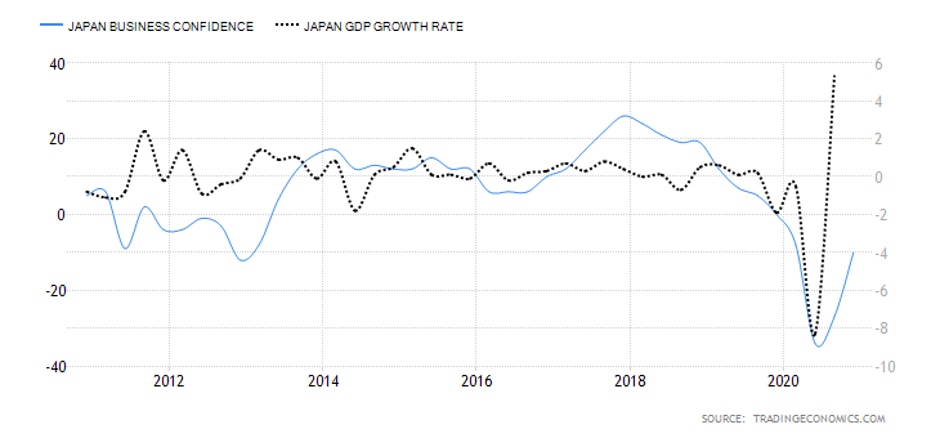
Japan  Business Confidence -2 10 Q4 reading was -10 Businesses are growing increasingly optimistic
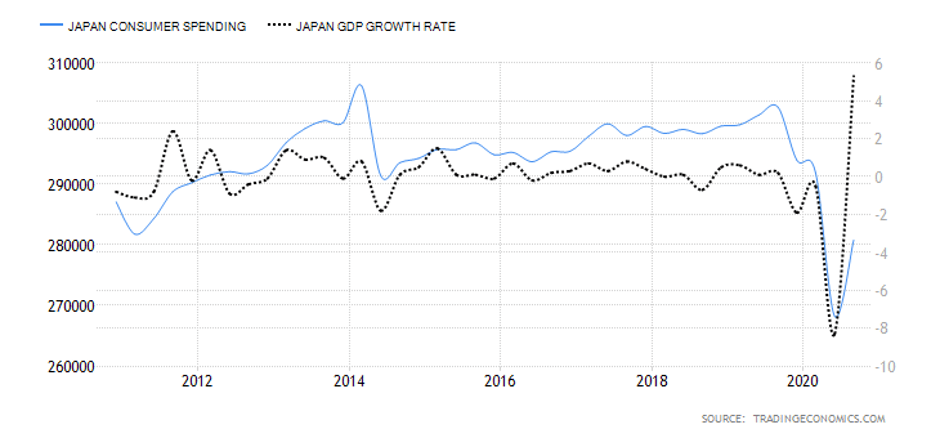
Japan Consumer Spending -2 10 Was ¥280.8 trillion in Q3 2020 The increase in Q3 expenditure by households shows that the economy is steadily recovering
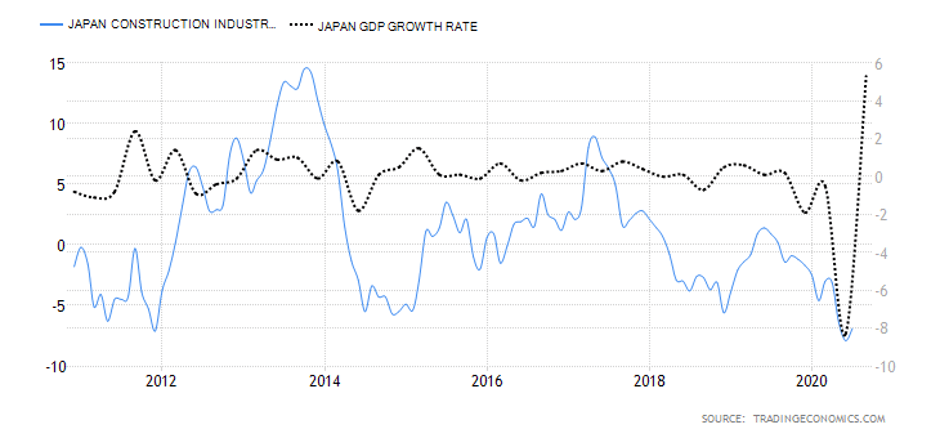
Japan Construction Industry Activity -2 10 YoY drop of 6.9% in July 2020 The July drop was the second-worst recorded in over ten years
Japan Government Budget Value -4 10 the budget deficit of ¥308414 in Q2 2020 This is the worst deficit in 20 years. It’s expected to improve as the economy goes back to normal
TOTAL SCORE -13
  • Japan Employment Rate

This indicator shows the number of Japanese nationals employed as a percentage of the entire Japanese working-age population. With this indicator, we can track the Japanese economy’s performance since employment corresponds to the expansion and contraction of the economy.

In October 2020, the Japan employment rate rose to 60.4% from 60.3% in September. Although Japan’s employment rate is higher than in January, the labor market has lost about 820,000 jobs since January. We assign a score of -4.

  • Japan Core Consumer Prices

Core consumer prices measure the inflation rate in Japan based on a select basket of goods. The core consumer prices do not include goods and services with volatile prices. Typically, when inflation rises, it implies that the economy is expanding and the labor market is growing. Conversely, when the index drops, it means that the labor market is shrinking.

In November 2020, Japan Core Consumer Prices dropped to 101.2 points from 101.3 in October. Since January, the index has shed 0.8 points. Thus, it scores a -1.

  • Japan Manufacturing Production

This indicator measures the percentage change in the value of the output in the manufacturing sector. Since the Japanese economy is highly reliant on the manufacturing sector, changes in this indicator can be considered a leading indicator of economic growth.

In October 2020, the YoY manufacturing production in Japan decreased by 3.1% compared to the 9% decrease recorded in September. The October decrease is the slowest since February.  We assign a score of 2.

  • Japan Business Confidence

In Japan, the business confidence index results from a survey of about 1100 large manufacturers with a capital of at least ¥1 billion. The survey evaluates the current industry trends, business conditions within the company and the industry, and expectations for the next quarter and year. The sentiment in Japanese businesses is ranked with an index of a scale from -100 to +100. The negative index shows pessimism, while a positive index shows optimism.

In Q4 of 2020, the Bank of Japan’s Tankan business sentiment index increased to -10 from -27 in Q3. This improvement shows that the economy is potentially recovering from the impact of the COVID-19 pandemic. However, it is still lower than the -8 registered in Q1. Thus, we assign a score of -2.

  • Japan Consumer Spending

It tracks the quarterly value of expenditure by households. In Japan, the consumption expenditure accounts for both the supply-side and demand-side. The supply-side from the survey of family income, while the demand-side is from the expenditure survey. The weighted average of both these estimates represents the final consumption expenditure.

In Q3 2020, the consumer spending in Japan rose to ¥280.8 trillion from ¥268.2 trillion in Q2. However, it is still lower than the consumer spending recorded in Q1. Japan consumer spending scores -4.

  • Japan Construction Industry Activity

This index tracks the YoY changes in the construction industry in Japan. It shows the changes in companies’ monetary value of construction work and billed to the clients. Note that in Japan, the construction industry accounts for about 6% of the total industrial activity. Thus, the construction output index can be a leading indicator of the entire industrial activity. More so, since it is a tertiary industry, it can signal longer-term changes in the GDP.

In July 2020, Japan’s YoY construction output dropped by 6.9%. This drop is the second-worst in over ten years. The worst was recorded in June at -7.9%. The Japan construction industry activity scores -2.

  • Japan Government Budget Value

In Japan, the government budget value evaluates the difference between government revenues and expenditure. This is meant to determine whether there is a government budget surplus or deficit. A budget surplus arises when revenues exceed the expenditure, while a deficit occurs when government expenditure is more than revenues.

In Q2 of 2020, Japan has a government budget deficit of ¥308414. This is the worst deficit recorded in over two decades. Thus, the Japan Government Budget Value has a score of -4.

In the upcoming article, you can find the Exogenous analysis of the GBP/JPY currency pair where we have forecasted its price movements. All the best.

Categories
Forex Assets

Understanding The EUR/JPY Asset Class

Introduction

The Euro area’s euro against the Japanese yen, in short, is termed as EURJPY. This pair, too, like the EURCHF, EURNZD, EURCAD, EURGBP, etc. is a minor or cross currency pair. It is one of the most traded currency pairs in the forex market. Here, the EUR is the base currency, and JPY is the quote currency. The value of this pair is quoted in terms of the quote currency.

Understanding EUR/JPY

This currency pair is precisely quoted as 1 EUR per X JPY. In simple terms, the value determines the units of the quote currency (JPY) required to buy one unit of the base currency (EUR). For example, if the market value of EURJPY is 121.00, it basically means that these many yen are required to purchase one euro.

EUR/JPY Specification

Spread

Spread is the difference between the bid price and the ask price set by the broker. This value is not constant and varies from broker to broker. It also varies on the type of account model.

Spread on ECN model: 0.6

Spread on STP model: 1.5

Fees

Spread is not the only way through which brokers generate their revenue. They charge some fee (commission) on each trade as well. Fees again vary from broker to broker and account model. Typically, there is no fee on an STP account. However, there are a few pips or fees on an ECN account as their spread is lesser than an STP account.

Slippage

Slippage is the difference between the trader’s asked price and the actual price given to him. Two factors majorly affect slippage on a trade; one, the volatility of the market, and two, broker’s execution speed. The slippage is usually within 0.5 to 5 pips. For major currencies, the slippage is much lower.

Trading Range in EUR/JPY

The trading range is the illustration of the minimum, average, and the maximum number of the pips the currency pair has moved in a given time frame. These values help assess the profit/loss potential of a trade. For instance, if the max volatility on the 1H is 10 pips, then one can expect to win or lose a maximum of $92 (10 pip x 9.20 value per pip) in an hour or two.

Procedure to assess Pip Ranges

  1. Add the ATR indicator to your chart
  2. Set the period to 1
  3. Add a 200-period SMA to this indicator
  4. Shrink the chart so you can determine an extensive period
  5. Select your desired timeframe
  6. Measure the floor level and set this value as the min
  7. Measure the level of the 200-period SMA and set this as the average
  8. Measure the peak levels and set this as Max.

EUR/JPY Cost as a Percent of the Trading Range

In addition to assessing the profit/loss in a timeframe ahead of time, we can use these values in determining the cost variation in different timeframes and volatility as well. The cost as a percent of the trading range tells the min, average, max costs by considering the timeframes and volatility as its variables.

ECN Model Account 

Spread = 0.6 | Slippage = 2 | Trading fee = 1

Total cost = Slippage + Spread + Trading Fee = 2 + 0.6 + 1 = 3.6

STP Model Account

Spread = 1.5 | Slippage = 2 | Trading fee = 0

Total cost = Slippage + Spread + Trading Fee = 2 + 1.5 + 0 = 3.5

The Ideal way to trade the EUR/JPY

Above are the costs of each trade in terms of percentages. Note that they do not represent the actual cost on trade in terms of dollars, but are magnitude values which can be used for comparing with other values. The higher the magnitude of the percentage, the higher is the cost on the trade for that particular timeframe and volatility. From the tables, it can be ascertained that the values are highest on the min column and lowest on the max column. This, in turn, implies that the costs are higher when the volatility is low and vice versa. Talking about the timeframe, the costs are high on the lower timeframes and low on the higher timeframes. So, a day trader may preferably trade on the 2H/4H when the volatility is around the average values. And long-term traders may trade the 1W/1M whatsoever be the volatility of the market.

Furthermore, a trader may reduce their costs by entering and exiting trades using limit order instead of market orders. This will completely erase the slippage on the trade. An example of the same is given below.

Total cost = Spread + trading fee = 0.6 +1 = 1.6

Categories
Forex Assets

Understanding The Fundamentals Of USD/JPY Forex Pair

Introduction

USDJPY is the abbreviation for the currency pair US dollar against the Japanese yen. This currency pair is very liquid and volatile. It is classified as a major currency pair. Here, USD is the base currency, and JPY is the quote currency. The currency pair shows how many JPY are required to purchase one US dollar.

Understanding USD/JPY

The exchange rate of USDJPY represents the units of JPY equivalent to one US dollar. For example, if the value of USDJPY is 109.550, then these many Japanese yen are required to buy one US dollar.

USD/JPY Specification

Spread

Spread is simply the difference between the bid price and the ask price. It depends on the account type. The average spread for ECN and STP account is shown below.

Spread on ECN: 0.5

Spread on STP: 1.2

Fees

The fee is basically the commission charged by the broker on each trade. Typically, the fee on STP accounts is nil, and there is some fee on the ECN account. There is no fixed fee on the ECN account and varies from broker to broker.

Slippage

Slippage is the difference between the price needed by the trader and the real price the trader was executed. Slippage happens when orders are executed as market orders. The slippage is usually within the range of 0.5 to 5 pips.

Trading Range in USD/JPY

The trading range is the representation of the minimum, average, and maximum volatility on a particular timeframe. It shows the range of pips the currency pair moved on a given timeframe. These values prove to be helpful in assessing a trader’s risk and controlling their cost on a trade.

USD/JPY PIP RANGES

Procedure to assess Pip Ranges

  1. Add the ATR indicator to your chart
  2. Set the period to 1
  3. Add a 200-period SMA to this indicator
  4. Shrink the chart so you can assess a large time period
  5. Select your desired timeframe
  6. Measure the floor level and set this value as the min
  7. Measure the level of the 200-period SMA and set this as the average
  8. Measure the peak levels and set this as Max.

USD/JPY Cost as a Percent of the Trading Range

Just knowing how many pips the currency pair moved is pointless. To bring it some value, it is clubbed with the total cost to understand how the cost varies based on the volatility of the market. It shows cost and volatility are dependent on each other.

The relation between Cost and Volatility

Cost and volatility are inversely proportional to each other. When the volatility of the market is low, the costs are high; and when the volatility is high, the cost is low. More on this is discussed in the subsequent section.

ECN Model Account

Spread = 0.5 | Slippage = 2 | Trading fee = 1

Total cost = Slippage + Spread + Trading Fee = 2 + 0.5 + 1 = 3.5

STP Model Account

Spread = 1.2 | Slippage = 2 | Trading fee = 0

Total cost = Slippage + Spread + Trading Fee = 2 + 1.2 + 0 = 3.2

The Ideal way to trade the USD/JPY

The above two tables are formed by finding the ratio between the total cost and the volatility. It is then expressed in terms of a percentage. Comprehending the values is simple. It is based on the relation between cost and volatility. If the percentage value is high, then the cost is high for that particular volatility and timeframe. It can be inferred that the min column has the highest values compared to the average and max column. This simply means that the costs are high when the volatility of the market is low. Hence, it is recommended to open/close positions when the volatility is at or above the average mark.

Furthermore, apart from volatility, the cost is heavily affected by the slippage. As mentioned, this happens due to market order executions. Hence, to reduce your cost by up to 50% on each trade, it is recommended to trade using limit orders and not market orders.

Categories
Forex Course

15. All About Trading The Tokyo Session!

Introduction

Japan’s capital Tokyo, is the most majorly traded market in the Asian continent. That is, in Asia, the highest volume comes from the Tokyo market. In fact, it is considered the financial capital of Asia. Moreover, it is the third-largest trading center in the world.

The Tokyo session, also referred to as the Asia session, opens at 8:00 PM EST and is traded until 5:00 AM EST. In terms of Japan’s local time, the trading happens between 9:00 AM to 6:00 PM. As ‘Yen’ is the currency of Japan, 16.50% of all the Yen transactions take place during this time. And as far as all currency transactions are concerned, the value lies at 21%.

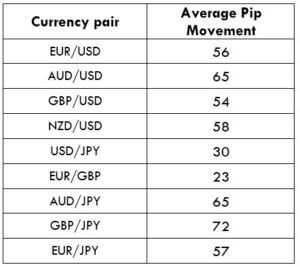
The one that matters the most during any session is the pip movement in different pairs. Below is a table which represents the average pip movement for some of the major currency pair.

Now, the average of the above currency pairs turns out to be around 53 pips. This number is less when compared to the New York session and the London session.

Some facts about trading the Tokyo session

During this session, the market is seen to fade away its momentum. That is, the market is seen to be quite flat. In technical terms, the market usually goes through a consolidation state. This session might not be the ideal session for the ones looking for large pip movement. However, this session can be great for scalpers.

Tokyo market typically is known to correct the overbuying and selling in the New York session. The market makes drastic moves during the NY session and comes to slows down its pace during the Tokyo session. Therefore, the liquidity during this session is quite feeble.

It is not just the central banks and hedge funds that move the market. Since Japan is the largest exporter in the world, a large number of transactions come from the exporters as well.

Also, the Bank of Japan is an active participant in the forex market during the Tokyo session. This is because it intervenes the curb appreciation in the Yen regularly.

Which currency pairs should you focus on?

The market conditions and situations tend to change from time to time, so it becomes uncertain to predict the exact movement of pairs. However, if we were to consider the average rates, we can keep an eye on the news from countries like Australia, New Zealand, China, and Japan. The news from these countries comes during the Tokyo session or just before its open. And the news usually pumps up the volatility and liquidity of the market. Hence, one can have a focus on AUD, NZD, and JPY pairs.

When the Tokyo session comes to an end, the London markets open, which causes overlap between the two sessions. So, to be part of the significant movements, keep an eye on GBP, EUR, and CHF along with AUD, NZD, JPY, and USD.

This is a brief review of the Tokyo session. We shall discuss the other sessions as well in the upcoming lessons. Take the below quiz to know if you have learned the concepts right.

[wp_quiz id=”46800″]