Categories
Forex Assets

Asset Analysis – Trading The Natural Gas Commodity Asset

Introduction

Natural gas is a soft commodity that is extensively traded in the market, like Crude Oil. The price changes every moment, as it is publicly traded on an exchange. The price of natural gas is determined by supply and demand in the physical market, as well as the demand and supply from the traders in the online market.

Understanding Natural Gas

Trading natural gas in the online market is speculating the short-term price fluctuations. Buying natural gas is only an electronic transaction and does not mean the physical purchase of the commodity.

There are several ways to trade natural gas in the online market. One of the heavily traded ways is through futures contracts. A futures contract is a contract (agreement) to buy or sell an asset at a future price.

Chicago Mercantile Exchange (CME Group) is the route through which nature gas futures is traded. There are many types of natural gas and its contracts that can be traded. However, the most traded contract is the Henry Hub Natural Gas Futures (NG).

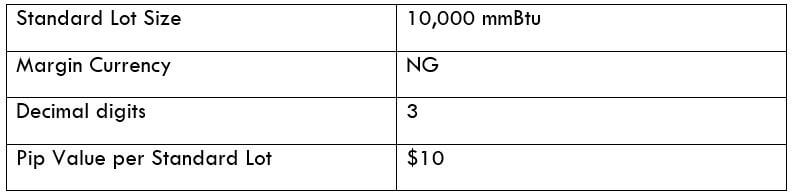
Each contract of NG represents 10,000 million British thermal units (mmBtu). In the futures exchange market, NG fluctuates with a minimum of $0.001. In other words, a $0.001 price movement in NG represents one pip (tick). Like pip value in forex, the tick value of NG is $10. For every tick in price, a trader will see a $10 change in P/L.

Natural Gas Specification

Fees Associated with Natural Gas Futures Trading

There are different types of fees involved while trading natural gas futures. Typically, there are four basic fees that a brokerage charges for every futures contract traded:

  • Exchange/Clearing fees
  • National Futures Association (NFA) fee
  • Data fees
  • Brokerage commissions

The types of the fee listed above are either charged “per side” or “round turn” basis. Also, it varies from broker to broker.

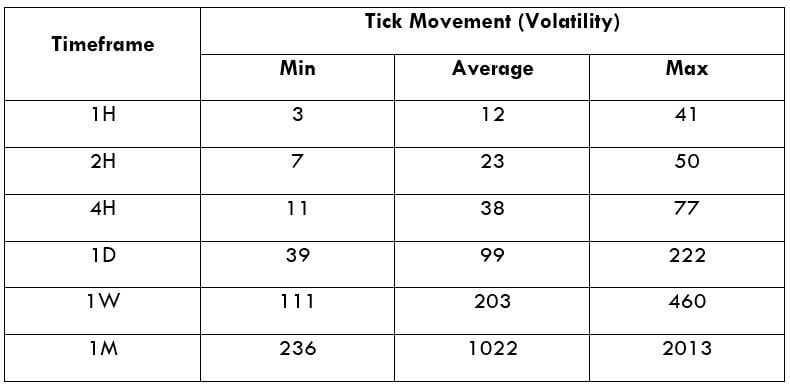
Trading Range in Natural Gas

A trading range represents the price fluctuations in natural gas in different time frames. Similar to pips in currency pairs, the price movement in natural gas is represented in ticks, where each tick is an increment of $0.001.

Procedure to assess Pip Ranges

  1. Add the ATR indicator to your chart
  2. Set the period to 1
  3. Add a 200-period SMA to this indicator
  4. Shrink the chart so you can assess a significant period
  5. Select your desired timeframe
  6. Measure the floor level and set this value as the min
  7. Measure the level of the 200-period SMA and set this as the average
  8. Measure the peak levels and set this as Max.

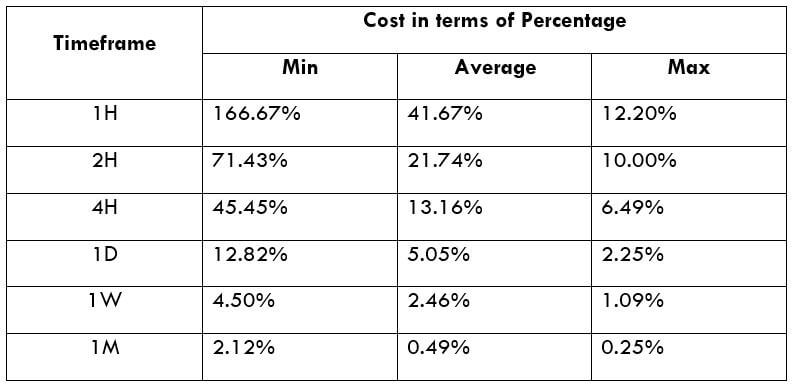
Cost as a Percent of the Trading Range

Cost a percent of the trading range is the depicts the variation in fees on the trade-in different time frames for varying volatility. It is simply the ratio of the total fee and the tick values.

Total fee (per contract) = $50 (5 ticks) [approx. fee]  

Trading the Natural Gas

Natural gas is heavily traded in the futures market. It is a soft commodity like Crude Oil and is quite popular in the commodity space. Traders speculate on natural gas using both fundamental and technical analysis. The fundamentals of NG vary from that of other commodities, while the technical analysis works perfectly the same as any other asset. The fee structure, too, is pretty different from that of currency pairs, as it is mostly traded in the futures market. However, the total fee is more or less the same.

Understanding the fee variation

The fee is something that varies relatively with the change in time frame and volatility traded. In essence, a trader trading the 1H time frame will have to pay relatively more fee than a trader speculating on the 4H. Due to this, the percentage values are higher on the 1H time frame than the 4H time frame.

Likewise, the relative fee is higher when the market volatility is at the minimum values, even though the time frame remains the same. So, to efficiently manage the fee, one must trade during the times when the market volatility is at or above the average values.

Categories
Forex Assets

All you need before trading the EUR/USD Pair

The EUR/USD pair tracks the exchange rate of the Euro against the US Dollar. Since this pair represents a combination of the two stronger economies in the world, it is the most traded asset in Forex, and, therefore, the one with higher liquidity and less spread and slippage.

The value assigned represents how many US dollars are needed to buy a single EUR. That is, the quote is presented as 1 euro per x US dollars. For example, the current value is 1.1079, which means a trader needs to use 1.1079 dollars for every Euro he is willing to buy.

EUR/USD SPECIFICATIONS

LOT SIZE 100,000 EUR
MAGIN CURR. EUR
DIGITS 5
PIP VALUE $10
MIN TRADE SIZE 0.01 LOTS
MAX TRADE SIZE 1000 LOTS
AVERAGE 24H  VOLUME $575 BILLION


Spread

Spread is the difference between the bid and the ask prices. The EUR/USD spread varies depending on the account type. 

ECN: 0.3 pip

STP: 1 pip

Fees

The broker charges a fee per lot on ECN accounts, and usually, no fee on STP accounts The usual fee on an STP broker is from 6 to 10 pips per round trip and lot. Other

Slippage: Slippage is the difference between the trader’s intended price and the real price he received from the broker. It depends on the current volatility at the moment of the order. Slippage can be in favor of or against the trader.

Depending on the broker’s execution speed, slippage can be as low as 0.5pip or as high as 3 pips. 

Note:  Slippage happens twice: At the open and the close of a position.

Trading Ranges:

The following trading range tables measure the min, average, and max volatility of the asset at different timeframes.  Range figures usually multiply by the square root of two for every doubling of the timframe. That is, if the hourly timeframe volatility is 1, its 2h timeframe will show 1.41 on the same date. Trading ranges are useful tools to assess the risk. If the hourly volatility of the EURUSD is 20 pips, it means a potential $200 gain or loss in an hourly time span ( 20 pips + $10 value per pip).

The values shown depict ranges occurring at the moment of the creation of this document. The trader should assess the actual values at the moment of his trading activity.

        EUR/USD PIP RANGES  

MIN AVERAGE MAX
1H 5.9 10.4 26
2H 8.5 14.5 37
4H 13 22.1 49
D 45 64 114
W 119 160 210
M 290 537 918


Procedure to assess Pip Ranges

  1. Add the ATR indicator to your chart
  2. Set the period to 1
  3. Add a 200-period SMA to this indicator
  4. Shrink the chart so you can assess a large time period
  5. Select your desired timeframe
  6. Measure the floor level and set this value as the min
  7. Measure the level of the 200-period SMA and set this as the average
  8. Measure the peak levels and set this as Max.

EURUSD Cost as a percent of the Trading Range

To compute the costs, we add the trading fee, an average slippage value x 2 converted to pips, and we calculate what percent represents the min, average, and max of the ranges, assuming a range represents the amount of potential profit for one unit of time.

ECN MODEL ACCOUNT

ECN MIN AVERAGE MAX
Total 3.3 1H 55.93% 31.73% 12.69%
Slippage 2 2H 38.82% 22.76% 8.92%
Spread 0.3 4H 25.38% 14.93% 6.73%
Trading_Fee 1 D 7.33% 5.16% 2.89%
W 2.77% 2.06% 1.57%
M 1.14% 0.61% 0.36%


STP MODEL ACCOUNT

STP MIN AVERAGE MAX
Total 3.5 1H 59.32% 33.65% 13.46%
Slippage 2 2H 41.18% 24.14% 9.46%
Spread 1.5 4H 26.92% 15.84% 7.14%
Trading_Fee 0 D 7.78% 5.47% 3.07%
W 2.94% 2.19% 1.67%
M 1.21% 0.65% 0.38%


Best EUR/USD timeframe for trading

From the above charts, we see that hourly charts show a very high cost on entries with low volatility ( the Min column) therefore to trade these timeframes, traders need to spot the surges in volatility and be right most of the time to compensate for the 50%+ costs.

Intraday traders’ best timeframe is, definitively 4H, although the should optimize the costs using proper assessment of the volatility.

In both cases, strategies that take away slippage using limit orders would dramatically reduce costs and improve the results.

As an example, these are the results if we take away slippage using limit orders in entries and exits on an ECN account.

ECN MIN AVERAGE MAX
Total 1.3 1H 22.03% 12.50% 5.00%
Slippage 0 2H 15.29% 8.97% 3.51%
Spread 0.3 4H 10.00% 5.88% 2.65%
Trading_Fee 1 D 2.89% 2.03% 1.14%
W 1.09% 0.81% 0.62%
M 0.45% 0.24% 0.14%


We can see a percentual reduction of over 50% in costs, compared to market orders with slippage.