Introduction
CAD/SGD is a Forex exotic currency pair where CAD represents the Canadian Dollar and the SGD, – the Singapore Dollar. For this pair, the CAD is the base currency, and the SGD is the quote currency. Therefore, the price attached to the pair is the quantity of the SGD that can be bought by 1 CAD. If the price of the CAD/SGD pair is 1.0289, it means that 1 CAD dollar buys for 1.0289 SGD.
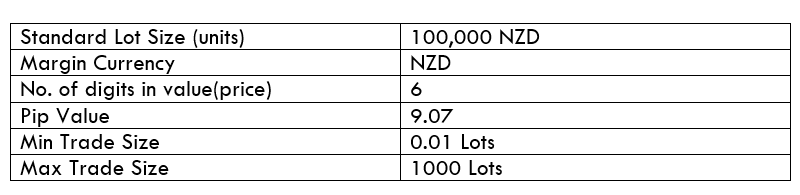
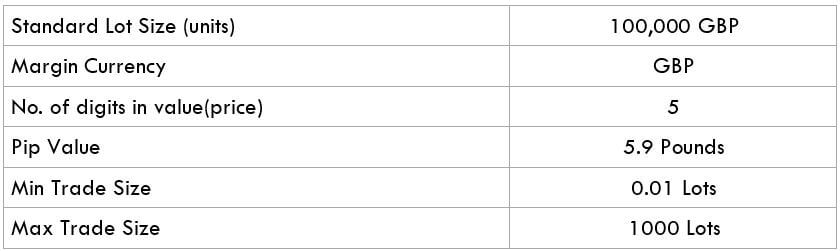
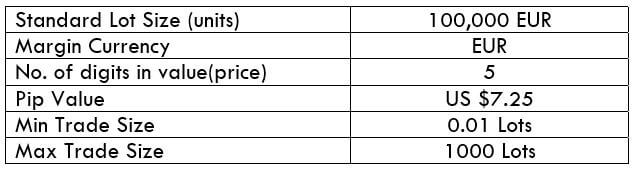
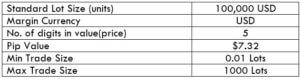
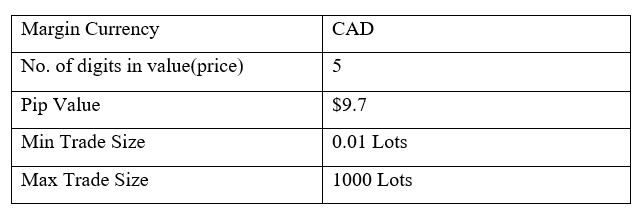
CAD/SGD Specification
Spread
In forex trading, the difference in pips between the buying price (bid) and selling price (ask) is the spread. Forex brokers primarily generate their revenues through the spread. The spread varies depending on the type of trading account. The spread for the CAD/SGD pair is:
ECN: 7 pips | STP: 12 pips
Fees
For every individual trade made on an ECN account, one has to pay a commission. This fee varies with the broker and depends on the type of trade executed and the currency being traded. STP accounts do not have fees.
Slippage
In forex trading, slippage is the difference in the price in which a trader initiates a trade and the price at which it is executed. Slippage is a direct result of the brokers’ speed of execution and market volatility.
Trading Range in the CAD/SGD Pair
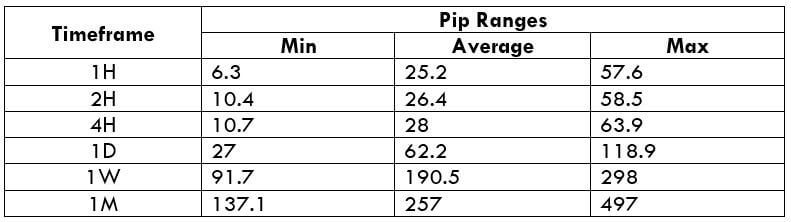
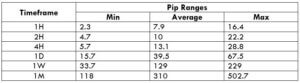
In forex, the trading range shows the fluctuation of a currency pair within s specific timeframe. The trading range is useful to estimate potential profit or loss from trading different timeframes. For example, if the CAD/SGD pair fluctuates ten pips in the 2-hour timeframe, it means that a trader can expect to either gain or lose $97 by trading one standard lot.
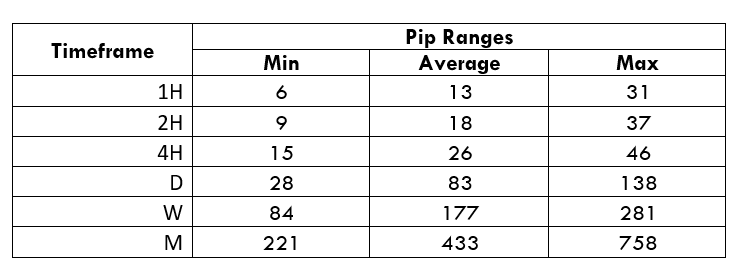
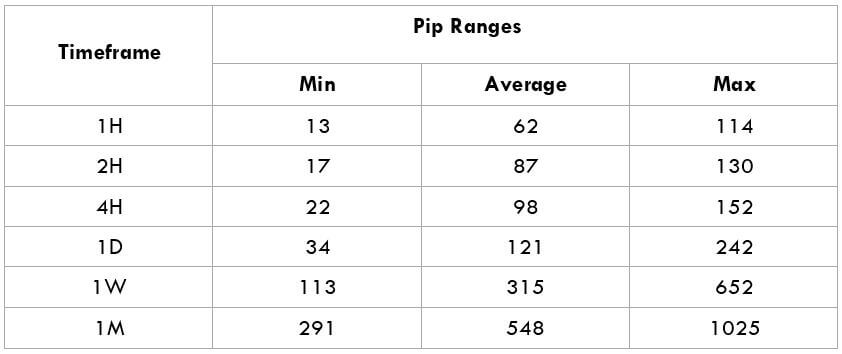
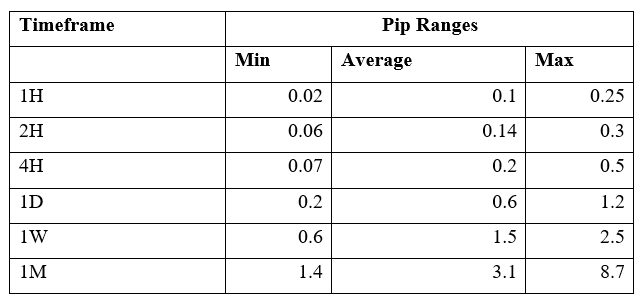
Below is a table showing the minimum, average, and maximum volatility of CAD/SGD across different timeframes.
The Procedure to assess Pip Ranges
- Add the ATR indicator to your chart
- Set the period to 1
- Add a 200-period SMA to this indicator
- Shrink the chart so you can determine a larger period
- Select your desired timeframe
- Measure the floor level and set this value as the min
- Measure the level of the 200-period SMA and set this as the average
- Measure the peak levels and set this as Max.
CAD/SGD Cost as a Percentage of the Trading Range
Cost expressed as the Percentage of the trading range helps a forex trader establish the anticipated trading costs under different market volatility across different timeframes.
Total cost = Slippage + Spread + Trading Fee
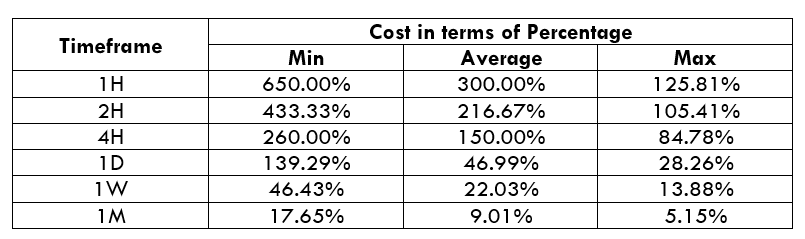
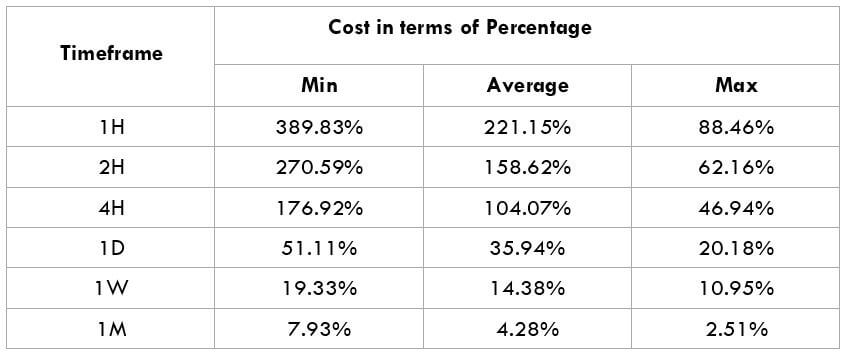
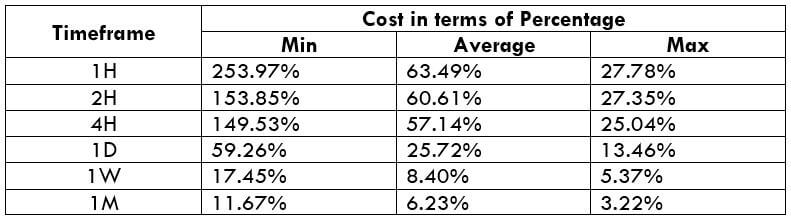
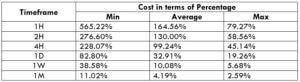
The tables below show the percentage costs to be expected when trading the CAD/SGD pair. The costs are expressed as a percentage of pips.
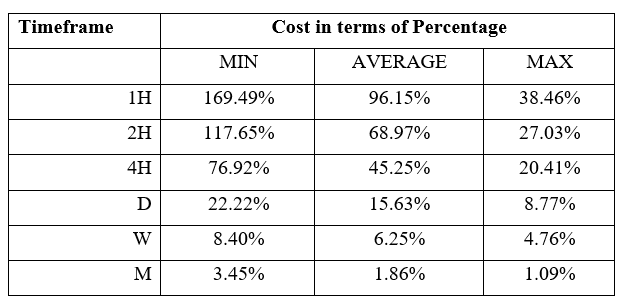
ECN Model Account
Spread = 7 | Slippage = 2 | Trading fee = 1
Total cost = 10
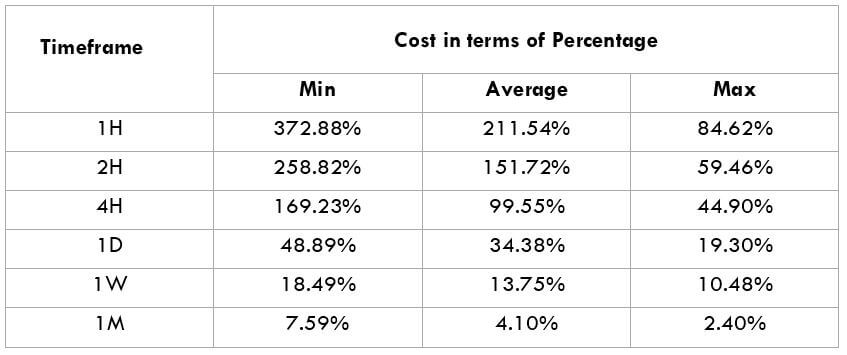
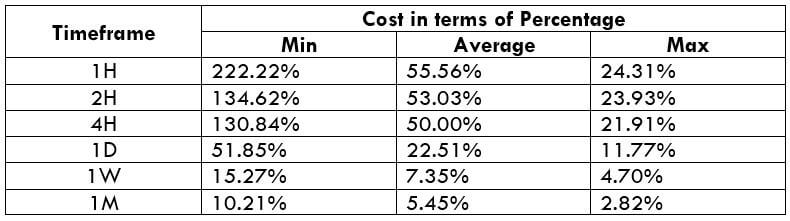
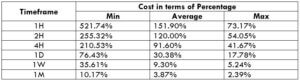
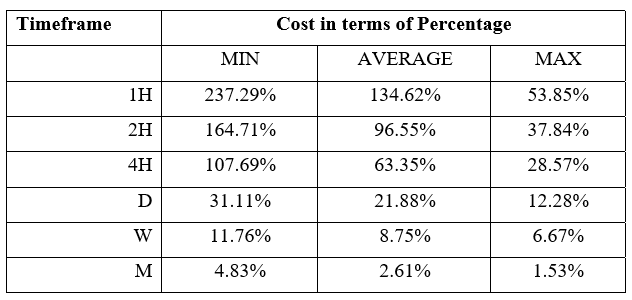
STP Model Account
Spread = 12 | Slippage = 2 | Trading fee = 0
Total cost = 14
The Ideal Timeframe to Trade CAD/SGD
We can see that in both the ECN and the STP accounts, costs are higher when volatility is at a minimum across all timeframes. Furthermore, we can observe that these costs tend to reduce when the volatility increases to the maximum.
For the CAD/SGD pair, costs are highest when volatility is at the lowest at 0.02 pips during the 1-hour timeframe. Conversely, the trading costs are lowest at the 1-month timeframe when volatility is at a maximum of 8.7 pips. Since high volatility can be risky and low volatility less profitable, forex traders should consider trading during times of average volatility.
More so, traders can increase their profitability by eliminating the costs associated with slippage. By using limit instead of market orders, forex traders can avoid experiencing slippage when entering and exiting positions.
Let’s have a look at how zero slippage cost affects the total costs.
ECN Account Using Limit Model Account
Total cost = Slippage + Spread + Trading fee
= 0 + 7 + 1 = 8
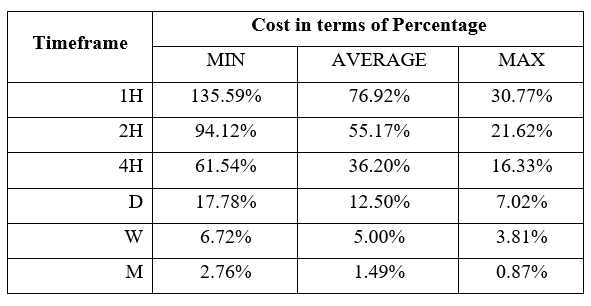
Notice that using the limit order type reduces the overall costs. The highest cost, for example, has reduced from 169.49% to 135.59%.