Introduction
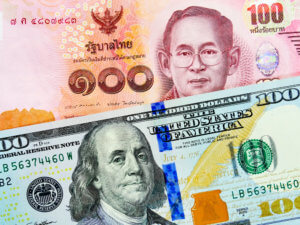
USD/NOK is the abbreviation for the US Dollar against the Norwegian Krone. This pair comes under the classification of exotic currency pairs. In this pair, USD is the base, and NOK is the quote currency.

Understanding USD/NOK
The value of USDNOK determines the value of NOK that is equivalent to one US Dollar. It is quoted as 1 USD per X NOK. So, if the market value of this pair is 9.2913, then these many units of Norwegian Krone are required to buy one US Dollar.
Spread
Spread is the difference between the bid price and the ask price in the market. This difference is the revenue for the brokers. Spread typically varies on how the broker executes the trades. The approximate spread on ECN and STP accounts is given below.
ECN: 13 pips | STP: 15 pips
Fees
The commission that a broker charges their clients is referred to as the fee. This is not constant and varies from broker to broker. The fee on ECN accounts is around 5-10 pips, and on STP accounts, it is nil.
Slippage
Slippage is the difference between the trader’s demanded price and the actual executed price. Market volatility and the broker’s execution speed are the reasons for slippage to occur.
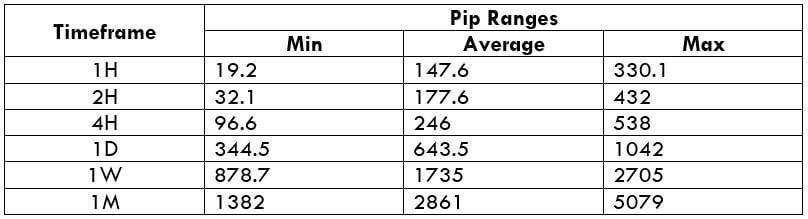
Trading Range in USD/NOK
A trading range is the tabular representation of the minimum, average, and maximum pip movement in a currency pair. Below are the values of USDNOK that help us assess the profit/loss one can incur in a trade.
Procedure to assess Pip Ranges
- Add the ATR indicator to your chart
- Set the period to 1
- Add a 200-period SMA to this indicator
- Shrink the chart so you can determine a large time period
- Select your desired timeframe
- Measure the floor level and set this value as the min
- Measure the level of the 200-period SMA and set this as the average
- Measure the peak levels and set this as Max.
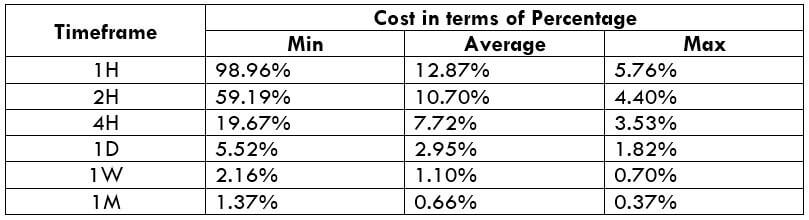
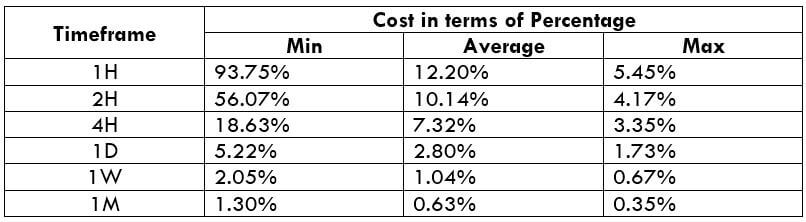
USD/NOK Cost as a Percent of the Trading Range
Here we take the ratio of the total cost on the trade and the volatility values and represent them in percentages. These percentages are then used to determine the cost variation in trade in different timeframes.
ECN Model Account
Spread = 13 | Slippage = 3 |Trading fee = 3
Total cost = Slippage + Spread + Trading Fee = 3 + 13 + 3 = 19
STP Model Account
Spread = 15 | Slippage = 3 | Trading fee = 0
Total cost = Slippage + Spread + Trading Fee = 3 + 15 + 0 = 18
The Ideal way to trade the USD/NOK
In this section, we interpret what the above percentages actually mean and how to make use of it.
The magnitude of the percentages represents how high or low are the costs of trade. So the higher the values, the higher is the cost and vice versa. From the table, it can be ascertained that the costs are pretty on the higher in the min column. This means that the costs are high when the market’s volatility is low. But it is not ideal to trade during these times due to high costs.
To have an equilibrium on costs as well as volatility, it is perfect for entering during those times when the volatility of the current market is around the average values.
Now, if you still wish to reduce your costs, you may trade using limit orders instead of market orders. This will completely nullify the slippage on the trade and hence bring down the total cost as well.