
Introduction
CAD/ILS is an exotic currency cross. Here, CAD is the Canadian Dollar, and ILS is the Israeli Shekel. The CAD is the base currency, and the ILS is the quote currency. Therefore, the price of the CAD/ILS pair represents the quantity of the ILS that CAD can buy. If the price of the pair is 2.6004, it means that 1 CAD can buy 2.6004 ILS.
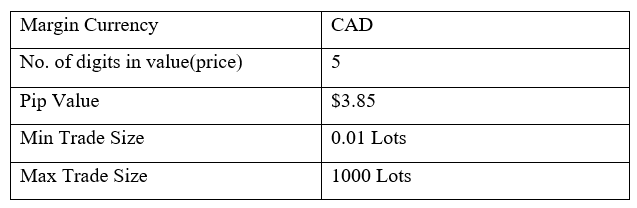
CAD/ILS Specification
Spread
The buying price and the selling price of a currency pair tend to be different in forex. The difference between these two prices is the spread. The spread for the CAD/ILS pair is: ECN: 22 pips | STP: 27 pips
Fees
Forex brokers charge a commission on every trade made with the ECN account. The commission varies depending on the broker and the type of trade. Trades on STP accounts do not attract a trading fee.
Slippage
It is rare for a trader to get the exact price they request for a trade. Usually, there is a difference between the price requested and the execution price. This difference is the slippage, and it depends on market volatility and the speed of trade execution.
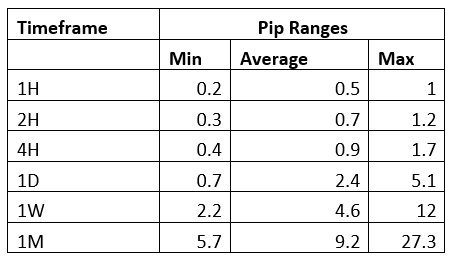
Trading Range in the CAD/ILS Pair
The trading range is the analysis of how currency fluctuates across different timeframes in terms of pips. The trading range is used to analyze a currency pair’s volatility and expected profit. For example, if on the 2-hour timeframe the trading range of the CAD/ILS pair is 10 pips, then a trader can expect to either gain or lose $38.5
Here’s the trading range for the CAD/ILS pair.
The Procedure to assess Pip Ranges
- Add the ATR indicator to your chart
- Set the period to 1
- Add a 200-period SMA to this indicator
- Shrink the chart so you can determine a larger period
- Select your desired timeframe
- Measure the floor level and set this value as the min
- Measure the level of the 200-period SMA and set this as the average
- Measure the peak levels and set this as Max.
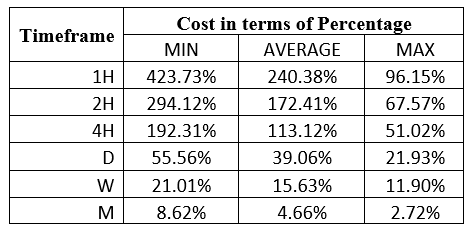
CAD/ILS Cost as a Percentage of the Trading Range
The cost of trading any currency involves the slippage, fees, and the spread. These costs vary across different timeframes under different volatility conditions. For a forex trader, analyzing the cost as a percentage of the trading range helps implement informed risk management techniques.
The tables below show the analyses of the trading costs for the CAD/ILS pair across different timeframes.
ECN Model Account
Spread = 22 | Slippage = 2 | Trading fee = 1
Total cost = 25
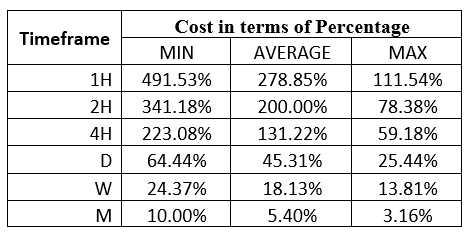
STP Model Account
Spread = 27 | Slippage = 2 | Trading fee = 0
Total cost = 29
The Ideal Timeframe to Trade CAD/ILS
We can see that the trading cost for the CAD/ILS pair is higher during shorter timeframes and low volatility in both the ECN and STP accounts. Longer-term traders trading on weekly and monthly timeframes enjoy relatively lesser trading costs than shorter timeframe traders.
It is worth noting that for every type of trader, initiating trades when volatility is above average reduces the trading costs. Furthermore, opting to use forex limit orders instead of market orders which are susceptible to slippage, can significantly reduce trading costs. With limit orders, the risk of slippage is removed hence lowering trading costs. Here are the trading costs when limit orders are used.
ECN Account Using Limit Model Account
Total cost = Slippage + Spread + Trading fee
= 0 + 22 + 1 = 23
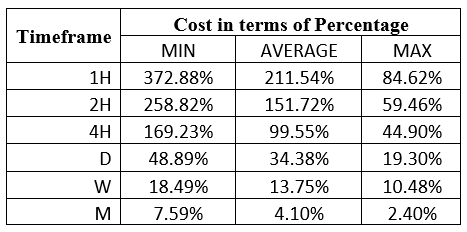
We can see that trading costs for the CAD/ILS have reduced across all timeframes, with the highest cost dropping from 491.53% to 372.88% of the trading range.