Categories
Forex Basics

What Does One Lot Represent in Forex Trading?

If you’re new to the forex trading world, you might find yourself scratching your head at some of the terminologies. Terms like leverage, broker, and pip often confuse beginners, but it’s easy to understand these terms if you spend time researching what they mean. Today, we will start by discussing the common trading term “lot”, which simply refers to the size of a trade or the amount that the trader is trading at any given time.

There are four different lot sizes

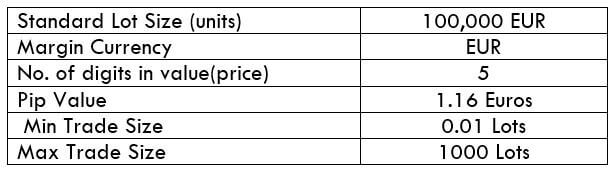
  • A Standard lot is equal to 100,000 units of the base currency
  • A Mini lot is equal to 10,000 units of the base currency or 10% of the standard lot
  • A Micro lot is equal to 1,000 units of the base currency or 1% of the standard lot
  • A Nano lot is equal to 1,000 units of the base currency or 0.1% of the standard lot

A standard lot is often considered to be the default lot size, but many brokers offer accounts that support the trading of mini and micro lots. It’s a bit harder to find an account that supports nano lots, although this isn’t impossible. 

For example: If you trade 1 lot (100,000 units) of AUDUSD, the size of your trade is equal to 100,000 units of the AUD currency.

What is a Pip? Understanding Pips and their Value

We mentioned the term “pip” earlier as another trading term that leaves many beginners feeling confused. A pip, also known as a percentage point, refers to the change in value between two different currencies. With the exception of yen pairs, a pip is typically 0.0001. With yen currencies, a pip is 0.01.

For example: If the value of EURUSD opens at 1.1465, and closes at 1.1475, the difference in value is 10 pips. 

Traders use this formula to calculate the value per pip: 

Pip value in Counter/Quote currency = (pip in decimal X 100,000)

If you’re still confused, you don’t have to worry about calculating pip value manually, as you can simply use a free pip value calculator online. It’s important to understand why pip value is needed because traders need to know about lots, pips, and pip value in order to calculate their profits and losses. In order to do so, you’ll use this formula:

Profit/Loss = Number of Pips x Value per Pip x Lot size

Example 1: You buy Euros at $1.2178 per Euro and sell at $1.2188 per Euro with a transaction size of 100,000 (one standard lot). In order to calculate your profit or loss, you’ll plug the numbers into the provided formula:

(1.2188 – 1.2178) X 100,000 = $100

In this example, we subtracted the buying price from the selling price and then multiplied by the transaction size of 100,000 (one standard lot). The result shows that there was a $100 profit from this transaction.

Example 2: You buy GBP at 1.8384 and sell at 1.8389 with a transaction size of 10,000 (one mini lot). You’ll then plug these numbers into the formula:

(1.8389 – 1.8384) X 10,000 = $5

In this example, the transaction produced a $5 profit. Note that we multiplied by 10,000 because the size of the transaction was one mini lot, while we multiplied by 100,000 in the first example because the size was one standard lot. 

Using a Position Size Calculator

As we mentioned earlier, you can find a free position size calculator online if you’d prefer to avoid manual calculations. A quick Google search for “forex position size calculator” will bring up several results. From there, you’ll just need to plug the details into the calculator and sit back while it does the work for you. 


Categories
Forex Assets

Everything About The EUR/RUB Forex Asset

Introduction

The EUR/RUB is the abbreviation of the Euro Area’s Euro against the Russian Ruble. This is an exotic-cross currency pair. The volatility and volume in this pair are good enough for traders to day trade this currency. Here, the EUR is the base currency, and the RUB is the quote currency.

Understanding EUR/RUB

The price in the exchange market of the EUR/RUB specifies the value of RUB that is needed to purchase one Euro. It is quoted as 1 EUR per X RUB. For example, if the value of EUR/RUB is 85.769, this much of Rubles are required to buy one Euro.

Spread

The price of buying is not the same as the price for selling. One must pay the ask price for buying and bid price for selling. And the difference between the bid price and the ask price is called the spread. This value varies based on the type of execution model used by the broker.

ECN: 42 pips | STP: 44 pips

Fees

Like in the stock market where you pay commission on both sides of your trade, in the forex market as well, you must pay few pips of fee for your trade. This could be between 5-10 pips. Note that the fee on STP accounts is nil.

Slippage

Due to the volatility in the market and the broker’s execution speed, there is a difference in the price at which you execute the trade and price, which is actually given by the broker. This is known as slippage.

Trading Range in EUR/RUB

The depiction of the minimum, average, and maximum volatility in the market for different timeframes is given in the below table. These values help us in assessing the risk of trade for a specified time frame.

Procedure to assess Pip Ranges

  1. Add the ATR indicator to your chart
  2. Set the period to 1
  3. Add a 200-period SMA to this indicator
  4. Shrink the chart so you can assess a large time period
  5. Select your desired timeframe
  6. Measure the floor level and set this value as the min
  7. Measure the level of the 200-period SMA and set this as the average
  8. Measure the peak levels and set this as Max.

EUR/RUB Cost as a Percent of the Trading Range

The cost of trade changes as the volatility of the market also changes. In the below tables, we have illustrated the cost variation in the trade-in different timeframes and volatilities for both ECN and STP model account.

ECN Model Account

Spread = 42 | Slippage = 3 |Trading fee = 3

Total cost = Slippage + Spread + Trading Fee = 3 + 42 + 3 = 48

STP Model Account

Spread = 44 | Slippage = 3 | Trading fee = 0

Total cost = Slippage + Spread + Trading Fee = 3 + 44 + 0 = 47

Trading the EUR/RUB

The EUR/RUB is one of the most traded exotic-cross currency pairs. The volatility in this pair is pretty high. However, a retail trader can still trade it.

Consider the above two volatility tables. We can see that the values are large in the min column and small in the max column. This means that the costs are more when the volatility is low, and less when the volatility is high.

Traders looking to trade with low cost can consider trading when the volatility is high. And traders who need low volatility will have to bear higher costs. There are traders who look for a balance between the two. Such traders can trade when the volatility of the market is around the average values. This will ensure enough volatility as well as low costs.

Another simple way to reduce cost is by placing orders using limit and stop instead of the market. This will take away the slippage on the trade. Hence, this will reduce the total cost of the trade. So, in our example, the total cost will reduce by three pips.

Categories
Forex Daily Topic Forex Risk Management

How to determine if your Trading System shows Dependency

How to determine Dependency in your Trading System

As we have explained in our previous article How to be sure your trading strategy is a winner, traders usually apply position size strategies that conform with the belief that future outcomes somehow are influenced by the previous result or results. This phenomenon, in statistical terms, is called dependency, which means the probability of the next event happening depends on the last or past events. 

The example of a card game such as Blackjack or Pocker, can enlighten this concept. In a deck of cards, the odds of getting a particular card, such an ace is dependent on the cards already on the table. So, the first time, with no card drawn, the probability of drawing an ace is 4/52. But the next time we draw a card, the probability changes to 4/51 or 3/51, depending on if an ace was drawn on the last time.

What does dependency mean to Trade

Having dependency on a trading system or strategy would mean that the odds of the next trade being profitable or unprofitable change with the outcome of the last trade. If we really could prove dependency and its kind, we could adapt our trade size accordingly, making the system more profitable than assuming non-dependency.

 As an example, if we devise a system on which a winning trade precludes another winner and a losing trade another loser, we could increase trade size while on a winning streak and decrease it on losing streaks. That way, we could maximize profits and minimize losses. 

How do we determine if a system shows dependency

Dependency on trading has two dimensions. The first dimension is dependency in terms of wins and losses, which is the sequence of wins and losses showing dependence. The second dimension is if the size of wins and losses also show dependency.

The run Test

On events such as drawing cards without replacement, it is evident that there is a dependency. But when we cannot determine if the sequence of results show dependence, we can perform a Run Test.

The run test is merely obtaining the Z-scores for the win and loss streaks of the results. A Z-score tells us how many deviations our data is away from the mean of a normal distribution. We are not going to discuss run tests here, as there is a simpler and more complete method to find out dependency. If interested in this subject, you can find multiple sources by googling the term.

Serial Correlation

Dependency can easily be measured, using a spreadsheet, since dependency is measurable using a CORREL() function between the trade results, and the same data shifted one place. This technique uses the linear correlation coefficient r called Pearson’s r, to quantify dependency relationships. 

As an example, I passed one trade system of mine I backtested some time ago to a through the correlation function CORREL. The system produced 55% winners with 1.7 reward-to-risk factor on the DAX30 Futures contract.

The following image shows the result on this system, with about 250 trades (only the first 30 shown)

Image 1 – Dependency test on a DAX System

If you click on the image, you can see the result is 0.0352, which means the test failed miserably for dependency. That means we should separate our entry decisions from the trade size. Trade size will be a function of the system’s drawdown and our appetite for risk, not a function of the last trade being a winner or a loser.

Another test in an old trade system I devised back in 2016 for the ES futures gave this result:

In this case, the correlation factor was 0.249. That is a relatively high positive correlation for a system. The figure implies that big willers aren’t usually followed by big losses, and also the vice versa: Big losses are seldom followed by big wins.  Using this system, we could improve the results if we increase our trade size after a win, and decrease the trade size after a loss.

A negative correlation can be as helpful as a positive correlation. For example, on a system with a negative correlation, we can expect large wins after a large loss, so it is wise to increase the trade size if that event occurs. Also, we can expect a large loss after a large win, so it is best to reduce the trade size before a large win.

To better determine dependency, Ralf Vince, on its book The Mathematics of Money Management, recommends splitting the total data of your system into two or more parts. First, determine if dependency exists in the first part of your data. If you detect it in that section, then check for dependency in the second section, and so on.  This will eliminate the cases where it seems to be dependency, but in fact, there is not.