Introduction
EUR/SGD is the abbreviation for the Euro area’s euro against the Singapore Dollar. This is one of the most traded exotic currency pairs in the world. In this pair, EUR is the base currency, and SGD is the quote currency.
Understanding EUR/SGD
The price of this pair represents the value of SGD, which is equal to one EUR. It is quoted as 1 EUR per X SGD. For example, if the value of this pair is 1.5552, then about 1.5 Singapore Dollars are required to purchase one euro.
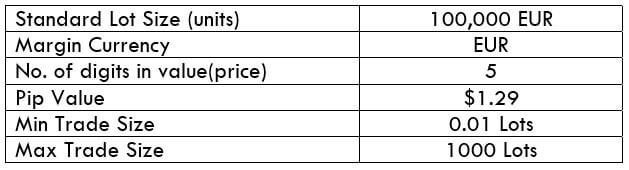
EUR/SGD Specification
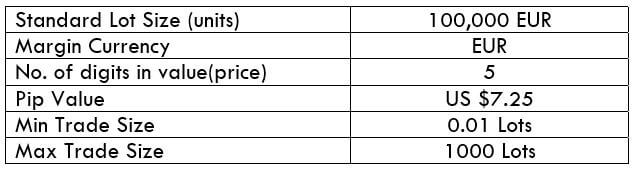
Spread
The spread is the difference between the bid and the ask price in the market. These two prices are set by the brokers. And it depends on the type of execution model used by the brokers.
Spread on ECN: 10 pips | Spread on STP: 11 pips
Fees
On ECN accounts, for every position you open, there is some fee involved with it. This is different for different brokers. However, on STP accounts, there is no fee as such.
Slippage
To put it in simple words, slippage is the difference between the trader’s demanded price and price given by the broker. The trader does not get his intended price due to two reasons – Broker’s execution speed & Market volatility
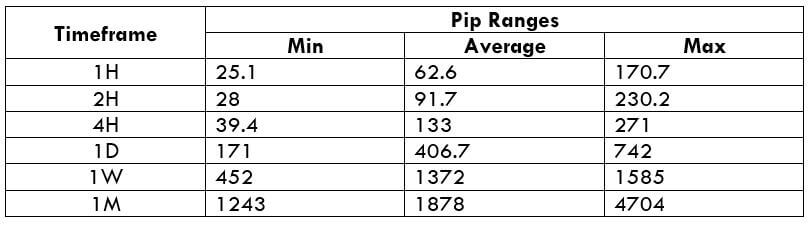
Trading Range in EUR/SGD
With the trading range table, we can assess our gain/loss on a trade in a given timeframe even before we open positions for it. This is done by considering the past volatility of the market.
Now, to determine the profit/loss on a trade, all you must do is, multiply the volatility value with the pip value ($7.25).
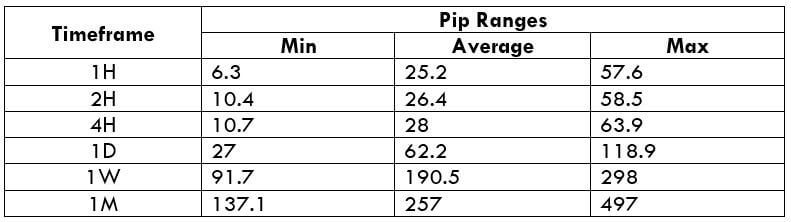
Procedure to assess Pip Ranges
- Add the ATR indicator to your chart
- Set the period to 1
- Add a 200-period SMA to this indicator
- Shrink the chart so you can assess a large time period
- Select your desired timeframe
- Measure the floor level and set this value as the min
- Measure the level of the 200-period SMA and set this as the average
- Measure the peak levels and set this as Max.
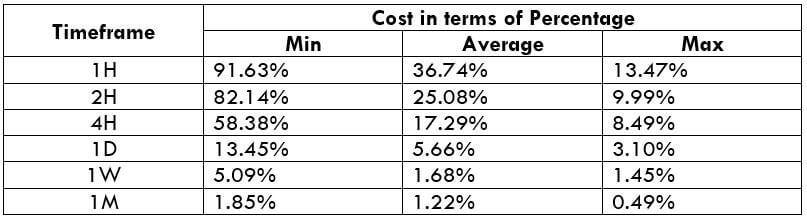
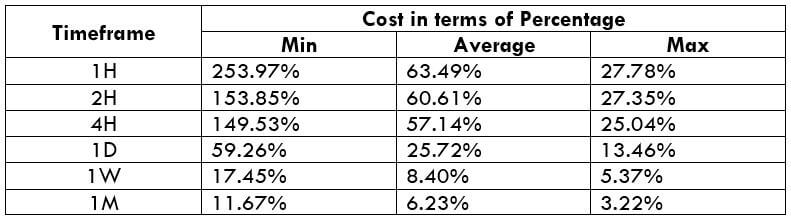
EUR/SGD Cost as a Percent of the Trading Range
This is an excellent application to the above volatility table. By considering the pip movement values, we can determine the cost variation of a trade as well. To do so, we find the ratio between the total cost and volatility value and convert it into percentages. Below are the cost variations for ECN and STP accounts models.
ECN Model Account
Spread = 10 | Slippage = 3 | Trading fee = 3
Total cost = Slippage + Spread + Trading Fee = 3 + 10 + 3
Total cost = 16
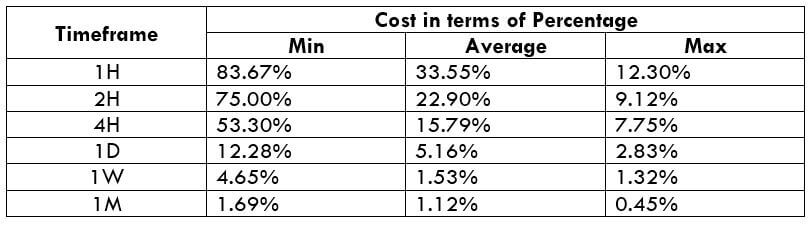
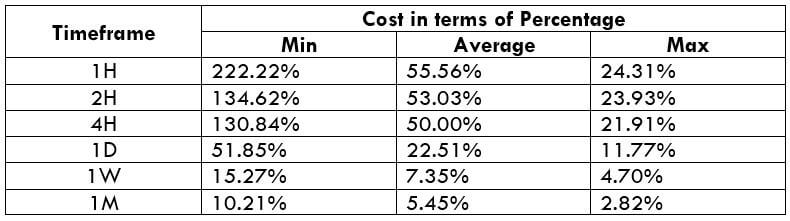
STP Model Account
Spread = 11 | Slippage = 3 | Trading fee = 0
Total cost = Slippage + Spread + Trading Fee = 3 + 11 + 0
Total cost = 14
The Ideal way to trade the EUR/SGD
Comprehending the costs : Large/Small percentage -> High/Low costs
From the above the tables and the implications, we can conclude that costs are high when the volatility of the low and high when the volatility is low. And when it comes to the ideal way to trade this pair, conservative traders may trade it during those times when the volatility values are at or above the average values. This will ensure enough volatility as well as affordable costs. And other aggressive traders may trade during any of the extremes.
Also, traders can reduce their total costs by trading using limit orders and stop orders. Unlike the market orders, limit and stop orders do not include slippage on the trade. Hence, this will reduce costs considerably.