Categories
Forex Assets

Examining The Volatility Of CHF/TRY Forex Exotic Pair

Introduction

The abbreviation of CHF/TRY is Swiss Franc, paired with the Turkish Lira. In this pair, CHF is the official currency of Switzerland and is also the fifth highly traded currency in the Forex Exchange market. In contrast, TRY stands for the Turkish Lira, and it is the official currency of Turkey. This pair is classified as an exotic pair.

Understanding CHF/TRY

In the Foreign exchange market, to determine the relative value of one currency, we need an alternative currency to evaluate. Hence, when we are buying a currency (base) we are simultaneously selling one (the quote currency). The market value of CHF/TRY helps us to understand the power of TRY against the CHF. So, if the trade rate for the pair CHF/TRY is 7.1972, it means to buy 1 CHF, we need 7.1972 TRY.

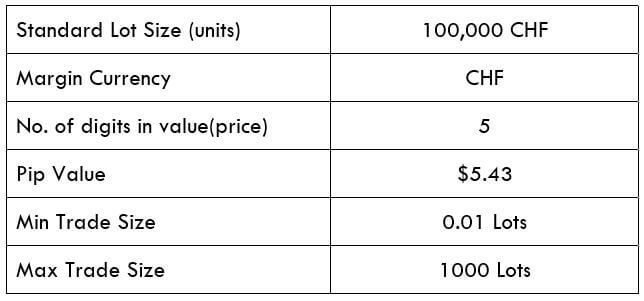
CHF/TRY Specification

Spread

Spread is the distinction between the ask-bit price that is set at the exchanges. Below are the spread values of the CHF/TRY currency pair in both ECN & STP accounts. The spread charges for ECN and STP brokers for the CHF/TRY pair can be found below.

ECN: 35 pips | STP: 40 pips

Fees

For every position, a trader enters the stockbroker charges some fee for it. Traders must know that this fee is charged only on ECN accounts and not on STP accounts.

Slippage

Slippage is the price difference between the trader’s execution and at which the broker executed the price. The difference is because of the high market volatility and slow execution speed.

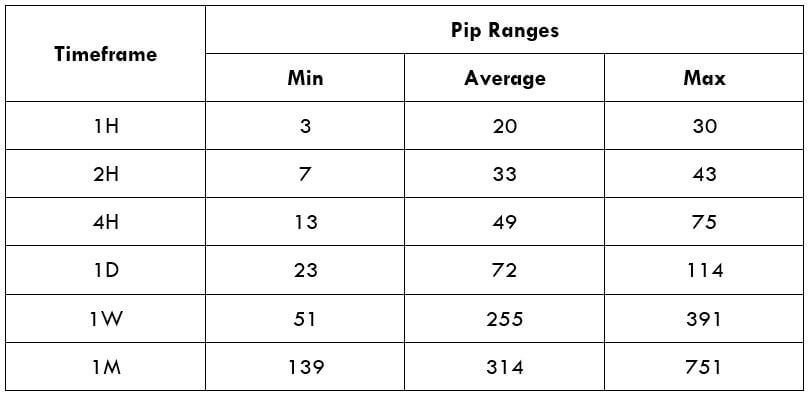
Trading Range in CHF/TRY

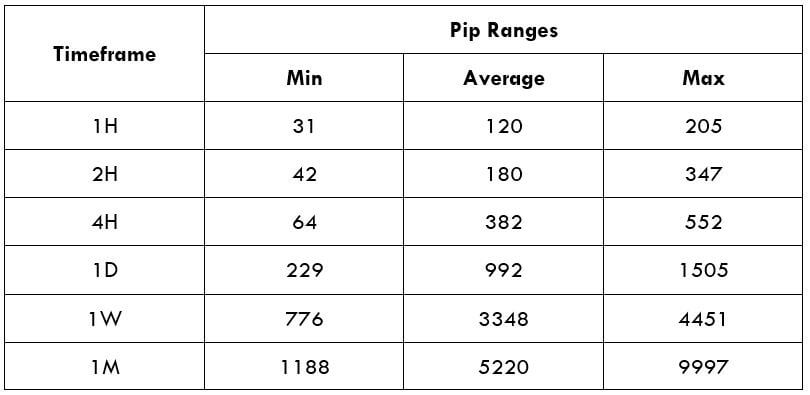
A trading range is the interpretation of the volatility in CHF/TRY in several timeframes. The values are obtained from the Average True Range indicator. One can use the table as a risk management tool to identify the profit/loss that a trader is possessed.

Below is a table indicating the minimum, average, and max volatility (pip movement) on various timeframes.

Procedure to assess Pip Ranges

  1. Add the ATR indicator to your chart
  2. Set the period to 1
  3. Add a 200-period SMA to this indicator
  4. Shrink the chart so you can assess a large time period
  5. Select your desired timeframe
  6. Measure the floor level and set this value as the min
  7. Measure the level of the 200-period SMA and set this as the average
  8. Measure the peak levels and set this as Max.

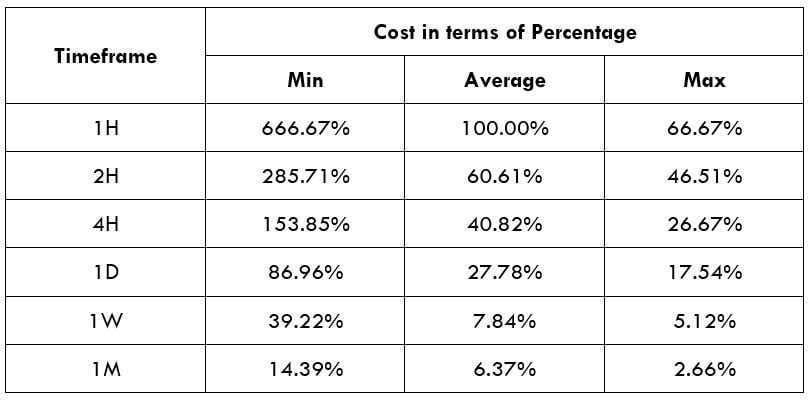
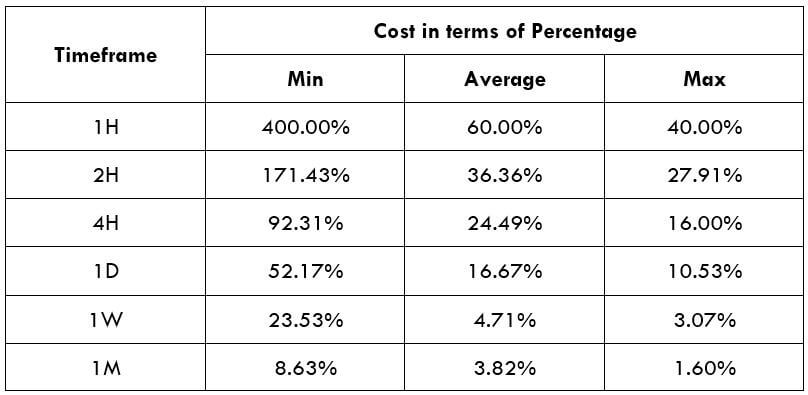
CHF/TRY Cost as a Percent of the Trading Range

The total cost of the trade fluctuates based on the volatility of the market. So, we must figure out the occasions when the costs are less to place ourselves in the market. Below is a table demonstrating the variant in the costs based on the change in the volatility of the market.

Note: The percentage rates represent the relative scale of costs and not the fixed costs on the trade.
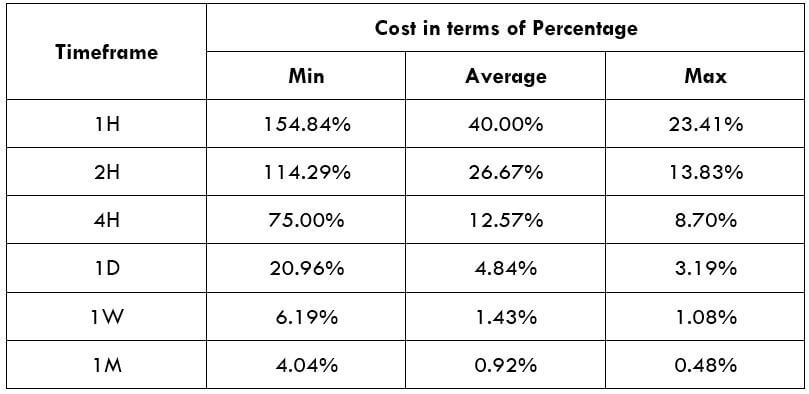
ECN Model Account

Spread = 35 | Slippage = 5 | Trading fee = 8

Total cost = Slippage + Spread + Trading Fee = 5 + 35 + 8= 48
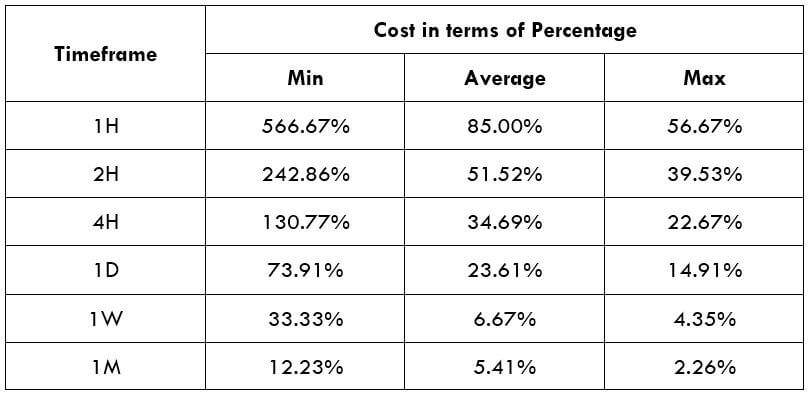
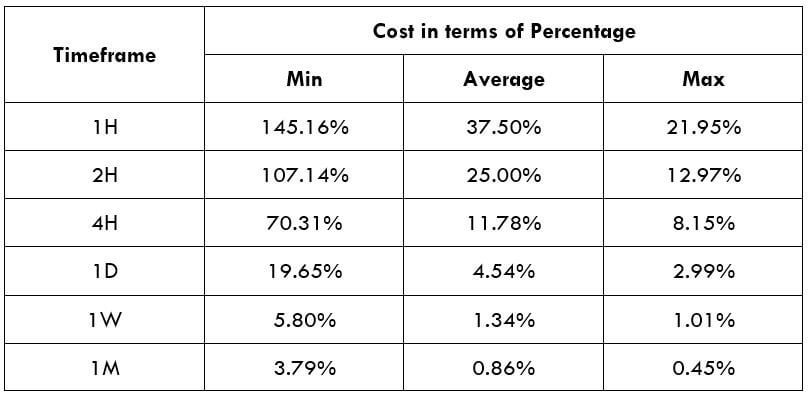
STP Model Account

Spread = 40 | Slippage = 5 | Trading fee = 0

Total cost = Slippage + Spread + Trading Fee = 5 + 40 + 0 = 45

The Ideal way to trade the CHF/TRY

Volatility and cost are the two components traders take into consideration for trading any security in the market. With the assistance of the above tables, let us evaluate these two factors to trade the CHF/TRY Forex pair.

As we can see, the pip variation is significantly high between the minimum volatility and the average volatility in each timeframe. As a day trader, our aim is to make income from the market’s pip movement. But, if there is hardly any movement in the price, it becomes tricky to make profits from the market. Thus, it is ideal to trade when the volatility is at the average value.

The cost of trade rises as the volatility decrease. They are inversely proportional. In other words, highly volatile markets have minimum costs. Though it is quite risky to trade markets with higher volatility, it can be considered by aggressive traders with optimal money management techniques in place as the costs are low. Hence, to retain a balance among the cost and volatility, traders may find trading occasions when the volatility is near the average values or a little above it.

Categories
Forex Assets

Analyzing The Costs Involved While Trading The ‘CHF/BGN’ Exotic Pair

Introduction

CHF/BGN is the abbreviation for the Swiss Franc and the Bulgarian Lev exotic pair. Here, CHF is the base currency, while BGN is the quote currency. The pair as a whole explains the number of units of the quote currency (BGN) that is required to buy a single unit of the base currency (CHF). BGN stands for The Bulgarian Lev, and it is the official currency of Bulgaria.

Understanding CHF/BGN

In the Forex market, we always purchase the base currency while selling the quote currency and vice versa. Here, the market value of CHF/BGN helps us to comprehend the potential of BGN against the CHF. So if the exchange rate of the pair CHF/BGN is 1.8384, it means to buy1 CHF we need 1.8391 BGN.

CHF/BGN Specification

Spread

Spread in exchange is the distinction between the bid-ask price proposed by the broker. It is quantified in terms of pips and fluctuates on the type of account and kind of broker. Below is the spread for the CHF/BGN pair in both ECN & STP accounts.

Spread on ECN: 7 | STP: 12

Fees

Fees are the commission charged by the broker for each trade a trader takes. The fee varies on both types of accounts and brokers. For our analysis, we have maintained the fee flat at five pips.

Slippage

A trader will not get the price that he demands, due to the volatility in the market. The original price varies from the asked price. The difference is termed as slippage. For instance, if a trader performs a trade at 1.8384, the actual price received would be 1.8391. The difference between the two pips is called slippage.

Trading Range in CHF/BGN

The trading range is a tabular interpretation of the min, average, and maximum pip movement in a specific timeframe. Obtaining understanding about this is essential because it helps manage risk and determine the appropriate times of the day to enter-exit a trade with minor costs.

Below is a table representing the minimum, average, and maximum pip movement (volatility) in various timeframes.

Procedure to assess Pip Ranges

  1. Add the ATR indicator to your chart
  2. Set the period to 1
  3. Add a 200-period SMA to this indicator
  4. Shrink the chart so you can assess a large time period
  5. Select your desired timeframe
  6. Measure the floor level and set this value as the min
  7. Measure the level of the 200-period SMA and set this as the average
  8. Measure the peak levels and set this as Max.

CHFBGN Cost as a Percent of the Trading Range

The above table illustrates the number of pips the currency pair move in the various timeframe. We will apply these values to identify the cost ratio when the volatility is minimum, average, and maximum. The cost percentage will then help us sort the ideal time of the day to enter the trades.

The understanding of the cost percentage is straightforward. If the percentage is elevated, then the cost is high in that specific timeframe and range. If the percentage is low, then the cost is comparatively low for that timeframe and range. The total cost on every trade is calculated by adding up the spread, slippage, and trading fee.

ECN Model Account

Spread = 7 | Slippage = 5 | Trading fee = 8

Total cost = Slippage + Spread + Trading Fee  = 5 + 7 + 8 = 20

STP Model Account

Spread = 12 | Slippage = 5 | Trading fee = 0

Total cost = Slippage + Spread + Trading Fee  = 5 + 12 + 0 = 17

The Ideal way to trade the CHF/BGN

It is not recommended to enter and exit the trade at any time of the day. To manage their trade, a trader must consider various timeframes during the day to reduce both risk and cost of the trade. This is made possible by understanding the above two tables.

In the minimum column, the percentages are generally high. This means the cost is very high when the volatility of the market is low. For example, on the 1H timeframe, when the volatility is three pips, the cost percentage is 666%. This means that one must accept high costs if they enter or exit trades when the volatility is around three pips. Preferably, it is advised to trade when the market’s volatility is above the average.

Additionally, it is considerably better if one trades placing the limit orders instead of market orders, as it invalidates the slippage on the trade. In doing so, the costs of each trade will reduce by approximately 40%.

STP Model Account (Using Limit Orders)

Spread = 12 | Slippage = 0 | Trading fee = 0

Total cost = Slippage + Spread + Trading Fee = 0 + 12 + 0 = 12