Categories
Forex Indicators

The True Benefits of the ATR Indicator

Instead of using your own judgment, some statistical measures of price volatility are available. One of the most popular is the ATR indicator (Average True Range), which measures the average movement for a given exchange torque ( or action, raw material, etc.) for a given period.

What Is the ATR Indicator?

The ATR indicator moves down and up as the price of an asset becomes larger or smaller. This indicator is based on price developments, so the reading is in dollars. For example, in share trading, a reading of 0.23 of the ATR means the price ranges from $0.23 on each price bar. In the currency market, the ATR will show you pips, then 0.0025 is the same as 25 pips.

A new reading of the ATR indicator is calculated as each period passes. On a one-minute graph, a new ATR reading is calculated every minute. In a daily graph, a new ATR reading is calculated every day. All these readings are plotted as a line continues, so traders can see how the volatility has changed as time goes on.

Since the ATR is based on how much an asset moves, the reading of an asset is not comparable with other isolation assets. To better understand the indicator, here is how we calculated it.

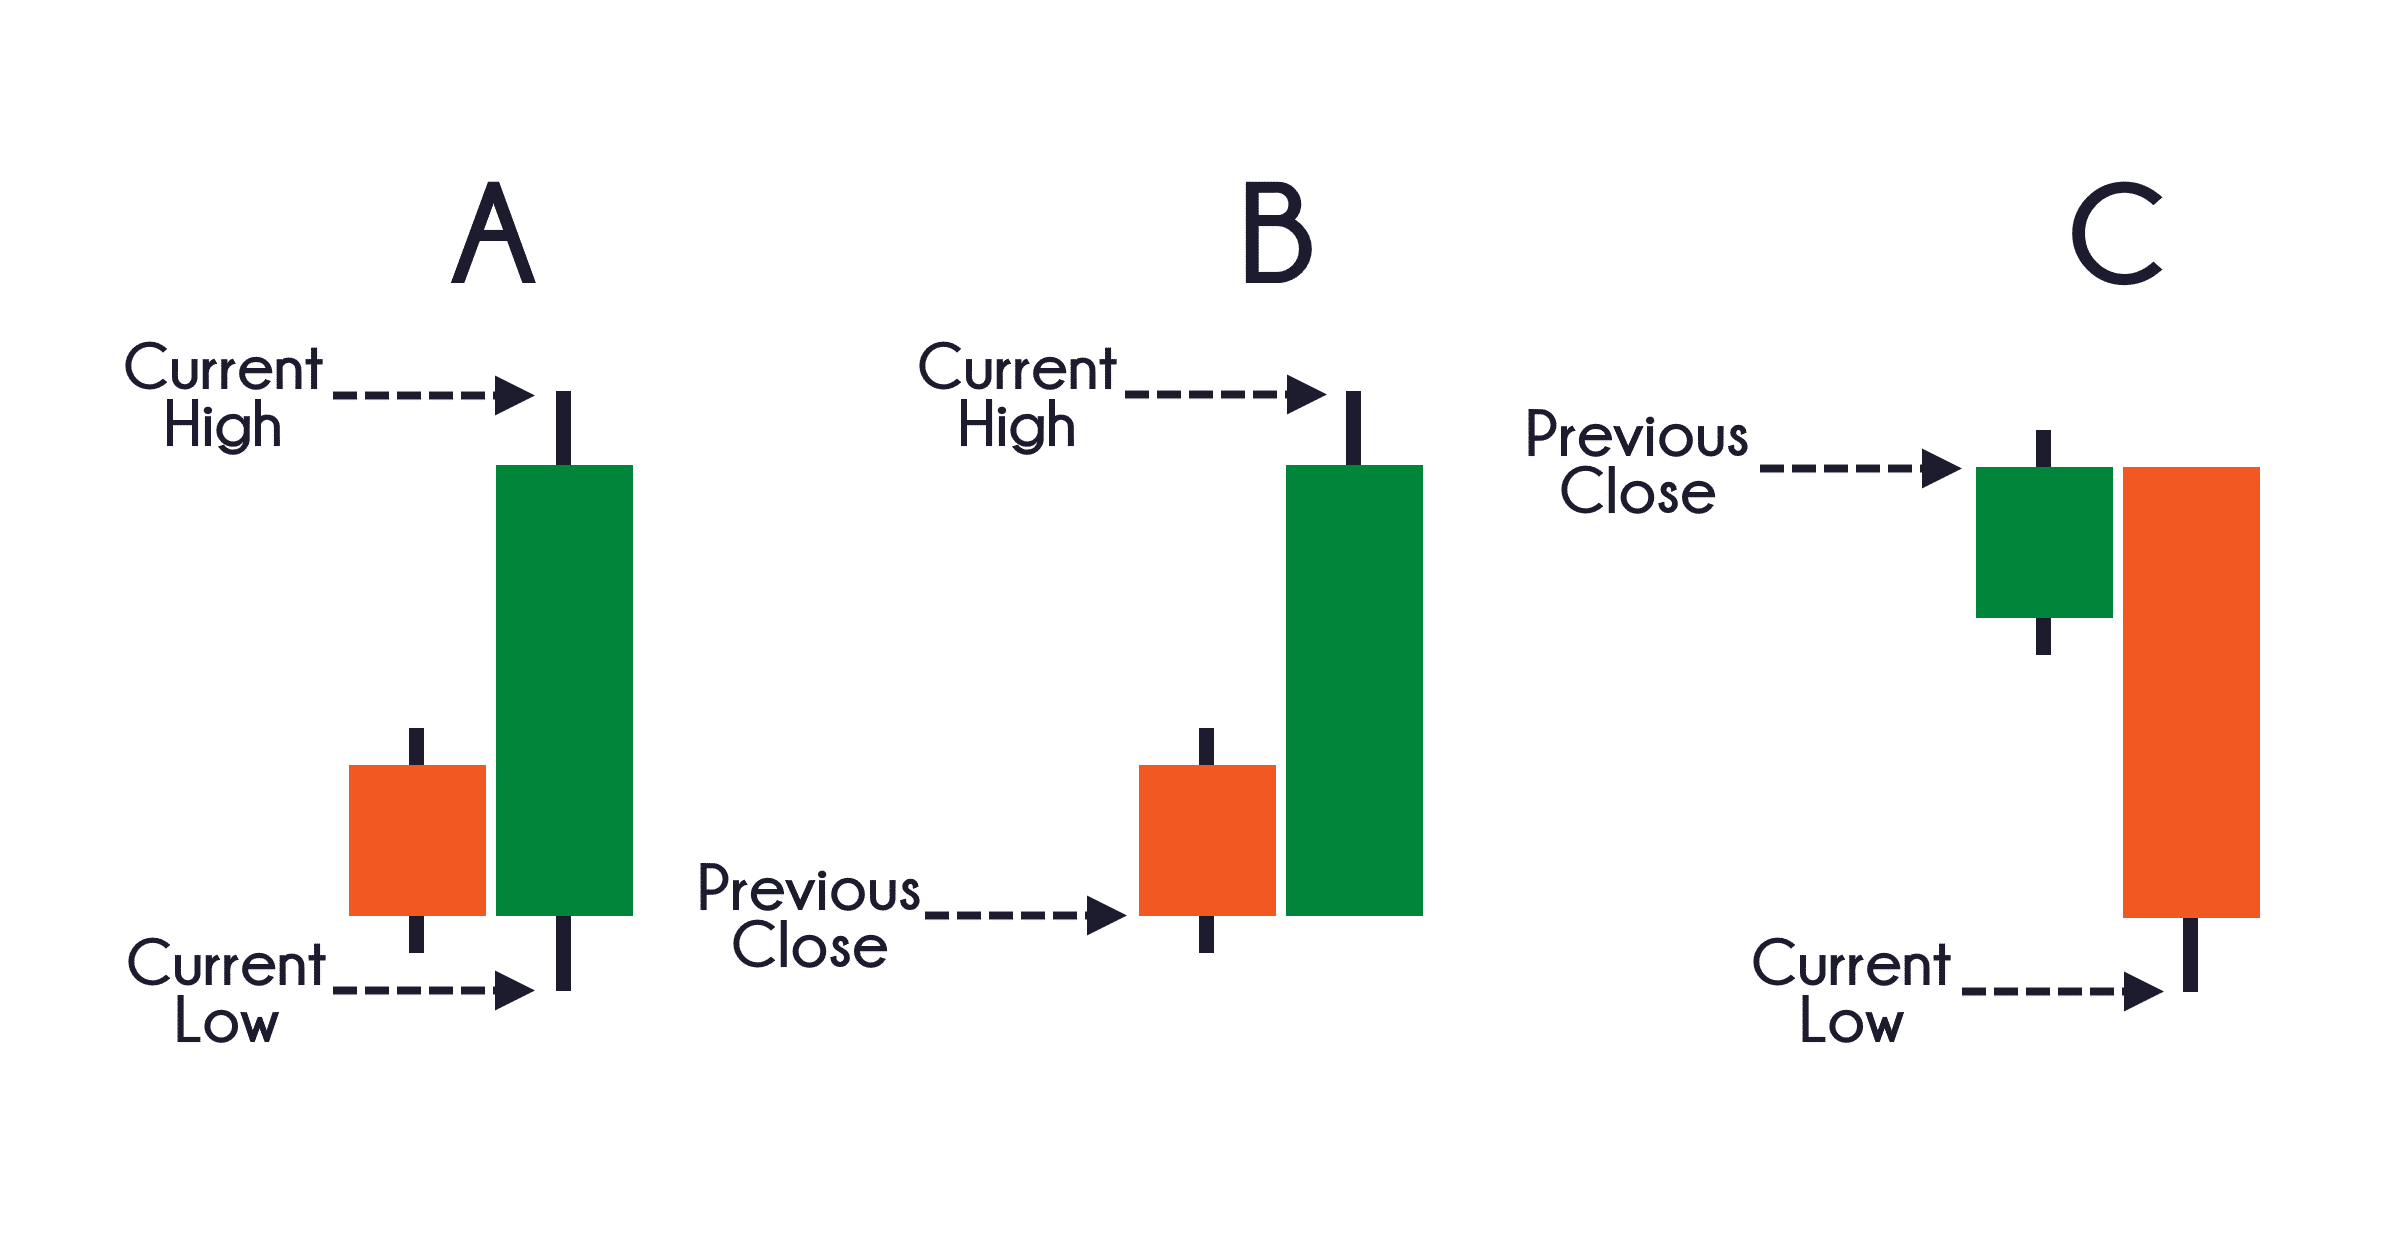
Finding the A, or average first requires finding the true range (True Range TR).

The TR is the largest of the following:

  • The current maximum less previous closure
  • Current minimum minus previous closure
  • Current maximum minus the current minimum

Whether the number is positive or negative, it doesn’t matter. The highest absolute value is the one used in the calculation.

The values are recorded every day, and then you get an average. If the ATR is averaged over the previous 14 periods, then the formula is as follows:

ATR = [( ATR Previous x 13) [ TR Current] / 14

Continue reading about the ATR or start playing a little with a risk-free demo account and see for yourself how the ATR indicator works in real-time.

Setting the ATR Indicator

Typically, the default parameter is 14 periods, that is, 14 days on the daily graph, 14 hours on the hour graph, and so on, but as time goes on you want to experiment with the parameters. Knowing the ATR for a certain period, traders can choose to place a stop loss at a certain percentage of that range, based on the entry point. Let’s take an example, traders with confidence in the trend direction who want to prevent their stop loss from being reached would place the stop loss at 80 or 100 percent of the ATR away from the entry point near strong support. They will accept the long loss if that stop is reached because they believe that the probability of that happening is slim.

Traders with lower confidence and greater risk aversion that they want less loss (even if there are more of them because the stop is reached) can place their stop closer, perhaps 50 percent or less from the ATR indicator outside the point of entry. When you know the usual volatility for a given period of time through ATR, you have a better idea of how far you want your stop loss fixed or dynamic to prevent a random movement from reaching it.

Let’s use an example of how to use the ATR indicator to measure volatility and place a fixed or dynamic stop loss command.

Measuring Volatility

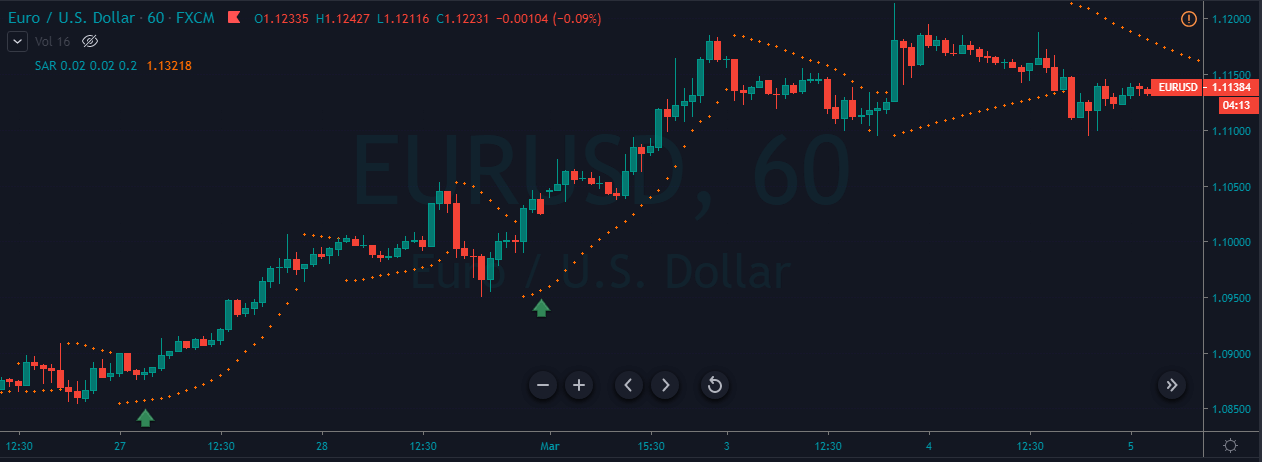
We refer to the example above. In the figure below, we show the same daily graph EURUSD showing the daily candles for the transaction’s entry date on August 11, but this time we include the ATR, which shows that for the past 14 days or candles daily, The average price range was around 210 pips. Those interested in how the ATR is calculated can view it online.

However, if we wanted to decrease the chances of reaching a stop loss in exchange for a risk of further loss if the transaction turned against us, we could have established the stop loss at a distance of 50 percent or more from the ATR, 105 pips, below the point of entry or some different percentage of the ATR.

The point here is that there are two different ways to determine how far you are going to establish your stop loss. In this example of fórex trading, we use the most recent minimums as a guide while we could have used the ATR. Much depends on factors such as your appetite for risk, market conditions, and confidence in the transaction. For example, if you caught a retraction to strong support in a strong general trend, you may be more confident that that upward trend will return and allow a wider stop loss to prevent it from being triggered by random price movements. When you have less confidence, you can keep the stops tighter.

Setting an ATR Indicator in MetaTrader 4/5

This section shows how to configure the ATR indicator in MT5. Assume that you have opened a graph.

Adds an ATR indicator and sets the parameter for this indicator:

  • Click on Insert and move your mouse over Indicators and Trend
  • Click ATR indicator
  • Configuring the common parameters

After you have completed the above step, the settings menu appears. Most indicators can be controlled by many common parameters.

There are two types of parameters:

  1. Indicator calculations: e.g. the number of periods used by the ATR indicator (you don’t need to worry about this much in the beginning)
  2. Display of an indicator: e.g. How will it look? The thickness and colour of the lines, etc.

To change the indicator settings directly on the graph a while later: Right-click on the ATR indicator (you will have to be very exact on the indicator line to see the menu below)

Choose the ATR Properties: The menu parameter appears again where you can change the indicator.

To delete the ATR indicator: Right-click on the indicator you want to delete (you will have to be very exact on the indicator line to get the menu below). Click ‘Delete Indicator’ and the indicator will disappear from your chart.

Final Words

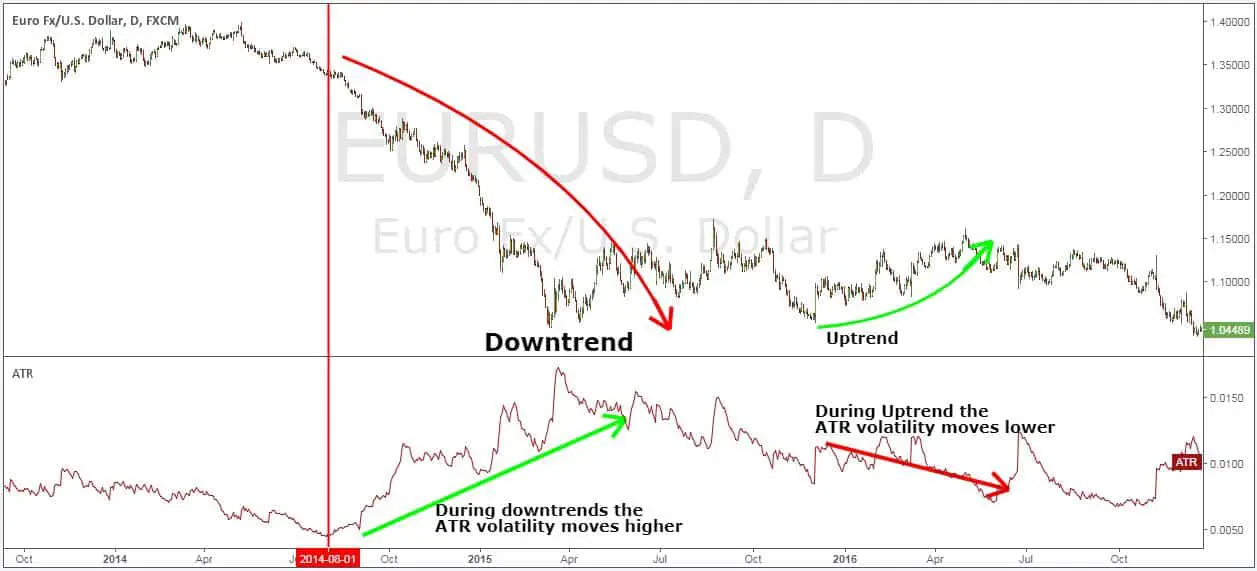
The ATR indicator is not directional like the MACD or RSI, rather as a unique indicator of volatility that reflects the degree of interest or disinterest in a movement. Strong movements, in either direction, are usually accompanied by long ranges, or long and true ranges. This is really true at the beginning of a movement. Not-so-inspiring movements can be accompanied by relatively narrow ranks. As such, the ATR can be used to validate the enthusiasm behind a movement or a rupture. An upward reversal with an increase in ATR would show a strong buying pressure and the reinforcement of a reversal. A break in bearish support with an increase in the ATR would show strong downward pressure on sales and reinforce the break-up of the support.

Understanding how to read the ATR indicator is important, but if you want some help, Metatrader offers a very useful indicator toolkit. Play a little on a demo fórex account and see for yourself how the ATR indicator can give you a lot of money.

Categories
Forex Fundamental Analysis

GBP/CHF Global Macro Analysis – Part 3

GBP/CHF Exogenous Analysis

  1. The UK and Switzerland Current Account Differential

A country’s current account shows the sum of its net exports, net secondary income, and net primary income. In this case, the current account differential is the difference between the UK’s current account balance and Switzerland.

In international trade, when a country has a current account surplus, it means the value of its exports is higher than imports. Thus, its domestic currency is in higher demand in the forex market. Therefore, if the current account differential is positive, it implies that the UK has a higher current account than Switzerland. We can then expect that the price of the GBP/CHF pair will increase. Conversely, a negative differential would mean that Switzerland has a higher current account than the UK. In this case, the price of the GBP/CHF pair is expected to drop.

Switzerland had a current account surplus of $10.11 billion in the third quarter of 2020, while the UK had a $20.97 billion deficit. The current account differential is -$31.08 billion. Hence a score of -7.

  1. The interest rate differential between the UK and Switzerland

Interest rate differential is the swiss interest rate subtracted from the interest rate in the UK. Forex carry traders use a pair’s interest rate differential to establish whether to buy or short the pair. For GBP/CHF, if the interest rate differential is positive, it means that the UK’s interest rate is higher than in Switzerland. This makes traders and investors go long on the pair; hence, a bullish trend.

Conversely, if the interest rate differential is negative, it means that Switzerland’s interest rate is higher than in the UK. Thus, forex traders will short the GBP/CHF pair; hence, a bearish trend.

The Swiss National Bank has maintained the interest rate at -0.75%, while the UK’s interest rate is 0.1%. Therefore, the GBP/CHF interest rate differential is 0.85%. It has a score of 3.

  1. The differential in GDP growth rate between the UK and Switzerland

GDP growth rate differential is the difference between the economic growth in the UK and Switzerland. A negative differential means that the UK’s economy is expanding faster than that of Switzerland. Consequently, the GBP/CHF pair will adopt a bullish trend. Conversely, if the GDP growth rate differential is negative, the swiss economy is growing faster than that of the UK. Hence, the GBP/CHF pair will adopt a bearish trend.

The UK economy has contracted by 5.8% in the first three quarters of 2020, while the swiss economy has contracted by 1.5%. That means the GDP growth rate differential is -4.3%. We assign a score of -3.

Conclusion

Indicator Score Total State Comment
The UK and Switzerland Current Account Differential -7 10 A differential of – $31.08 Switzerland has a $10.11 billion current account surplus, while the UK has a deficit of $20.97 billion
The interest rate differential between the UK and Switzerland 3 10 0.85% The differential is expected to remain at 0.85% all through 2021
The differential in GDP growth rate between the UK and Switzerland -3 10 -4.30% Switzerland’s economy contracted by 1.5% in the first three quarters of 2020 while the UK by 5.8%
TOTAL SCORE -7

The exogenous analysis of the GBP/CHF pair has a cumulative score of -7. Thus, we can expect a short-term downtrend in the pair.

In technical analysis, GBP/CHF’s weekly price is seen bouncing off from the upper Bollinger band.

We hope you find this analysis informative. Let us know if you have any questions in the comments below. Cheers.

Categories
Forex Indicators

Top 5 Forex Trend Indicators for New and Experienced Traders

There are thousands of indicators out there. In fact, there are so many that it is impossible to look at them all. What you may find when going through them is that a lot of them are actually different variations of a few different major indicators, with the creator having simply made a few small changes here and there. The underlying principle and method behind the indicators are fundamentally the same, in fact, for most of them, you would not actually see much difference at all.

So we are going to be looking at some of the more widely used trend-based indicators that are out there. You most likely will have heard of some of them or even used a variation of one yourself. Let’s take a look at what these major and popular trend indicators are.

Price Action

This is probably the one that most people would have heard of. In fact, some people who know nothing about Forex or trading may well have heard of this one too. When it comes to trading, price is the number one variable that we will be looking at and it is one that dictates the majority of moves within the markets. So getting a good understanding of what price action does and how the trends work is often the first thing that people set out to learn.

There are multiple different ways to look at price action. There are higher highs or lower lows and it is something that every trader should understand. We are not going to be going into detail here on how you actually analyse it, but there are hundreds of indicators out there that you are able to add onto your charts which give a fantastic overview of the current price action that is going on within the markets. The current price can tell you a lot about the current trends. The good thing about some of the price action indicators is that they also include trend lines, making it far easier to see where the current price sits within the current trend, a valuable tool for any trader or any experience level.

Moving Averages

One of the most used indicators when it comes to trading forex would have to be the moving average indicator. It is used to help identify the trends within the markets. There are multiple different forms of moving averages but they all follow the same ideas and aim to plot the average prices of a currency over a specific period of time over the price itself.

What the indicator suggests is that if the current price is above or below the current average price. It should indicate whether the markets are currently bullish or bearish. You are also able to work out the possible strength of a trend by looking at the steepness of the moving average slope. The steeper that the slope is, the stronger the trend would be. More often than not, you would use a long term in a short term moving average at the same time to help confirm any possible bullish or bearish movements.

The moving averages indicators are often used in conjunction with other indicators to help set up trades for specific strategies. Even if you do not use it for your trading, having a general idea of the current trend and where that trend sits above the average price can be invaluable to your trading, including both entry and exit positions.

The Parabolic SAR

Parabolic SAR, which stands for Stop and Reverse, is a great indicator that a lot of people use. The way it works is by identifying the short term trends within the markets. It will simply place dots on the charts which will be either above or below the high or the low in the price.

It works by using a number of different variables to help calculate its values. It uses things like acceleration factor and extreme price to do this. It is extremely useful when looking at the short term trends and the changes that are happening within these trends. It can be used to help with both entry and exits of trades as it is good at showing where the reversal could happen. It should also be used multiple times to enable for better correlation and confirmations of the short term trends and the changes that could be taking place.

The MACD

Also known as Moving Average Convergence, divergence, it is an oscillator which means that it will usually measure variables and changes in things like momentum and volatility. The MACD indicator is slightly different though because it also acts as a trend indicator, as well as calculating the momentum in the price of a currency.

The MACD indicator includes a histogram which will oscillate around the 0-level. The fast and slow lines are known as the MACD line and the signal line. The indicator gets its values from the exponential moving average indicator with a setting of 12 and 26 periods. The trends that are shown in the price charts are validated by using a combination of variables in the MACD indicator. MACD is widely used and there are a lot of indicators and expert advisors out there that have implemented it into their strategies and into their indicators, so you do not need to look far to see MACD being mentioned.

Ichimoku Cloud

This indicator is also known as Ichimoku Kinko Hyo, is a pretty unique one as it is a trending system within itself, not needing any additional input. It was developed to work as a trend following indicator which has a large number of variables included in it for customisation and adaptations.

The cloud within the indicator is often seen as the support and resistance level areas within the markets. The Chikou, Kijun-sen and Trinjensen measure the 9-period and 26-period levels on the charts. The Ichimoku Cloud indicator is fast becoming one of the most used trend indicators and is now getting used more and more by new and experienced traders. On first impression, it can look a little daunting due to the vast numbers of options and variables available, however, during a time of sustained trend in the markets, the indicator is able to give very good and very accurate results, which is why it is now so highly used.

So those are some of the most popular trend indicators that are being used right now. Which one you should use is entirely up to you. Some match and combine with certain strategies while some do not, some are far simpler than others, but the decision of which to use will need to be based on what will work best with your current strategy. All we know is that they are all incredibly helpful and potentially powerful tools that you can add to your trading arsenal.

Categories
Forex Course

88. Trading The Forex Market Using The Amazing ‘Parabolic SAR’ Indicator

Introduction

Parabolic SAR is a trend following indicator that was developed by ‘Welles Welder.’ The SAR in the name stands for the ‘Stop and Reverse.’ Welder introduced this indicator in his 1978 book “New Concepts in Technical Trading System.” In this book, he also introduced many of the revolutionary indicators like RSI, ATR, and Directional Movement Concept.

As the trend of the currency pair extends over time, this indicator trails the price action. If the indicator is below the price action, it means that the price of the currency is rising, and when it goes above the price, it indicates that the market is in a downtrend. In this regard, the Parabolic SAR stops and reverses when the trend of the instrument changes its direction.

During the volatile market, the gap between the price action and the indicator widens. In a choppy or consolidation market, the indicator interacts with the price quite frequently. Most of the technical indicators represent the overbought and oversold market conditions, whereas the Parabolic SAR visually provides us an insight on where to exit our position.

Parabolic SAR – Trading Strategy

The basic strategy while trading with this indicator is to go long when the dots move below the candlestick and go short when the dots go above the candlestick. It is advisable to use this way only in a strong trending market. If the trend is choppy or if the price action is continuously being pulled back, this indicator will continuously give us the buy-sell signal. All of these trading signals won’t be genuine and can produce many losses if we trade all of those signals generated.

As we can see in the below EUR/NZD price chart, the market was in an uptrend. But the momentum of the buying trend was quite weak. That’s the reason why this pair gives a lot of buying and selling opportunities in this pair. If we trade every opportunity, we will end up on the losing side. This is the reason always we must always find the pair which is in a strong uptrend or downtrend.

Buy Example

First of all, find a currency pair that is in a strong uptrend. While the price is in an uptrend wait for the indicator to go below the price action when the price pulls back. If this happens, we can take buy entry. We can expect a ~ 50+ pip movement if the market is trending. Place the stop-loss just below the dots of the Parabolic SAR.

As we can see in the above image of the EUR/USD Forex pair, the market was in a strong uptrend. We have identified two trading opportunities, and both the trades gave us 150+ pip profit. One crucial thing to remember is, in an uptrend, only go for the buying trades and ignore all the sell signals. Place the stop-loss just below the parabolic dots and book the profit when the market gives an opposite signal.

Sell Example

For identifying sell opportunities, we must first find out a strong downtrend. When the indicator goes above the price action, we can activate our sell trades.

In the below chart, we have identified a couple of selling opportunities in the EUR/USD Forex pair. We can see that each trade travels a significant amount of time before we see the next trading opportunity. This is because the sellers were super strong. Parabolic SAR provides amazing trading opportunities in strong trending markets only. This is the only way to use this indicator for buying and selling.

That’s about the Parabolic SAR indicator and how to use it to trade the markets. This indicator can be combined with others to find the accuracy of the trading signals generated. Try using this indicator and let us know if you have any questions in the comments below. Cheers.

[wp_quiz id=”67826″]