Categories
Forex Assets

Analyzing The GBP/TWD Forex Currency Pair

Introduction to GBP/TWD

GBP stands for British pound sterling, and it is typically known as Pound. It is the official currency of the United Kingdom and some other countries like Jersey, South Georgia, and Guernsey. The pound is also the 4th most traded currency in the foreign exchange after USD, EUR & YEN. Whereas TWD is the abbreviation of The New Taiwan dollar. The central bank of Taiwan issues this currency.

GBP/TWD

Currency pairs are the national currencies from two countries coupled for being exchanged in reference to each other. In the Forex market, one currency is always quoted against the other. GBP/TWD is the abbreviation for the Pound sterling against the New Taiwan dollar. In this case, the first currency(GBP) is the base currency, and the second(TWD) is the quote currency.

Understanding GBP/TWD

In Forex, to find out the relative value of one currency, we need another currency to compare. If the value of the base currency goes down, the value of the quote currency goes up and vice versa. The market value of GBP/TWD determines the strength of TWD against the GBP. This can be easily understood as 1GBP is equal to how much of TWD. So if the exchange rate for the pair GBP/TWD is 37.093, it means we need 37.093 TWD to buy 1 GBP.

Spread

Forex brokers have two different prices for currency pairs: the bid and ask price. The bid price is the selling price, and ask is the buy price. The difference between the ask and the bid price is called the spread. Spread is basically a type of commission by which brokers make their money. Below are the ECN and STP for the pair GBP/TWD.

ECN: 49 pips | STP: 52 pips

Fees

Each time we place a trade, we need to pay some commission on it. A Fee is simply that commission we pay to the broker for opening a particular position. The fee also varies from the type of broker we use; for example, there is no fee on STP account models, but a few pips on ECN accounts.

Slippage

Slippage refers to the difference between the trader’s expected price and the actual price at which the trade is executed. It can occur at any time but mostly happens when the market is fast-moving and volatile. Also, sometimes when we place a large number of orders at the same time.
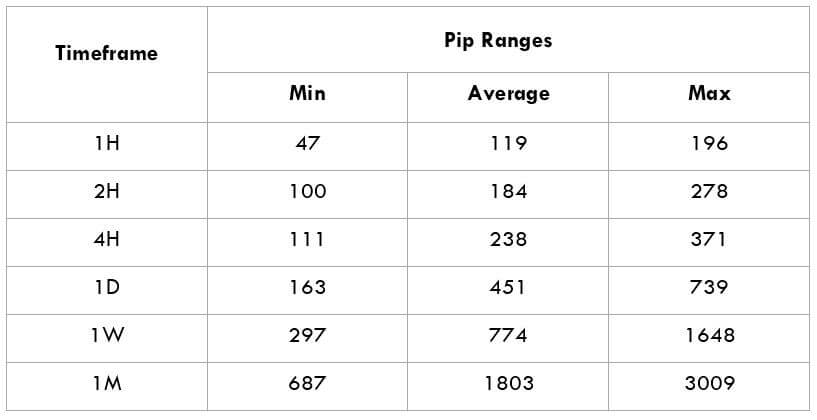
Ranges in GBP/TWD

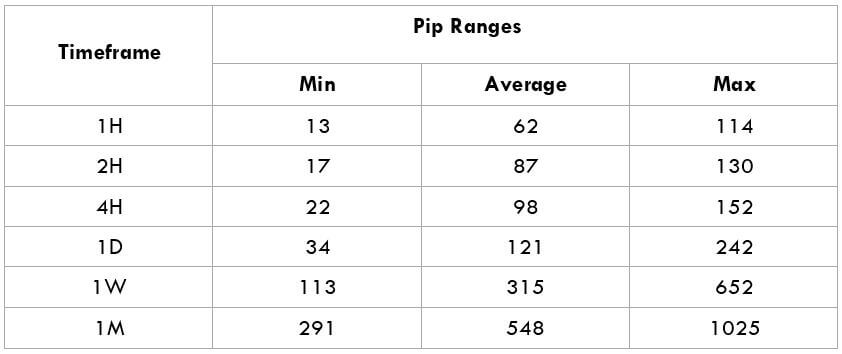
The Range is a measure of volatility. It tells how much the currency pair has moved in a determined period. Whether a trader makes a profit or loss in a given time period depends on the movement of a currency pair and can be determined using the trading range table. It is a representation of the minimum, average, and maximum pip movement in a currency pair. This can be evaluated simply by using the ATR indicator combined with 200-period SMA.

Procedure to assess Pip Ranges

  1. Add the ATR indicator to your chart
  2. Set the period to 1
  3. Add a 200-period SMA to this indicator
  4. Shrink the chart so you can assess a significant period
  5. Select your desired timeframe
  6. Measure the floor level and set this value as the min
  7. Measure the level of the 200-period SMA and set this as the average
  8. Measure the peak levels and set this as Max.

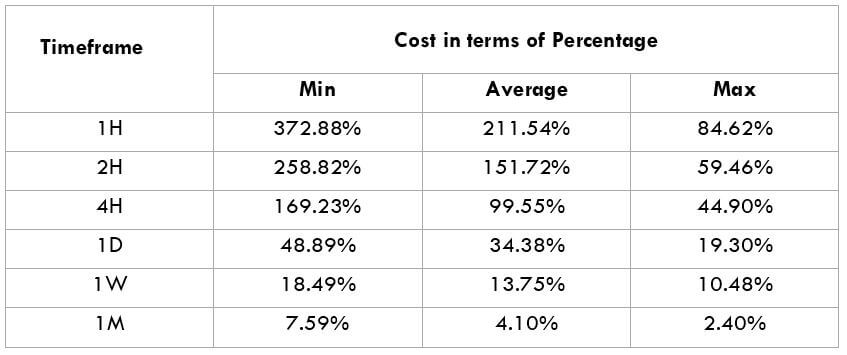
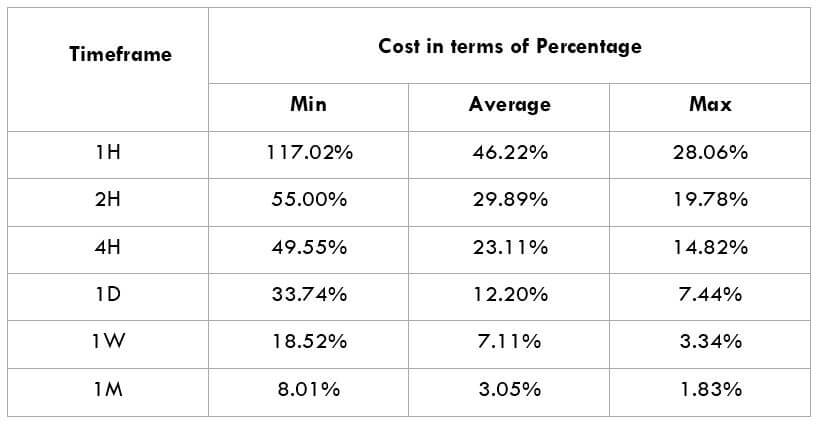
GBP/TWD Cost as a Percent of the Trading Range

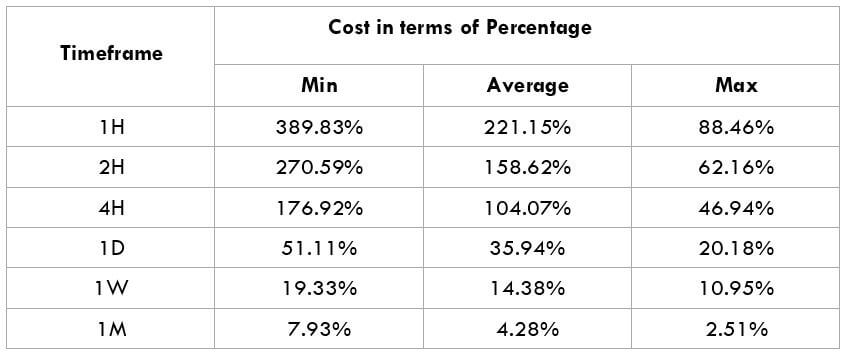
The cost of trade mostly depends on the broker and varies based on the volatility of the market. This is because the total cost involves slippage and spreads apart from the trading fee. Below is the representation of the cost variation in terms of percentages. The comprehension of it is discussed in the following sections. We will look into both the ECN model and the STP model.

ECN Model Account

Spread = 49 | Slippage = 3 |Trading fee = 5

Total cost = Slippage + Spread + Trading Fee = 3 + 49 + 5 = 57
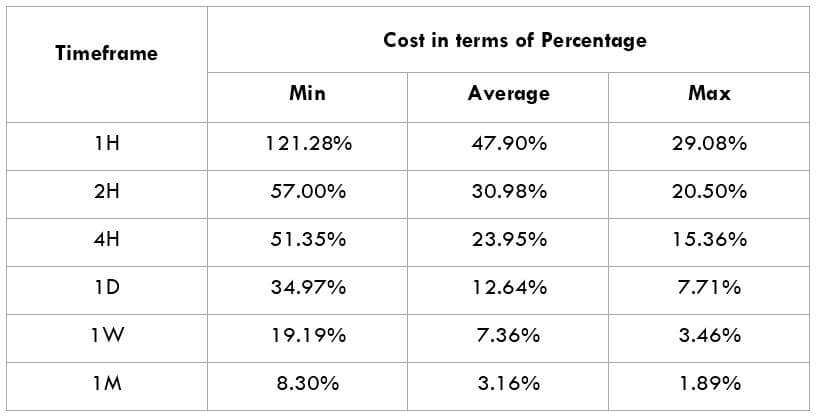
STP Model Account

Spread = 52| Slippage = 3 | Trading fee = 0

Total cost = Slippage + Spread + Trading Fee = 3 + 52 + 0 = 55

Trading the GBP/TWD Forex Pair

The GBP/TWD is an exotic-cross currency pair and is a ranging market. A market is said to be ranging when the price hits the support and resistance at least three times. As seen in the Range table, the average pip movement on the 1-hour time frame is only 47. This clearly shows that if we trade in this pair, we will have to wait for a more extended period of time to get some good profit because of such a less movement in the pips.

Here in GBP/TWD, TWD is considered to be an emerging currency. Note that the higher the volatility, the lower is the cost of the trade. However, this is not an advantage as it is risky to trade highly volatile markets.

For example, in the 1M time frame, the maximum pip range value is 3009 and in minimum pip range, the value is 687. When we compare the fees for both the pip movements, we find that for 687 pip movement fees is 8.30%, and for 3009pip movement, fess is only 1.89%.

So, we can infer that the cost of trade is higher in the low volatile markets and high in the highly volatile markets. It is recommended to trade when the volatility is around the minimum values. The volatility here is low, and the costs are a little high compared to the average and the maximum values. But, if our priority is not towards reducing costs, we may trade when the volatility of the market is around the maximum values.

Categories
Forex Assets

Trading The GBP/SGD Exotic Currency Pair

Introduction To GBP & SGD Pairs

GBP

Great Britain Pound is also known in some contexts as the pound or sterling. It is the official currency of the United Kingdom and many British overseas territories. It is subdivided into 100 pence. The Pound Sterling is the oldest currency in continuous use, and also the fourth most-traded currency in the Forex market, after the United States dollar, the euro, and the Japanese yen.

SGD

The Singapore dollar is Singapore’s official currency, and it is divided into 100 cents. This currency is the thirteenth most traded currency in the world by value.

GBPSGD is the abbreviation for the Pound sterling against the Singapore Dollar. It is classified as an exotic-cross currency pair. In this currency pair, the GBP is the base currency, and the SGD is the quote currency.

Understanding GBP/SGD

In Forex, in order to find out the relative value of one currency, we need another currency to compare. It shows how much the GBP (the base currency) is worth as measured against the SGD (quote currency). It can simply be understood as 1GBP is equal to how much SGD. So if the exchange rate for the pair GBPSGD is 1.6894. It means that one GBP costs 1.6894 SGD.

Spread

The spread is the difference between the Bid (Sell) price and the Ask (Buy) price of an asset. The spread is how brokers make their money. Some broker Instead of charging a fee for performing a trade, the cost is built as a difference between the buy and sell prices of the currency pair.

ECN: 15 pips | STP: 19 pips

Fees

A Fee is simply the commission we pay to the broker on each position we open. There is no fee on STP account models, but a few pips on ECN accounts.

Slippage

Slippage is the difference between the price at which the trader wants to execute the trade and the price at which the trade is effectively executed. Slippage can occur at any time but is mostly happens when the market is very Volatile.

Trading Range in GBP/SGD

The amount of money we will win or lose in a given amount of time can be assessed using the trading range table. This is a representation of the minimum, average, and maximum pip movement in a currency pair.

Procedure to assess Pip Ranges

  1. Add the ATR indicator to your chart
  2. Set the period to 1
  3. Add a 200-period SMA to this indicator
  4. Shrink the chart so you can assess a large time period
  5. Select your desired timeframe
  6. Measure the floor level and set this value as the min
  7. Measure the level of the 200-period SMA and set this as the average
  8. Measure the peak levels and set this as Max.

GBP/SGD Cost as a Percent of the Trading Range

The cost of trade varies based on the volatility of the market. This is because the total cost involves slippage and spreads apart from the trading fee. Below is the representation of the cost variation in terms of percentages. The comprehension of it is discussed in the coming sections.

ECN Model Account

Spread = 15 | Slippage = 3 | Trading fee = 5

Total cost = Slippage + Spread + Trading Fee = 3 + 15 + 5 = 23

STP Model Account

Spread = 19 | Slippage = 3 | Trading fee = 0

Total cost = Slippage + Spread + Trading Fee = 3 + 19 + 0 = 22

Trading the GBP/SGD currency pair

The GBPSGD is an exotic-cross currency pair and is a normal ranging market. For instance, the average pip movement on the 1H timeframe is only 62 pips. Note that the higher the volatility, the lower is the cost of the trade. However, this is not an advantage as it is risky to trade highly volatile markets.

Also, the larger/smaller the percentages, the higher/lower are the costs on the trade. So, we can infer that the costs are higher for low volatile markets and high for highly volatile markets.

To reduce the risk, it is recommended to trade when the volatility is around the minimum values. The volatility here is low, and the costs are a little high compared to the average and the maximum values. But, if you’re priority is towards reducing costs, you may trade when the volatility of the market is around the maximum values.

Also, we can take advantage of the Limit orders to reduce costs. When orders are executed as market orders, the risk of slippage always persists. But, with the help of limit orders, we can completely avoid slippage, thereby reducing the overall trading cost. When slippage is Zero, only trading fees and the spread will be taken into consideration to calculate the total costs. Hence, it brings down the cost significantly.

Categories
Forex Market Analysis

The Pound Sterling in Focus This Week

The Pound Sterling in focus this week

The pound hit the buffers at the 1.3440 today, just prior to the manufacturing data release which was a miss for April (the second consecutive monthly miss). With manufacturing being the third largest economic sector it can cause an impact on the overall expectations for GDP growth.

The UK’s goods trade balance widened faster than was expected too, and with the construction sector coming up short on data expectations, it was no wonder the Pound spiked lower to 1.3348 on the release before settling around the 1.3365 level at the time of writing.

But the real jitters are due to a host of further data releases coming later in the week, including key employment data, inflation related data, RPI and PPI and retail sales. Plus the UK Prime Minister Theresa May faces a series of votes in the House of Commons on the 12th June on whether to approve 15 Brexit amendments inserted into the EU Withdrawal Bill. If the Government loses one of the key votes it could pave the way for parliament to have a ‘meaningful’ say in the final Brexit deal, and thus potentially leading to a ‘soft’ Brexit.

Plus of course, we have the Fed interest rate decision to look forward to on Wednesday.

Therefore, I would expect many GBP institutional traders to be sitting on the sidelines this week.

Categories
Forex Market Analysis

Daily Market Update: RBA Left Rate Unchanged, Great Britain Services PMI Rose


News Commentary


Sterling

Sterling was boosted by data showing that the British economy is exhibiting signs of recovering from its recent slowdown, reviving expectations that the Bank of England might raise interest rates in August. Services PMI rose to 54.0, higher than the expected 52.9.

RBA

The RBA Board decided to leave the cash rate unchanged at 1.50%.

“The recent data on the Australian economy has been consistent with the Bank’s central forecast for GDP growth to pick up, to average a bit above 3% in 2018 and 2019. Business conditions are positive and non-mining business investment is increasing. Higher levels of public infrastructure investment are also supporting the economy. Stronger growth in exports is expected. One continuing source of uncertainty is the outlook for household consumption. Household income has been growing slowly, and debt levels are high” declared media section of the RBA.

US

All eyes will be on the US ISM Non-Manufacturing PMI at 02:00 GMT with a forecast of 57.9.


 Chart Analysis


US INDEX

On the daily chart, the price had successfully broken the ascending trend from the high of 2017, along with the resistance level to eventually reach the key resistance 95.15 to bounce back from there. The price shaped a reversal pattern (wedge) which closed with a break beneath it.

With divergence in RSI, the price is expected to have a correction to the key support at 92.6 which is located at the broken trend too.


USD/CAD

On the daily chart, as expected, the price made its way into the resistance zone of 1.289-1.298, almost reaching the key resistance at 1.309, with an approach from the descending trend line starting from the high of 2015, and the upper edge of the horn pattern.

The price has already bounced beneath the key resistance and the resistance zone and got back above it again, but it couldn’t go much further to form a pinbar, to take the price firstly to the support level at 1.274.


AUD/USD

On the daily chart, the price had a false break beneath the support zone 0.75-0.7535 with a pin bar. That enhances the AB=CD harmonic pattern, with breaking a descending channel. The pair rose with an engulfing candle above the support zone.

Along with divergence in RSI, the price is ready for the next move up to 0.774 which is a level with a combination of the lower trend line from the high of 2018 and the broken uptrend.