‘8765Introduction
Government Debt to GDP is one of the main indicators which points towards the current health of an economy and its probable future monetary prospects. For a long time, analysts have used Government Debt to GDP ratio as one of the reliable indicators in ascertaining a country’s economic health and its resultant country’s currency worth.
What is the Government debt-to-GDP ratio?
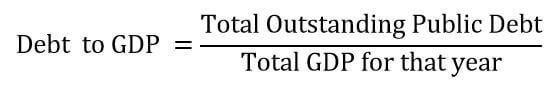
The debt-to-GDP is the proportion of a country’s total public debt to its GDP (Gross Domestic Product). In simpler words, it is the ratio of what a country owes to what a country earns. The debt-to-GDP ratio of a country compares its sovereign money owed to its total economic output for the year. Here the output is measured by gross domestic product.
Why is the Government debt-to-GDP ratio important?
When we contrast what a nation owes against what it outputs, the debt-to-GDP ratio assuredly indicates a nation’s potential to repay its dues. The Government debt to GDP in many places is conveyed as a percentage. This ratio can also mean the time required by a nation to repay and close off the owed sum where we assume if GDP is entirety used for its debt repayment.
The Government debt-to-GDP ratio is a beneficial indicator for analysts, economists, investors, and leaders. It enables them to ascertain a country’s potential to repay its owed debt. An excessive debt to GDP ratio tells that the country isn’t generating enough output to be able to repay its debt. A small ratio means there is enough income to pay off the interest on its debt.
To elaborate in layman terms, consider this analogy where a nation is like an employee, and GDP is like his/her income. Financial Institutions will be willing to give a bigger loan if they earn a higher salary. In the same way, investors would come forward to take on a country’s debt if it generates more revenue.
If investors start to lose confidence in repayment by a country, they will tend to expect a higher return in the interest rate for their lent money for the higher defaulting risk. That results in the rise of the country’s cost of debt. It means the debt itself becomes more expensive in the sense that more money goes on in just paying interests only. Such situations can quickly become a financial crisis and thereby resulting in depreciation on their credit score. That will, in turn, impact their money lending capacity and credibility in the future.
How can Government debt-to-GDP ratio be Used for Analysis?
If a Government has spent more in the past than they have received in tax revenues, it means they are injecting more money into the economy than they are withdrawing and vice versa. In general, injections are inflationary and withdrawals deflationary. The higher the percentage of Debt to GDP a Government has, the more they have to spend to maintain inflation or GDP growth or risk defaulting on their debt.
As the debt to GDP ratio increases, Economic growth becomes more dependent on Public Spending. If the Government decides to cut public spending, then this would mean if all things being equal, reduce the debt to GDP ratio and be deflationary. The thing we need to notice here is that a higher debt to GDP ratio means there is more pressure to inflate. The only choices are to deflate (which is not desirable), default on the debt (not desirable), or to inflate further.
Historically 80% level of debt to GDP is usually seen as the trouble zone. The default zone is above 100%, where it means that what country earns is less than what country owes. Interest rate suppression is necessary to keep interest bill on Government debt to a minimum. At levels of 100%+ Debt to GDP Ratio, Governments have no choice but to continue to inflate further.
Impact on Currency
If a country’s debt-to-GDP ratio increases, it often points towards an oncoming recessionary period. When a country’s GDP decelerates during a contraction, it causes federal revenue, in the form of taxes and federal receipts, etc., declining. This results in currency depreciation. In this type of situation, generally, the government tends to increase its public spending to spur growth in the economy. If this spending produces the desired effect, the recession will waive off. Taxes and federal revenues will again increase, and the debt-to-GDP ratio should accordingly return to normal.
When the entire world’s economy keeps on improving, investors will tolerate a higher exposure on their lent money because they seek higher returns. The returns on U.S. debt will increase as requests for U.S. Debt depreciates. If a particular country’s interest rate returns are higher than usual, we also need to keep in mind the fact that the probable reason for such high rates are either because the nation is already in a lot of debt, so it is very likely to default, and it certainly is in less demand in the market.
The country has to give out larger sums of interest to get them to purchase its bonds and lend their money to the Government. Hence, Investors generally choose developed nations or nations with a proven track record of repayment. In general, a decrease in the Debt to GDP number indicates a growing economy, which ultimately results in strengthening the currency.
Economic Reports
To calculate the debt-to-GDP ratio, we have to know mainly two things: the country’s current owed sum and the country’s generated revenue, i.e., its real Gross Domestic Product. This data is publicly available, and it is released quarterly. The majority of economic analysts, professional traders, look at total overall debt, but some institutions, like the CIA, only consider the total public debt to publish in their publishes.
Sources of Government Debt to GDP
The Research Division of St. Louis FRED is in the top 1% of all economics research departments worldwide. St. Louis Fed publications provide analysis, information, and instruction for the journalists, the general public, and students. These outlets allow us to effectively address economic trends, explore historical trends, and current data for economic policy.
For the United States, we can get a comprehensive analysis of Federal Debt, Total Public Debt, and Total Public Debt as a Percentage of Gross Domestic Product, Federal Surplus or Deficit. All of these details with illustrative historical analysis and many more subcategories of the same can be found in the St. Louis website.
Inflation Rates of some of the major economies can be found below.
United Kingdom | Australia | United States | Switzerland | Euro Area | Canada | Japan
How ‘Government Debt to GDP Ratio’ News Release Affects The Price Charts?
After understanding the Government Debt to GDP economic indicator, we will now see how a currency is affected after the news announcement is made. To understand the effect, we have chosen ‘Brazilian Real’ as the reference currency, as the data available is appropriate for analyzing the impact made by the news.
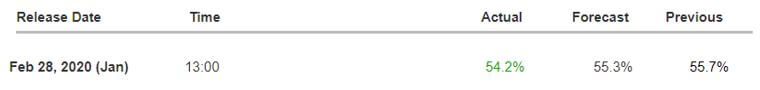
The Debt-to-GDP ratio data has the least importance and does not cause much volatility in the currency pair after the news release. This is the reason why most countries do not announce the data every month and review the GDP ratio on a yearly basis. But Brazil is one country where the government releases the data on a monthly basis. Let us analyze the lastest Debt to GDP ratio of Brazil.
The Debt to GDP ratio of Brazil is released by the Brazilian Institute of Geography and Statistics (IBGE), which is the official agency responsible for the collection of various information about Brazil. We see that the Debt to GDP ratio was reduced by a mere 1.5% from the previous January’s ratio. Let us find out how the market reacted to this.
Note: The ‘Brazilian Real’ is an ’emerging currency’ which is not traded in high volumes and hence can appear to be illiquid at times.
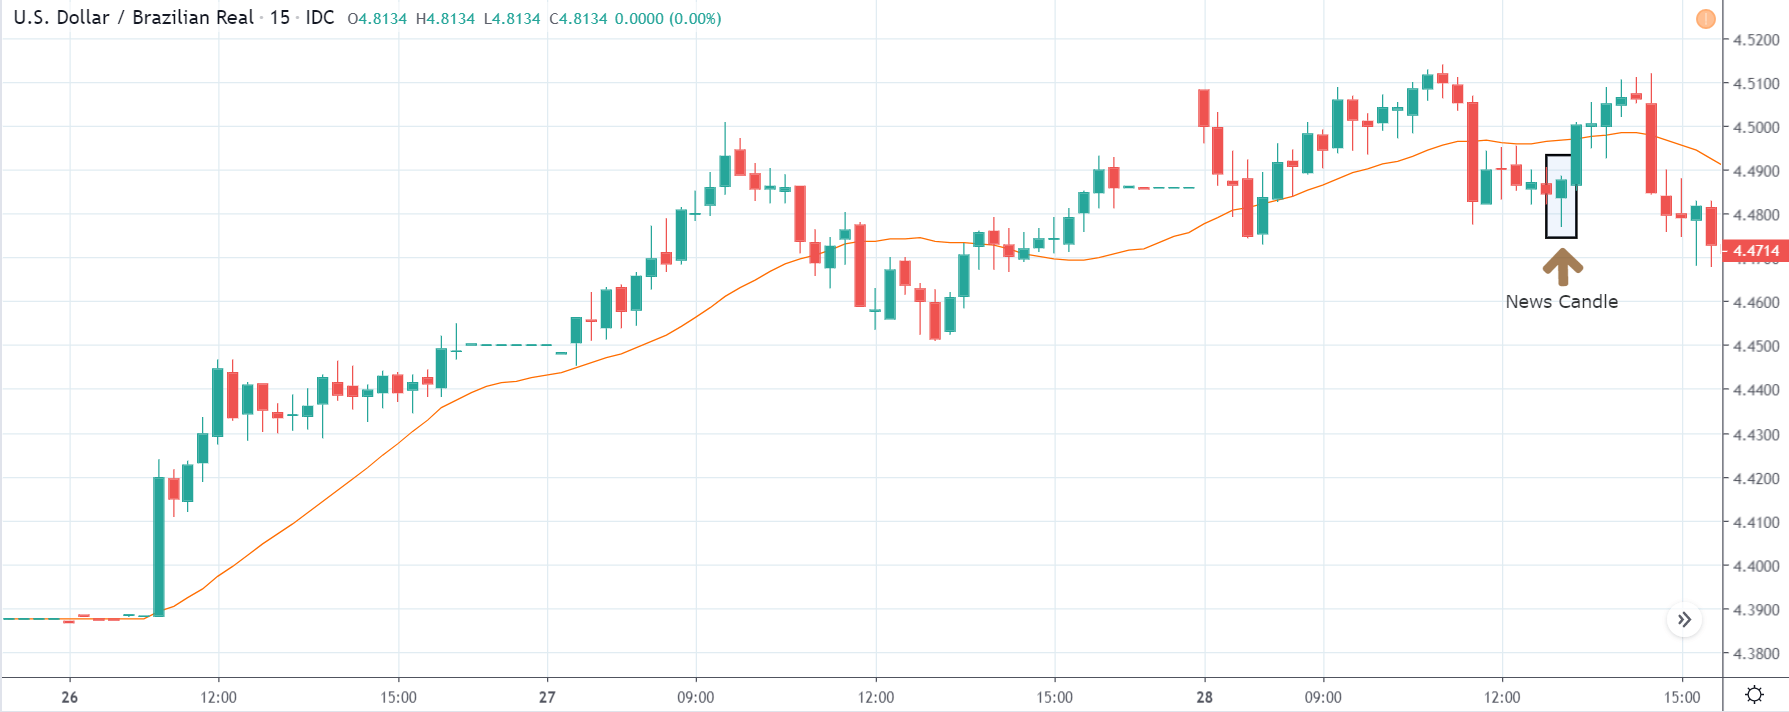
USD/BRL | Before The Announcement - (Feb 28th, 2020)
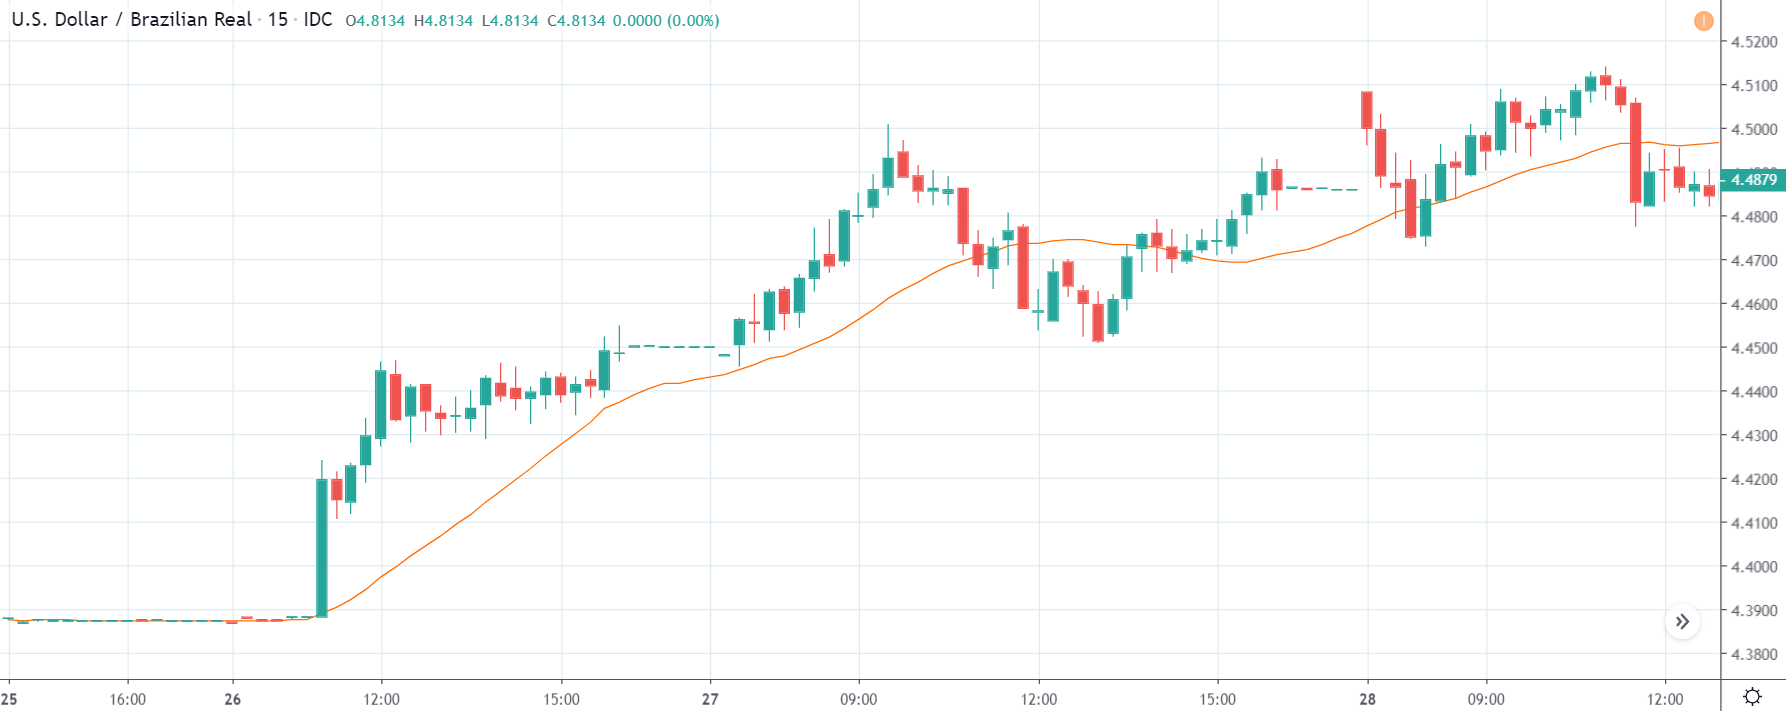
In USD/BRL, the market before the news announcement is in an uptrend showing the weakness of the ‘Brazilian Real.’ The price, just before the data is about to release, has broken the moving average line, which could be a sign of reversal. As we mentioned in the previous section of the article, lower than expected reading is taken as positive for the currency and should strengthen the currency.
Hence if the data is much lower than 55.7%, we can take a ‘short’ trade and expect a trend reversal. In this case, we will also have a confirmation from the MA. Whereas if the data is maintained around the previous reading or increased, it is bad for the currency, and we need to wait for some trend continuation signs to join the uptrend.
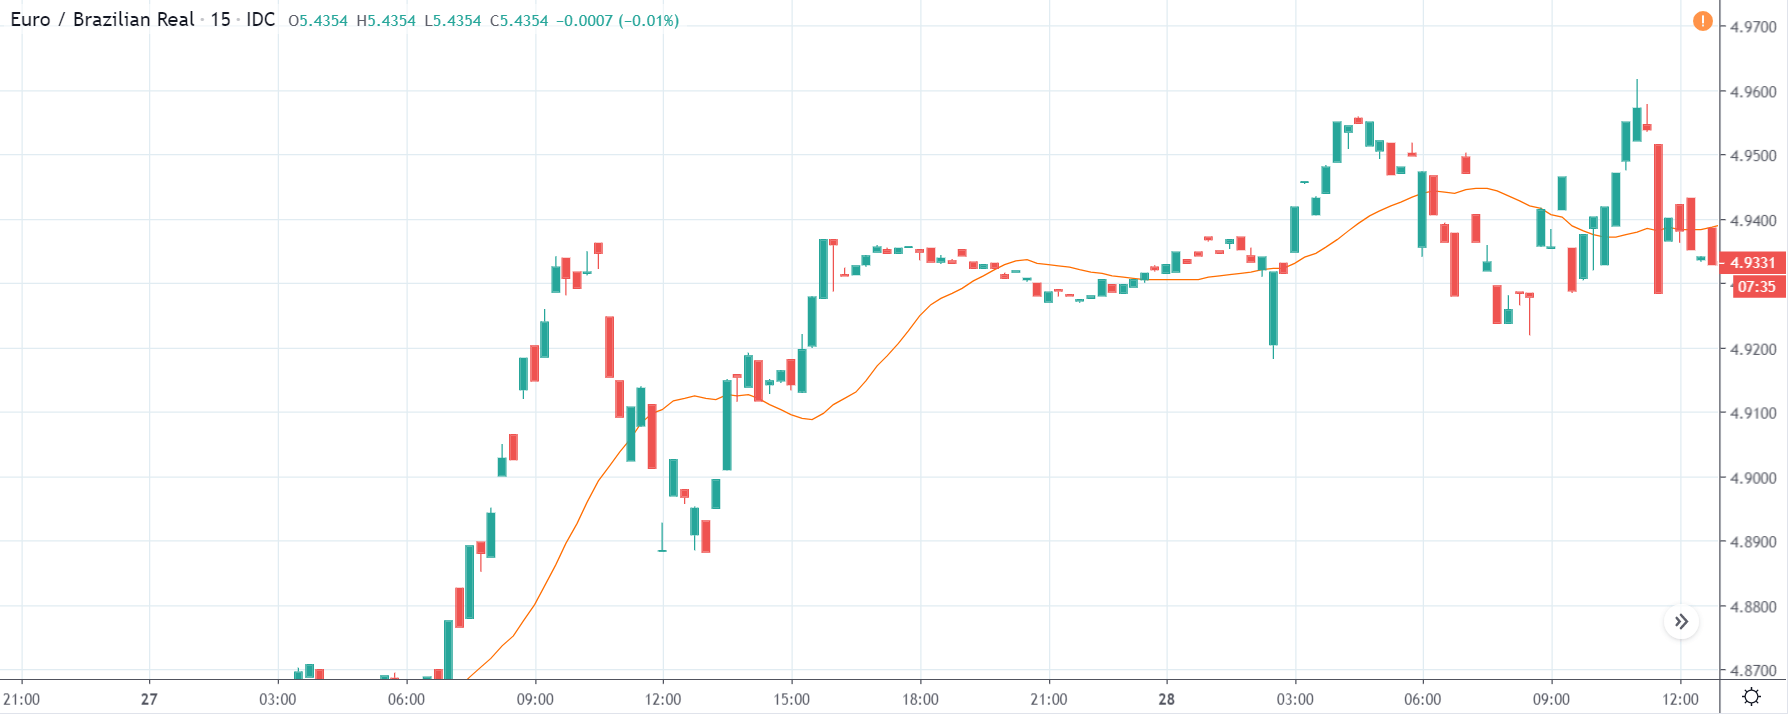
USD/BRL | After The Announcement - (Feb 28th, 2020)
After the news announcement is made, traders see that there was not much change in the Debt to GDP ratio, where was it was reduced by just 1.5%. This is the reason why USD/BRL did not collapse, which would strengthen the ‘Brazilian Real.’ The price did go down for a while but later created a spike on the bottom and closed above the opening price.
This spike could be a sign of trend continuation, and one can go ‘long’ in the market with a stop loss below the ‘low’ of the spike and targeting the recent high. We are essentially taking advantage of the increase in volatility after the news announcement.
EUR/BRL | Before The Announcement - (Feb 28th, 2020)
EUR/BRL | After The Announcement - (Feb 28th, 2020)
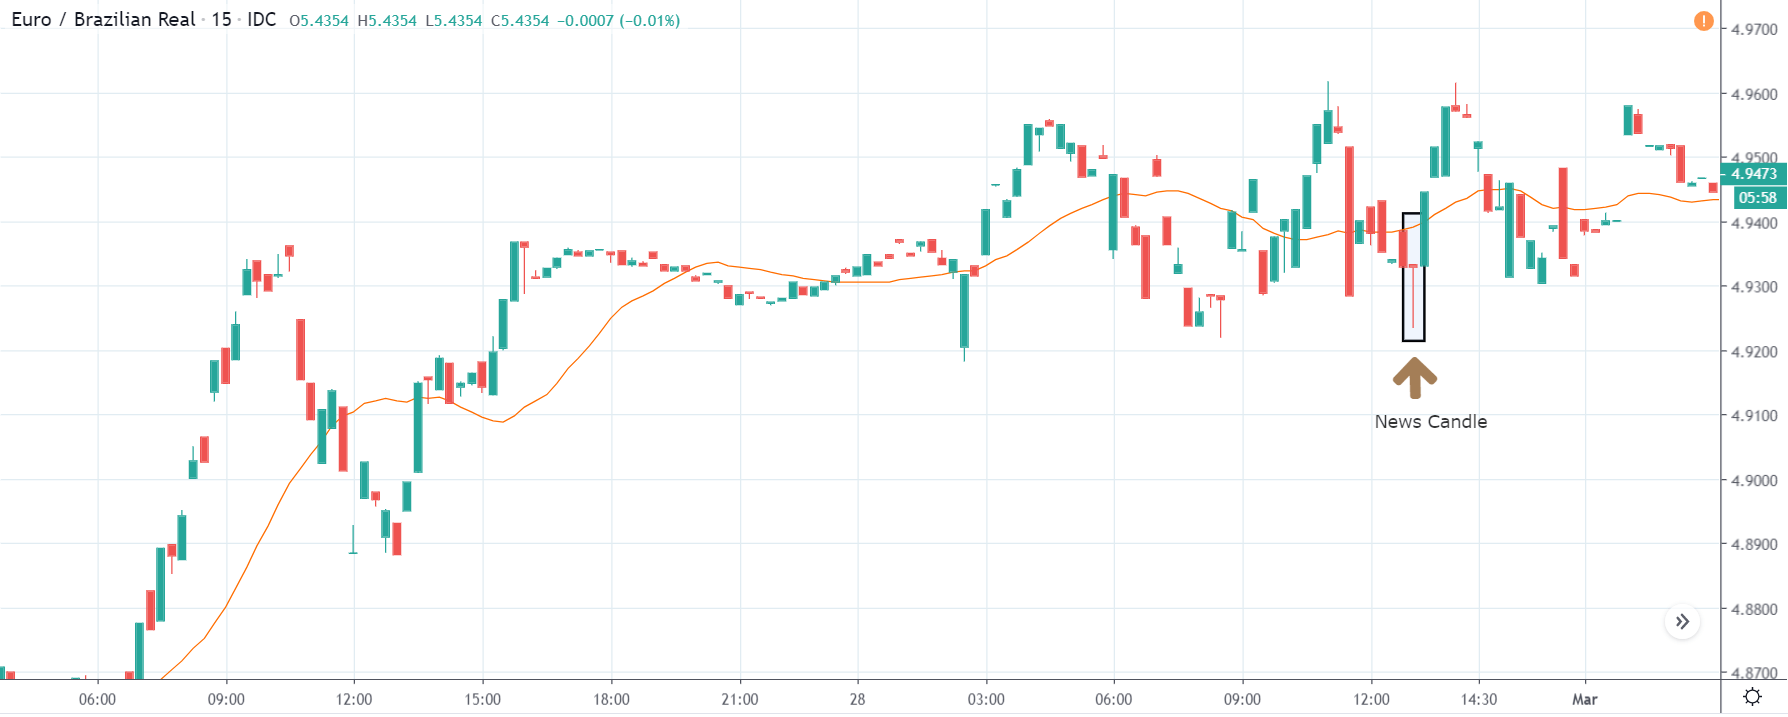
The EUR/BRL currency pair shows similar characteristics as that of the USD/BRL pair but with a major difference that the price remains below the moving average most of the time. Even though a wonderful rejection is seen at the time of news announcement, it is advised to go ‘long’ in this pair with a smaller position size and taking profit at the earliest. The debt to GDP ratio was not reduced much to create an impact on the pair, which can be seen from the ranging nature of the market after the news release.
GBP/BRL | Before The Announcement - (Feb 28th, 2020)
GBP/BRL | After The Announcement - (Feb 28th, 2020)
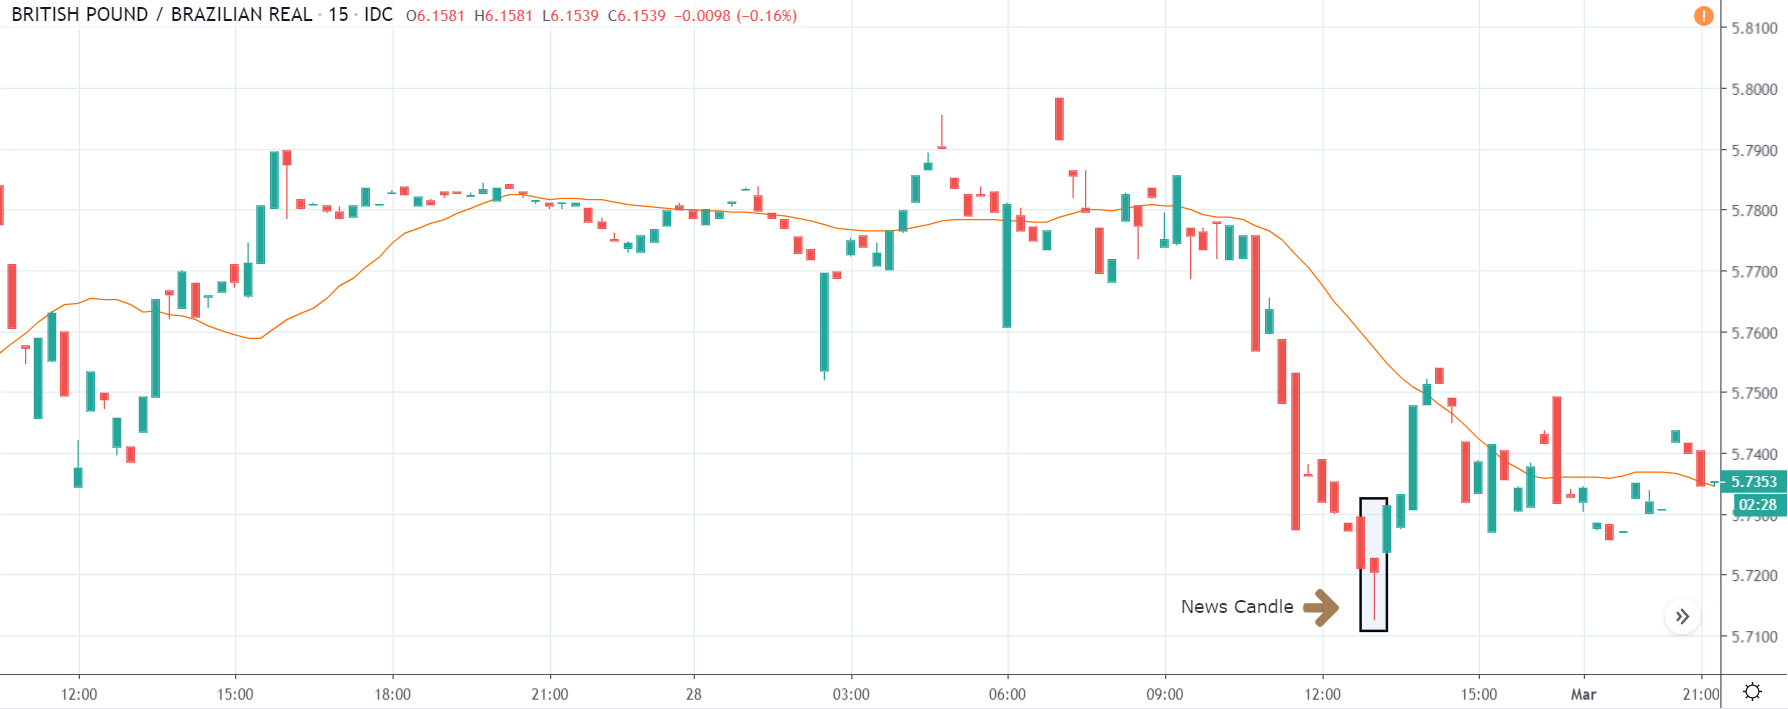
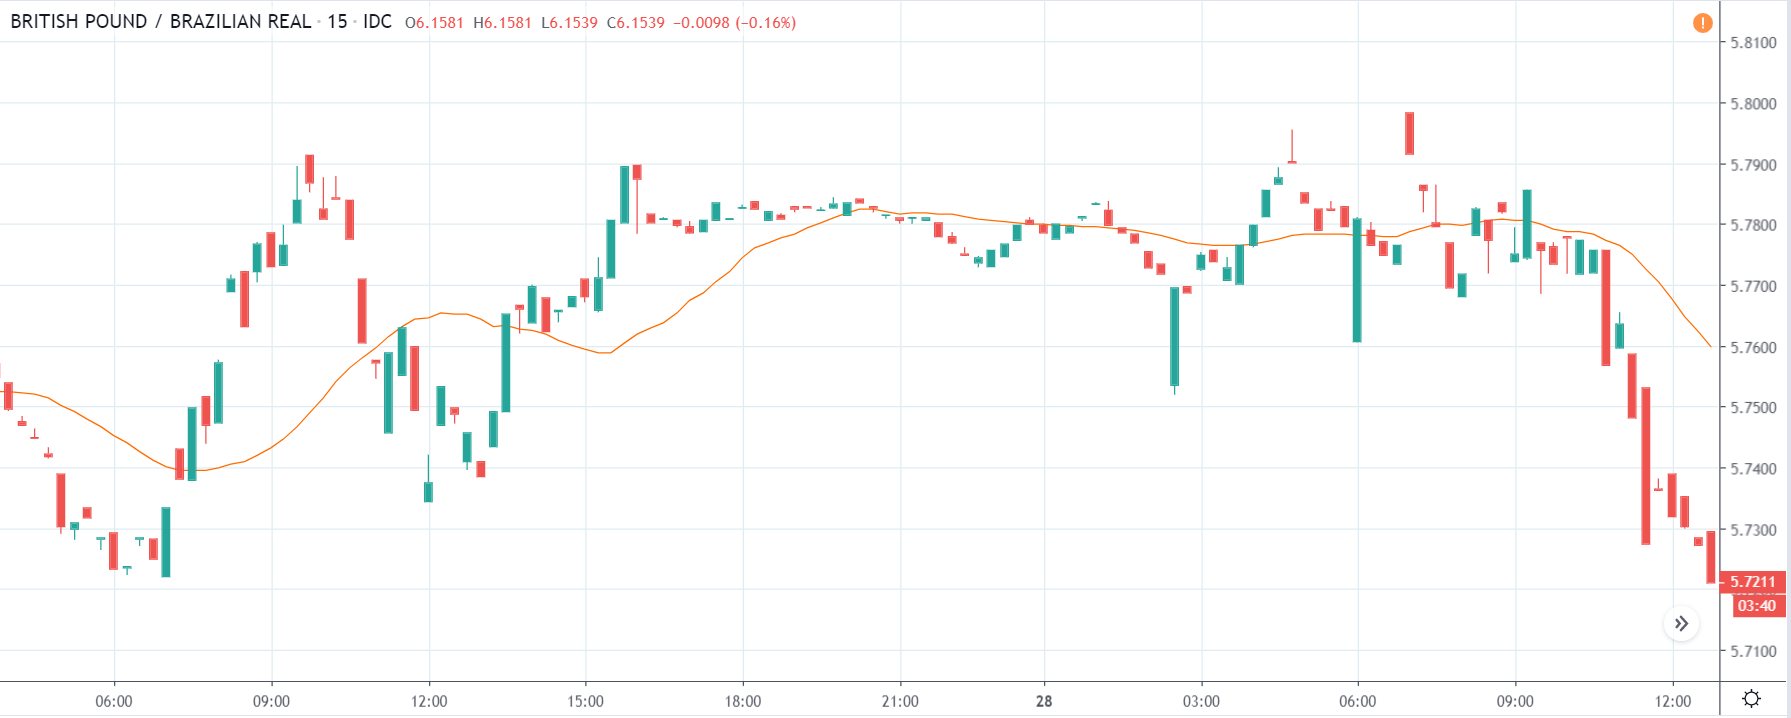
In the above chart, we can see that the currency pair is already in a downtrend, showing the strength of the ‘Brazilian Real.’ Since the pair is in a strong downtrend, not so good news for the Brazilian Real would mean no reversal of the current trend. However, this currency pair could prove to be the best pair for trading among all other pairs if the news outcome is positive for the Brazilian Real as we will be trading with the trend.
After the news announcement is made, the market barely goes above the moving average, which means going ‘long’ in this pair can be very risky. Therefore, the only way to trade in such scenarios is when the news outcome is positive for the currency pair on the right-hand side and profit on the downside.
That’s about Government Debt To GDP Ratio and its impact on some of the Forex currency pairs. In case of any queries, let us know in the comments below. Cheers.

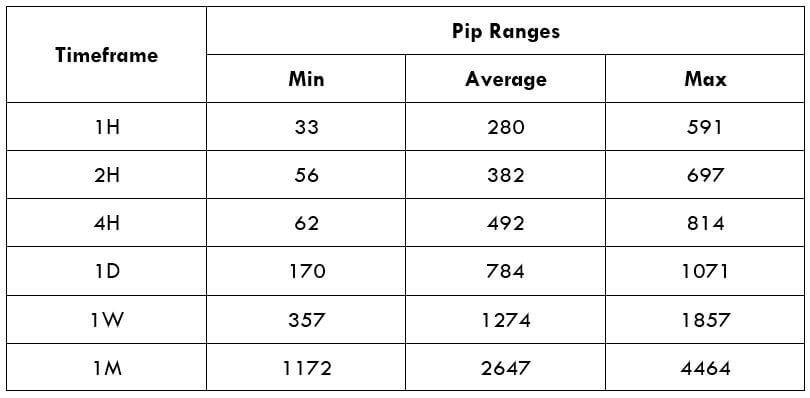
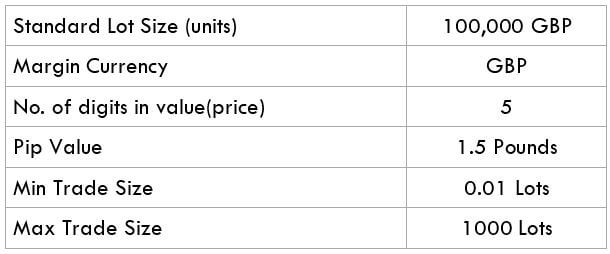
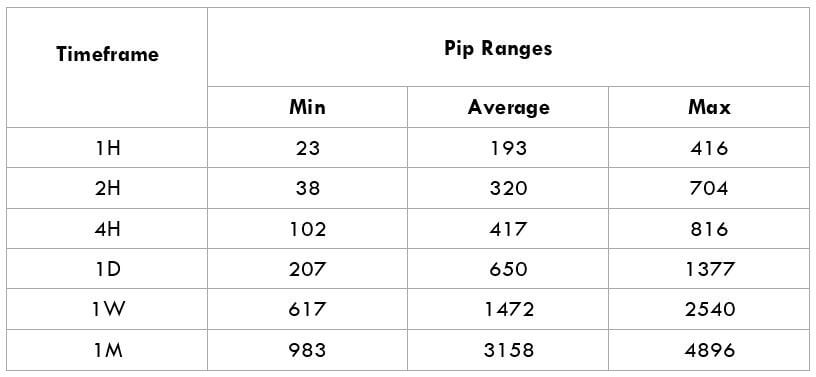
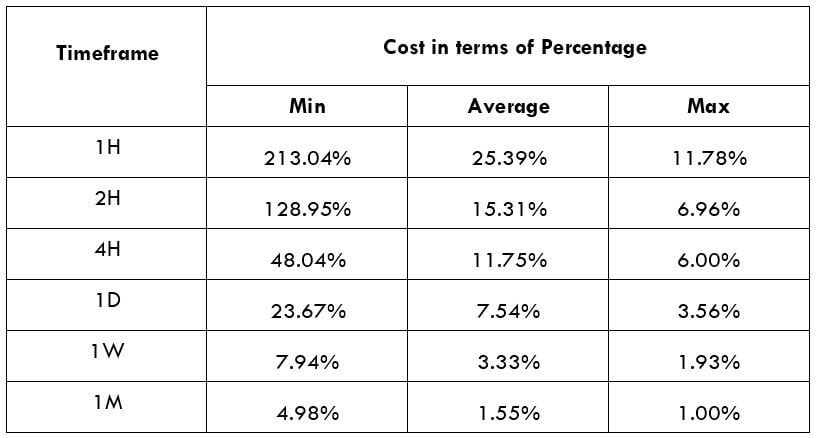
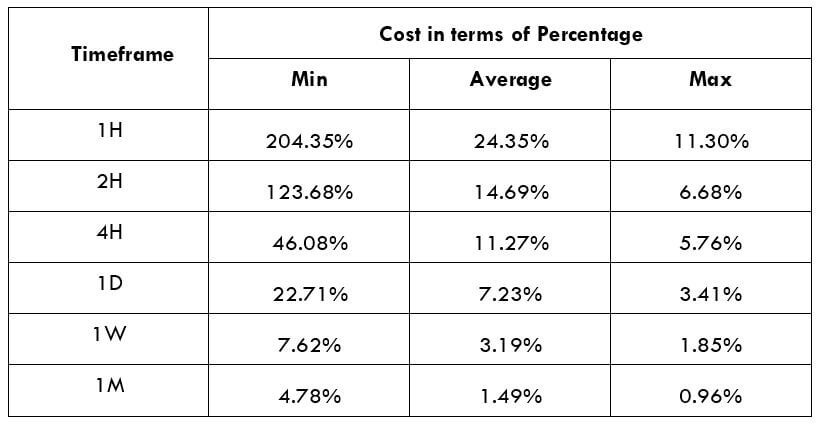
 Spread
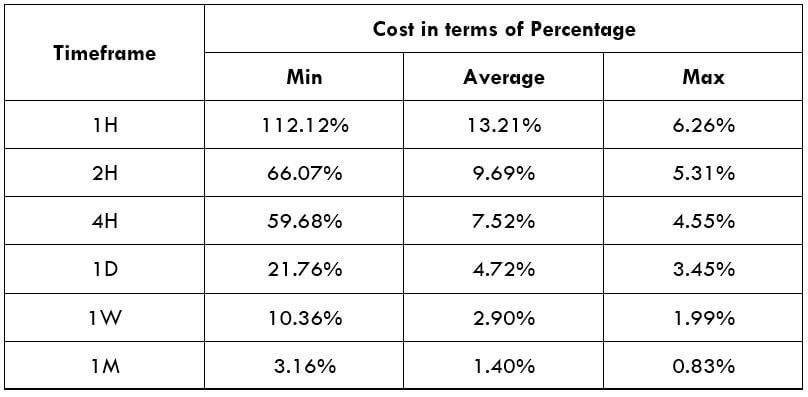
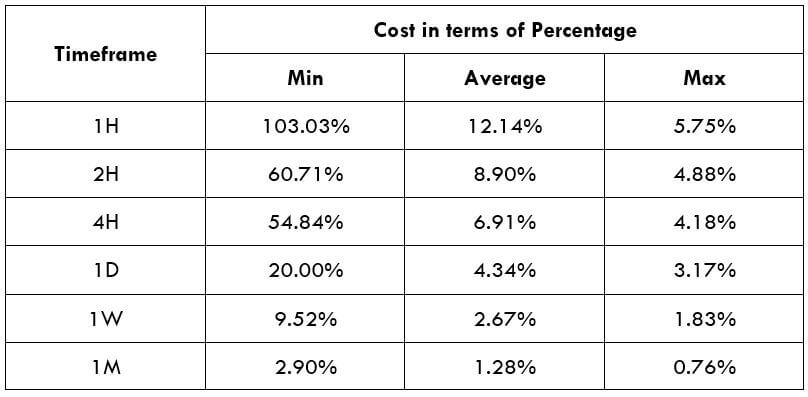
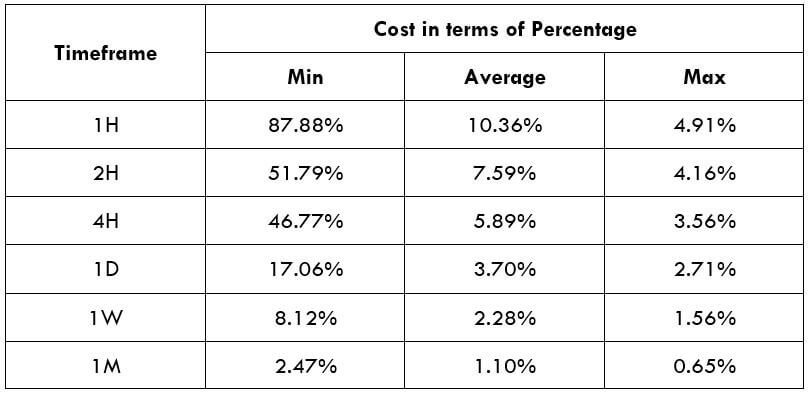