Categories
Forex Assets

Trading The ‘GBP/BRL’ Exotic Pair & Comprehending The Costs Involved

Introduction

GBP/BRL is the abbreviation for the Pound sterling against the Brazilian real. As we know, GBP is the official currency of the United Kingdom, Jersey, Guernsey, and others, whereas BRL is the official currency of Brazil. In Forex trading, currencies are always traded in pairs. The primary currency in the pair is known as the base currency, while the second one is the quote currency.

Understanding GBP/BRL

To find the relative value of one currency, we compare that with another currency in the Forex market. The market value of GBP/BRL helps us to understand the strength of BRL against the GBP. If the exchange rate of the pair GBP/BRL is 6.5415. It means that to buy 1 GBP, we need 6.5415 BRL.

Spread

Forex brokers have two prices for currency pairs. They are the bid and ask prices. The difference between this bid and the ask prices is known as the spread, and this is how Forex brokers profit for the services they provide. Some brokers include the costs in the buy and sell prices of the currency pairs instead of charging spreads. Below are the ECN and STP spread values for the pair GBP/BRL.

ECN: 41 pips | STP: 44 pips

Fees

A Fee is a commission we pay to the broker for executing our trades. It differs for different types of brokers. For instance, there is no fee charged by the STP brokers, but for ECN accounts, a few pips are charged a fee.

Slippage

It is the difference between the expected price and the price at which the trade gets executed. Slippage can occur at any time, but it mostly happens when the market is highly volatile.

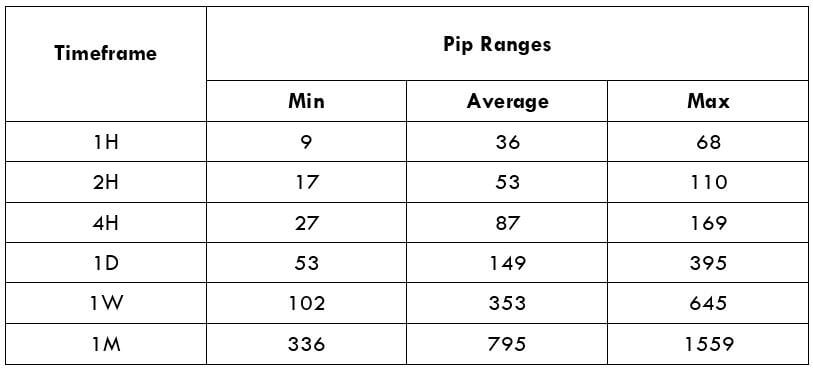
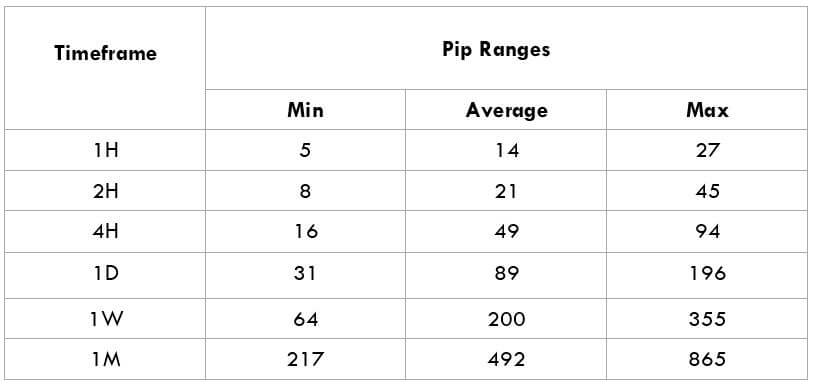
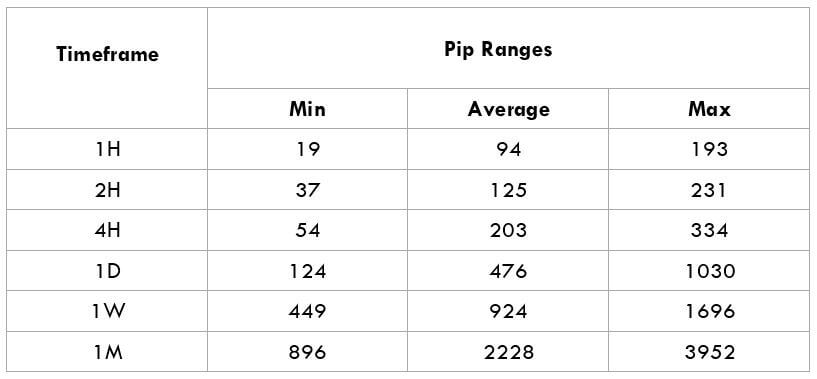
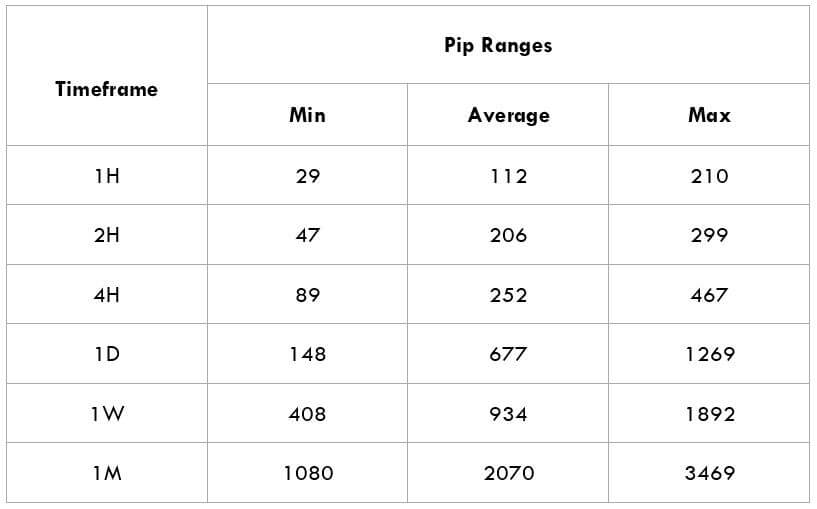
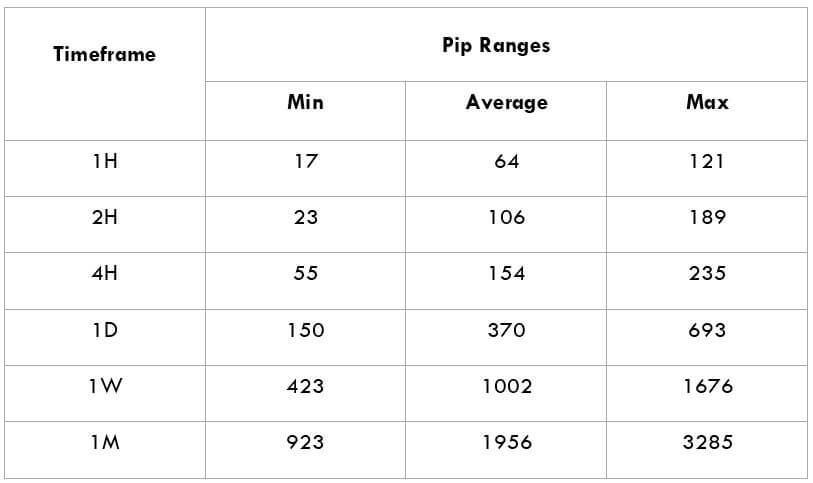
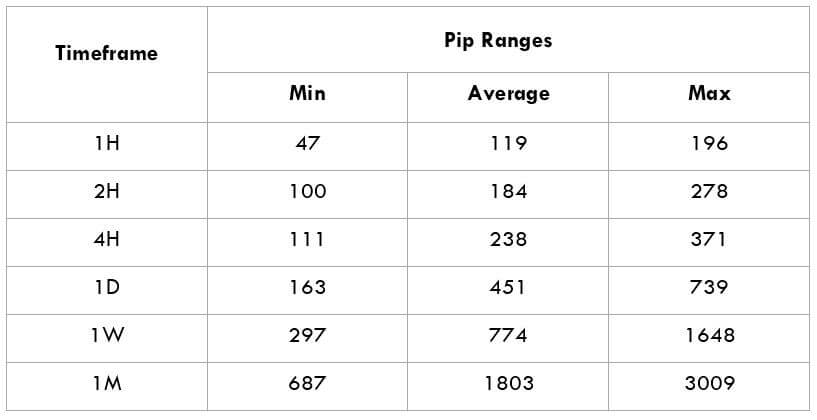
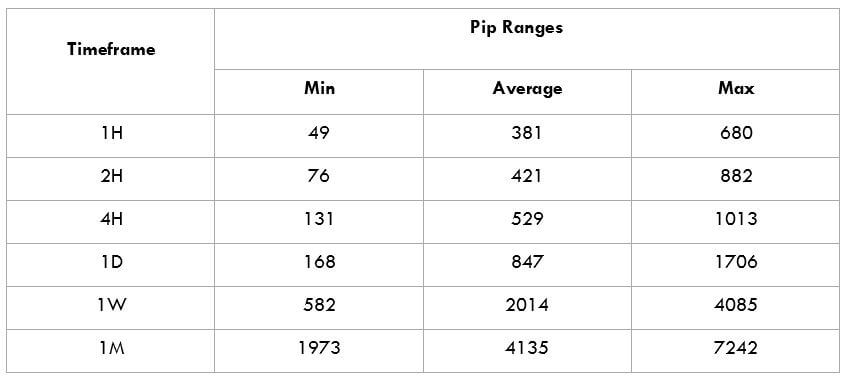
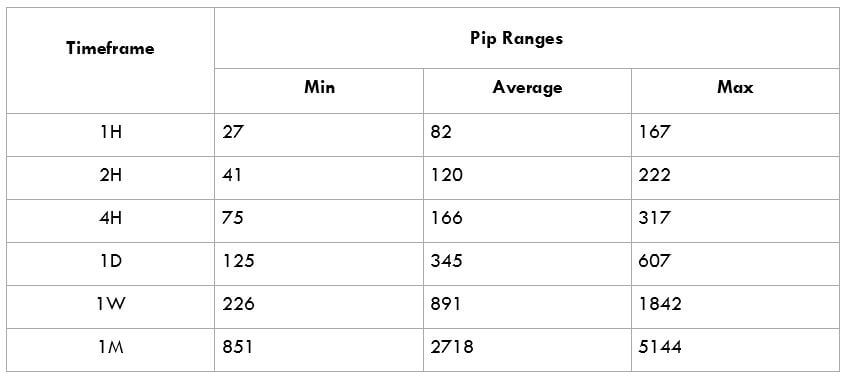
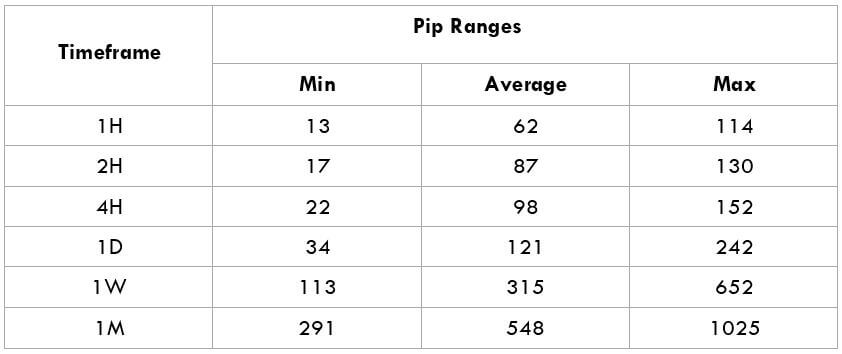
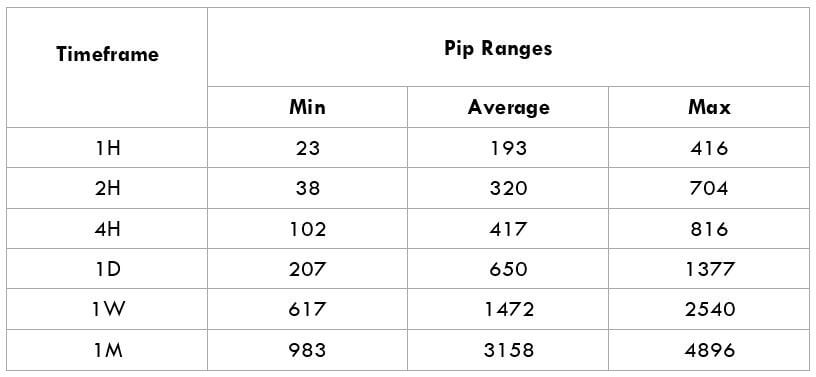
Trading Range in GBP/BRL

Being aware of the volatility of a particular currency pair before placing the trade is very important for every aspiring trader. The trading range here is useful to measure the volatility of the GBP/BRL pair. The amount of money we will win or lose in a given amount of time can be assessed using the below trading range table.

Procedure to assess Pip Ranges

  1. Add the Average True Range indicator on your price chart
  2. Then, set the period to one
  3. Add a 200-period Simple Moving Average to the ATR indicator
  4. Shrink the chart to assess a significant period
  5. Select the desired timeframe
  6. Measure the floor level and set this value as the minimum
  7. Measure the level of the 200-period SMA and set this as the average
  8. Measure the peak levels and set this as Max.

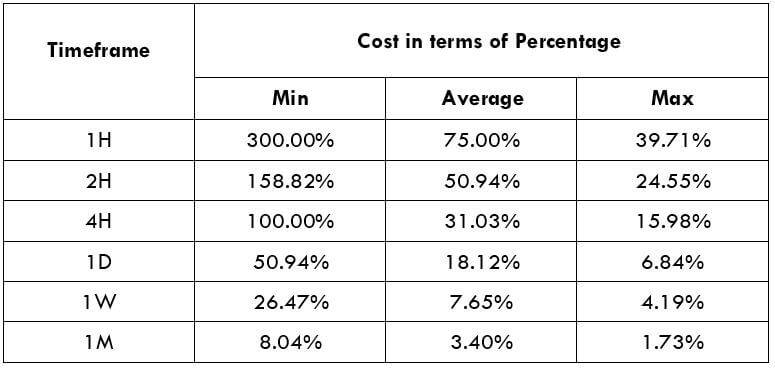
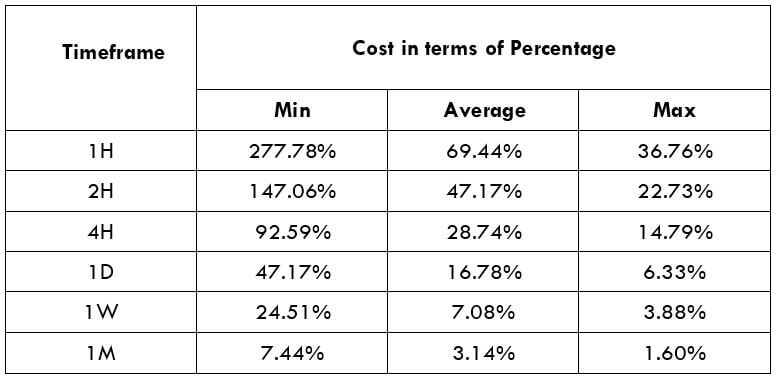
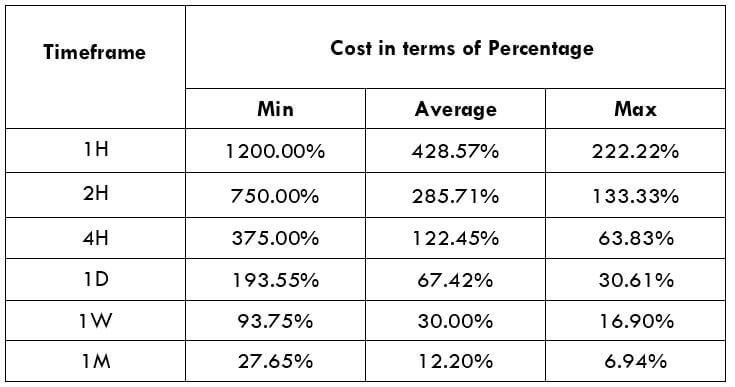
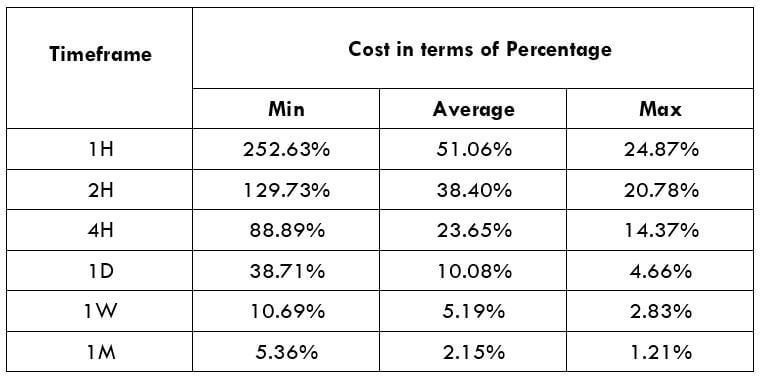
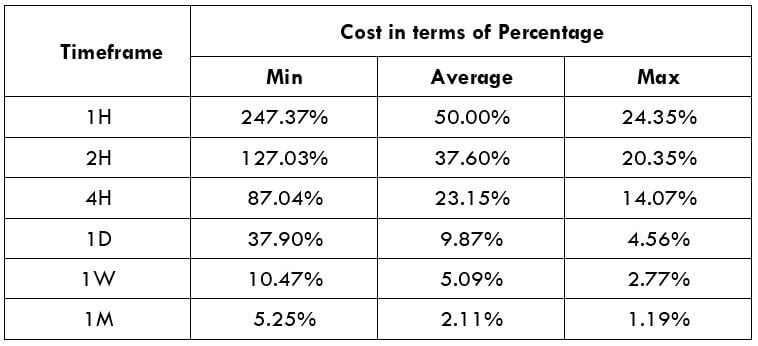
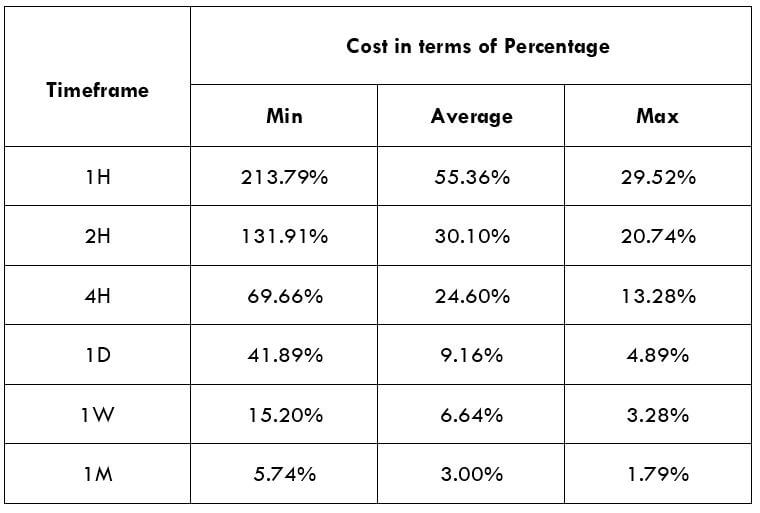
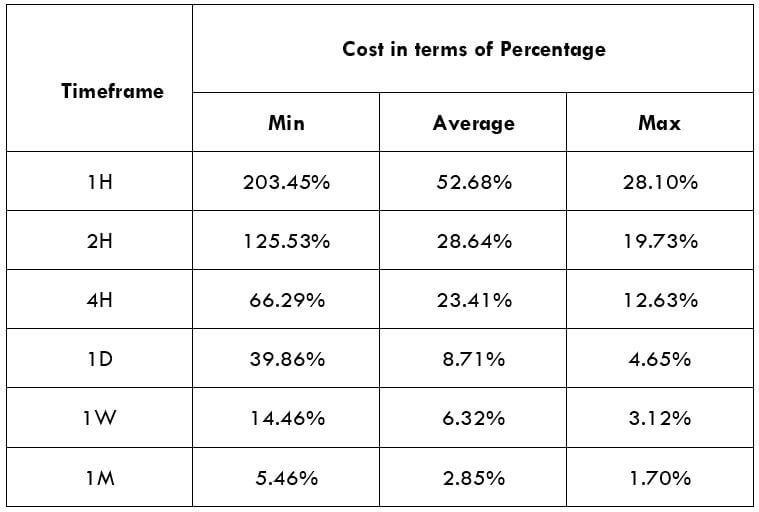
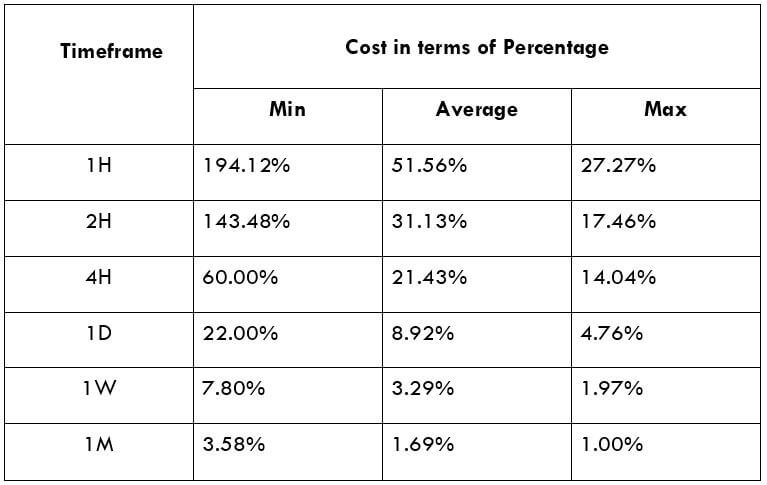
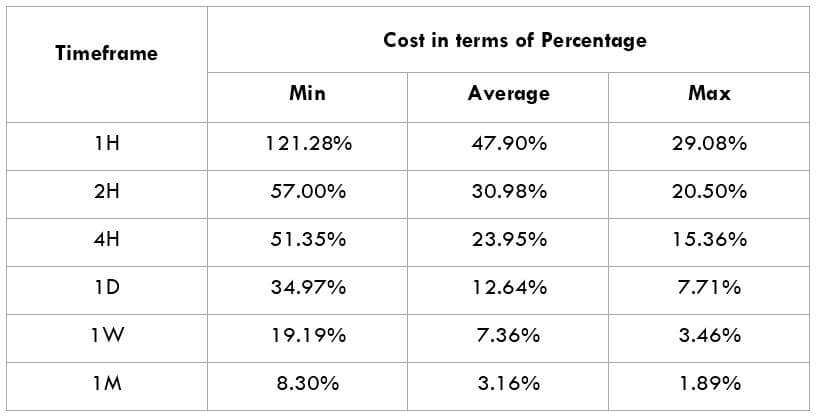
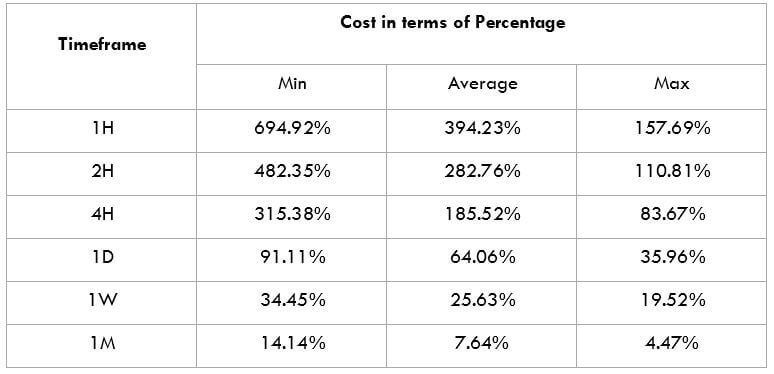
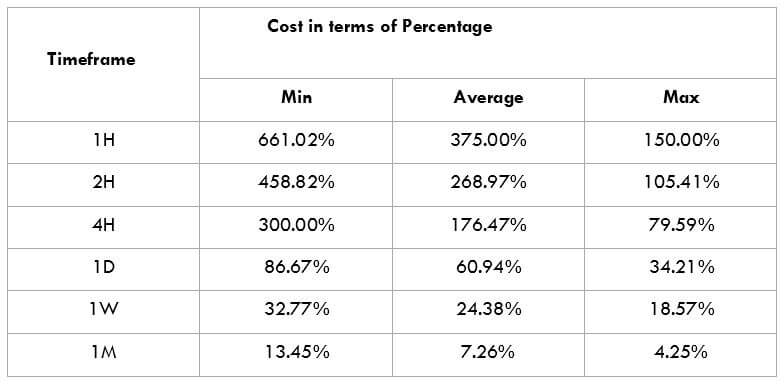
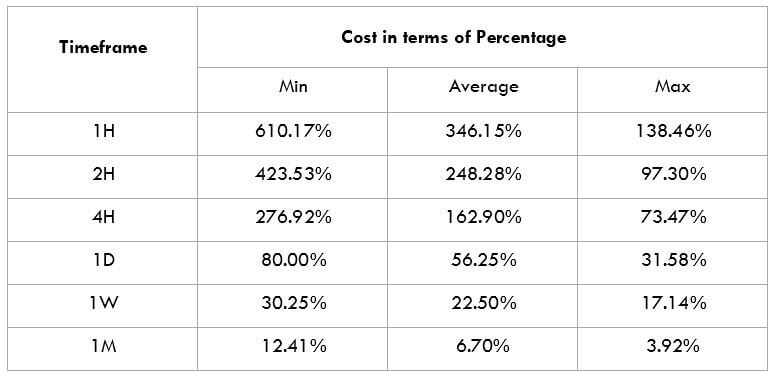
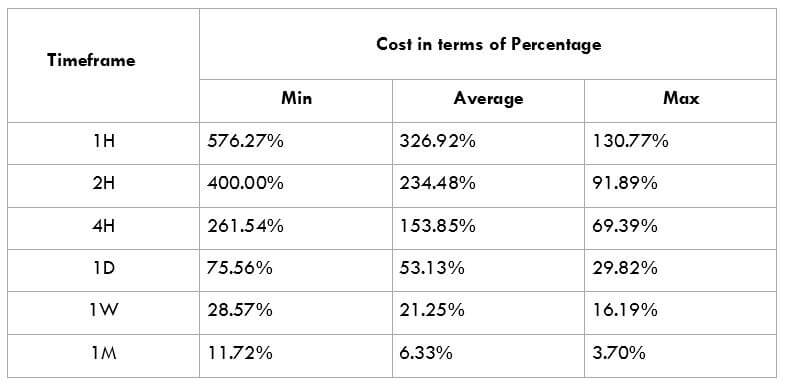
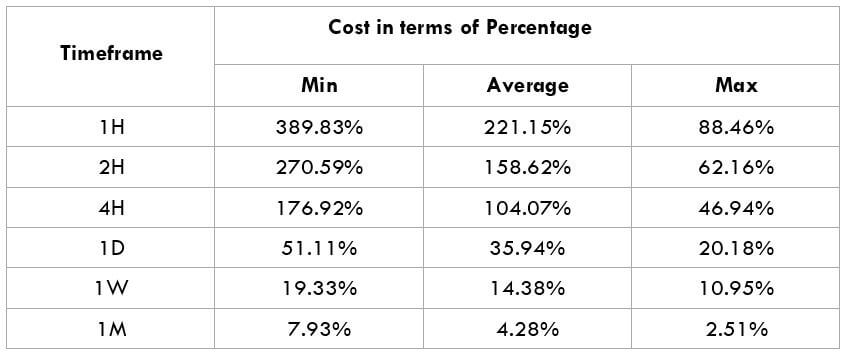
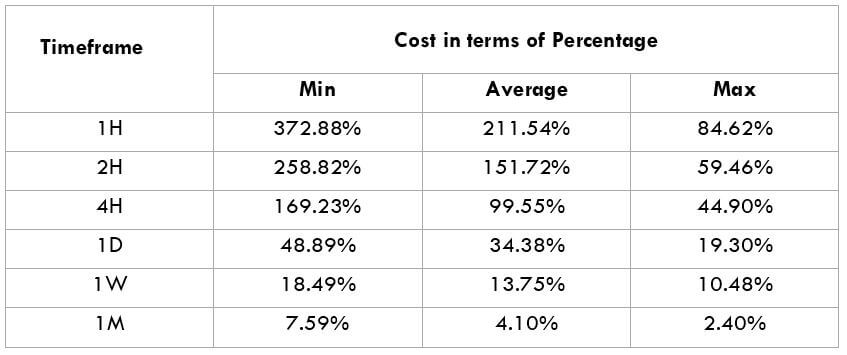
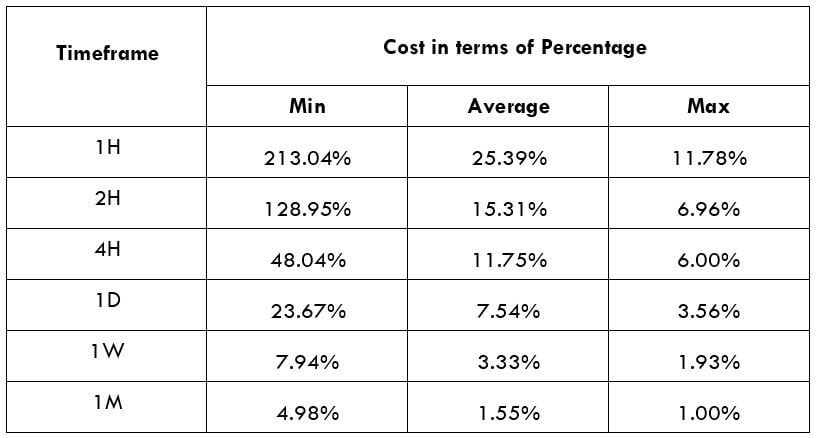
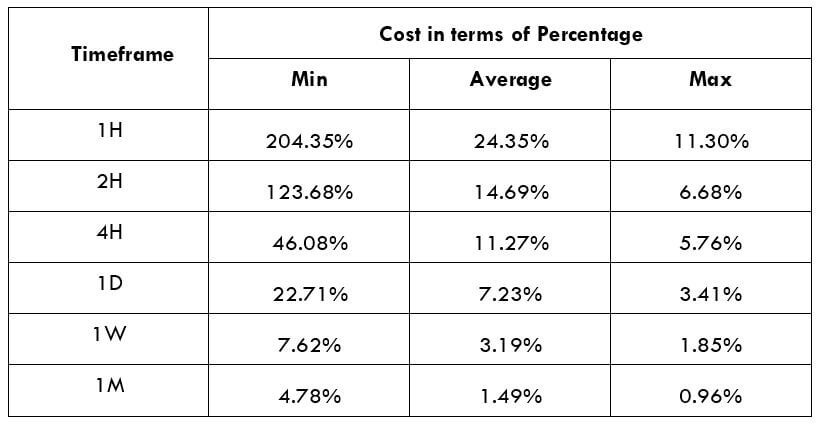
GBP/BRL Cost as a Percent of the Trading Range

The cost of trade depends on the broker type and varies based on market volatility. The total cost of trade involves spreads and slippage apart from the trading fee.

ECN Model Account

Spread = 41 | Slippage = 3 |Trading fee = 5

Total cost = Slippage + Spread + Trading Fee = 3 + 41 + 5 = 49
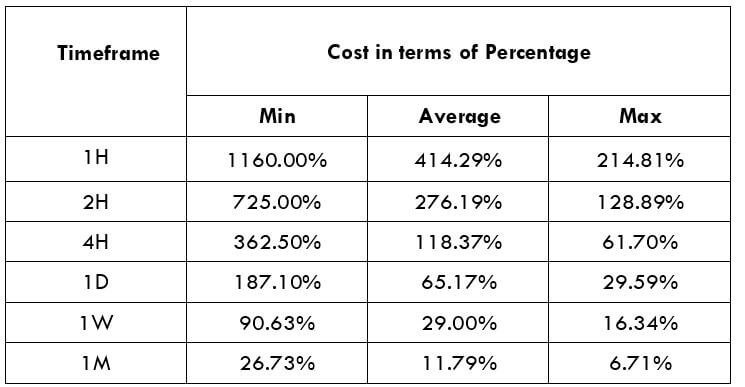
STP Model Account

Spread = 44| Slippage = 3 | Trading fee = 0

Total cost = Slippage + Spread + Trading Fee = 3 + 44 + 0 = 47

Trading the GBP/BRL

There are a few currencies that are hardly traded in the foreign exchange market. These currencies are called exotic-cross currency pairs, and the GBP/BRL is one such exotic pair.

These pairs have less market depth, less volume, and are also illiquid. GBP/BRL is a trending market. Further, the average pip movement on the 1H timeframe is 198 pips, which is considered to be volatile. Higher the volatility, lower is the cost on a trade. However, this should not be considered an advantage as it is risky to trade in highly volatile markets.

Let’s take, for example, in the 4H time frame. The Maximum pip range value is 816, and the minimum is 102. When the comparison of the fees for both the pip movements is made, we find that for 102pip movement, fess is 46.08%. But for the 816pip movement, fess is only 5.76%.

So, we can confirm that the prices are higher for low volatile markets and low for highly volatile markets. We recommend trading when the volatility is around the average values. Experienced traders who strictly follow money management can trade in a highly volatile market.

Categories
Forex Assets

Analyzing GBP/BGN Exotic Pair & Comprehending The Costs Involved

Introduction

GBP stands for the British pound sterling, which is sometimes also known as the Pound. It is the 4th most traded currency in the Foreign Exchange market after USD, EURO and YEN. Whereas, BGN is the abbreviation of the Bulgarian lev, and it is the official currency of Bulgaria.

Understanding GBP/BGN

In Forex, the currencies are traded in pairs. In this case, GBP is the base currency, and BGN is the quote currency. Generally, if the value of the base currency goes up, the value of the quote currency goes down and vice versa. The market value of GBP/BGN determines the strength of BGN against GBP. It can be easily comprehended as 1GBP is equal to how much of BGN. So, if the exchange rate of GBP/BGN is 2.2409, to buy 1GBP, we need 2.2409 BGN.

Spread

Spread is the athematic difference between the bid and ask prices. Here, the bid is the selling price, whereas ask is the buying price of the currency pair. So basically, the spread is a type of commission brokers make for the services they provide. Below are the ECN and STP spread values for the pair GBP/BGN.

ECN: 19 pips | STP: 22 pips

Fees

It is obvious that we need to pay some commission to the broker every time we place a trade. A Fee is simply that commission we pay to the broker for opening a particular position. This fee varies from the type of broker we use. For example, there is no fee charged for STP account models, whereas a few pips are charged by ECN brokers.

Slippage

Slippage is referred to as the difference between the expected price at which the trader wants to buy/sell a currency pair and the price at which the trade is executed in real-time. It is important to know that slippage can occur at any time. However, it mostly happens when the market is extremely volatile.

Trading Range in GBP/BGN

Whether we make a profit or loss in a given time period depends on the movement of a currency pair. This can be assessed using the trading range table that is given below. It is basically a representation of the min, avg, and the maximum pip movement in a Forex currency pair. Evaluating the volatility of the market before taking the trade is the most important thing to do. The trading range here is to measure the volatility of the GBP/BGN pair.

Procedure to assess Pip Ranges

  1. Add the ATR indicator to your chart
  2. Set the period to 1
  3. Add a 200-period SMA to this indicator
  4. Shrink the chart so you can assess a significant period
  5. Select your desired timeframe
  6. Measure the floor level and set this value as the min
  7. Measure the level of the 200-period SMA and set this as the average
  8. Measure the peak levels and set this as Max.

GBP/BGN Cost as a Percent of the Trading Range

Most of the time, the cost of trade depends on the type of broker we choose. This varies based on the market’s volatility. The total cost involves the costs incurred from slippage and spreads along with the trading fee. Below we have discussed the cost variation in terms of percentages. Let’s look into both the ECN and the STP models.

ECN Model Account

Spread = 19 | Slippage = 3 |Trading fee = 5

Total cost = Slippage + Spread + Trading Fee = 3 + 19 + 5 = 27

STP Model Account

Spread = 22| Slippage = 3 | Trading fee = 0

Total cost = Slippage + Spread + Trading Fee = 3 + 22 + 0 = 25

Trading the GBP/BGN

The GBP/BGN is an exotic-cross currency pair and is a low volatile market. As seen in the Range table, the average pip movement on the 1-hour time frame is only 36. This clearly shows that if we trade this pair, we will have to wait for a more extended period to get some good profit as the pip movement is very less.

On any given day, if the market volatility is high, the cost of the trade is lower and vice-versa. However, this shouldn’t be considered as an advantage always because more the volatility, the riskier is our trade.

For instance, in the 1M time frame, the maximum pip range value is 1559, and the minimum is 336. When we compare the fees for both the pip movements, we find that 8.04% is the fee for the former, and it is only 1.73% for the latter. Hence we can infer that the prices are higher for low volatile markets and low for highly volatile markets.

Categories
Forex Assets

Exploring The GBP/XPF Exotic Forex Currency Pair

Introduction To GBP/XPF

The abbreviation of GBP/XPF is British Pound vs. the French Pacific Franc. Here GBP is the official currency of the United Kingdom, and many others, it is also proven to be the fourth most traded currency in the forex market after USD, EURO, and JPY. In contrast, The CFP franc is the currency used in French overseas.

Understanding GBP/XPF

We know that in currency pairs, the first currency is the base currency, and the second currency is the quote currency. Here, the market value of GBP/XPF helps us to understand the strength of XPF against the GBP. So let’s take if the exchange rate for the pair GBP/XPF is 135.984, it means we need 135.984 XPF to buy 1 GBP.

Spread

We have two different prices for currency pairs in forex, the bid and ask price. Here the “bid” price at which we can SELL the base currency, and The “ask” price is at which we BUY the base currency. The difference between the ask price and the bid price is called the spread. Below is the spread for ECN and STP broker for the GBP/XPF pair.

ECN: 52 pips | STP: 55 pips

Fees

A Fee in forex is simply the commission we need to pay to the broker for opening a particular position. The fees depend on the type of broker we use. Like for example, we don’t have any fees for ECN, but we have some for STP.

Slippage

Slippage is the difference between the trader’s anticipated price and the actual price at which the trade is executed. It mostly occurs when the volatility of the currency pair is high and also, sometimes, when a large number of orders are placed at the same time.

Trading Range in GBP/XPF

Volatility is an essential factor that every trader should take into consideration before entering the market. The amount of capital we will win or lose in a given amount of time can be evaluated using the trading range table. Here, the trading range is a representation of the minimum, average, and maximum pip movement in a currency pair. This can be evaluated simply by using the ATR indicator combined with 200-period SMA.

Procedure to assess Pip Ranges

  1. Add the ATR indicator to your chart
  2. Set the period to 1
  3. Add a 200-period SMA to this indicator
  4. Shrink the chart so you can assess a significant period
  5. Select your desired timeframe
  6. Measure the floor level and set this value as the min
  7. Measure the level of the 200-period SMA and set this as the average
  8. Measure the peak levels and set this as Max.

GBP/XPF Cost as a Percent of the Trading Range

The cost of trade depends mostly on the broker and also varies based on the volatility of the market. We have various costs involved in the overall trading cost that includes slippage, spreads, and sometimes the trading fee. Below is the calculation of the cost variation in terms of percentages. The conception of it is discussed in the following sections.

ECN Model Account

Spread = 52 | Slippage = 3 |Trading fee = 5

Total cost = Slippage + Spread + Trading Fee = 3 + 52 + 5 = 60

STP Model Account

Spread = 55| Slippage = 3 | Trading fee = 0

Total cost = Slippage + Spread + Trading Fee = 3 + 55 + 0 = 58

Trading the GBP/XPL

There are some currencies that are very less traded in the foreign exchange market. These currencies are called exotic-cross currency pairs. GBP/XPL is one such exotic currency pairs. Further, the average pip movement on the 1H timeframe is only 14 pips, which is considered to be very less volatile.

We also have to note that if we trade in a low volatile market, our trading will be very expensive. However, It is recommended to trade in a currency pair with medium volatility. To comprehend this better, we will try to understand this with the help of an example.

As we can see in the 1M time frame, the Maximum pip range value is 865, and the minimum is 217. Now when we compare the trading cost in accordance with the pip movement, we note that in 217pip movement fess is 26.73%, and for 865pip movement, fess is only 6.71%. So overall we can conclude that trading this pair will be very expensive.

Categories
Forex Assets

Analyzing The GBP/SAR Exotic Currency Pair

Introduction

In the Forex market, currencies are traded in pairs, and one currency is always quoted against the other. The abbreviation of GBP/SAR is British Pound Saudi Riyal. Here, the first currency GBP is the base currency, and the second one SAR is the quote currency.

Understanding GBP/SAR

We compare the value of one currency to another, and hence when we buy a currency pair, we are essentially buying the base currency and selling the quote currency. The market value of GBP/SAR determines the strength of SAR against the GBP, so if the exchange rate for the pair GBP/SAR is 4.7167, it means we need 4.7167 SAR to buy 1 GBP.

Spread

Trading the Forex market usually does not involve in spending a lot of commissions like the Stock market. Here, Forex brokers make a profit through spreads. The difference between the Bid and the Ask prices of an asset is called the spread. Some broker has the cost inbuilt into the buy and sell prices of the currency pair we want to trade instead of charging a separate fee. Below are the spread values of ECN and STP brokers for the GBP/SAR pair.

ECN: 40 pips | STP: 44 pips

Fees

A Fee is simply the charges we pay to the broker for executing a particular trade. The fee varies from the type of broker we use. For example, the fee on the STP account model is zero, but we can expect a few pips on ECN accounts.

Slippage

Slippage is the implementation of a trade at a price different from that requested by a trader. Slippage can either be positive (be additional profit) or negative (additional loss) and Mostly occurs when the market is volatile.

Trading Range in GBP/SAR

The trading range is used here is to measure the volatility of the GBP/SAR pair. The amount of money we will win or lose in a given amount of time can be assessed using the trading range table. The minimum, average, and maximum pip movement of the currency pair is represented in the trading range. This can be evaluated simply by using the ATR indicator combined with 200-period SMA.

Procedure to assess Pip Ranges

  1. Add the ATR indicator to your chart
  2. Set the period to 1
  3. Add a 200-period SMA to this indicator
  4. Shrink the chart so you can assess a significant period
  5. Select your desired timeframe
  6. Measure the floor level and set this value as the min
  7. Measure the level of the 200-period SMA and set this as the average
  8. Measure the peak levels and set this as Max.

GBP/SAR Costs as a Percent of the Trading Range

The cost of trade depends on the broker and differs according to the volatility of the market. This is because the trading cost includes slippage, fees, and the spread. The cost of variation in terms of percentage is given below. We will look into both the ECN model and the STP model.

ECN Model Account

Spread = 40 | Slippage = 3 |Trading fee = 5

Total cost = Slippage + Spread + Trading Fee = 3 + 40 + 5 = 48

STP Model Account

Spread = 44| Slippage = 3 | Trading fee = 0

Total cost = Slippage + Spread + Trading Fee = 3 + 44 + 0 = 47

Trading the GBP/SAR Forex pair

The GBP/SAR is an exotic-cross currency pair and is a low volatile market. Looking at the pip range table, the average pip movement on the 1H timeframe is only 62 pips. Hence, The volatility of this currency pair is on the lower side. We know that the higher the volatility, the lower will be the cost to execute the trade. However, this is not an advantage as trading in a volatile market involves more risk.

Let’s take, for example, in the 1M time frame, the Maximum pip range value is 3952, and the minimum is 896. When we compare the trading fees for both the pip movements, we note that for 896pip movement fess is 5.36%, and for 3952pip movement, fess is only 1.21%. As we can conclude from the above example, trading the GBP/SAR currency pair will be a bit expensive.

Categories
Forex Assets

Exploring The GBP/ILS Forex Exotic Currency Pair

Understanding GBP/ILS

GBP/ILS is the abbreviation for the Pound sterling against the Israeli Shekel. In currency pairs, the first currency GBP here is the base currency and the second currency ILS is the quote currency. In Forex currency pairs, if the value of, let’s say, the base currency goes up, the quote currency’s value will go down and vice versa.

Also, when we buy a currency pair, we buy the base currency and implicitly sell the quote currency. The market value of GBP/ILS determines the strength of ILS against the GBP that can be understood as 1 Pound is equal to how much ILS. So if the conversion rate for the pair GBP/ILS is 4.4725, it means to buy 1 GBP, we need 4.4725 ILS.

Spread

We know that the “bid” is the price at which we sell the currency, and “ask” is the price is at which we can BUY the currency. The arithmetic difference between the ask and bid price is known as the spread. The spread is how most of the brokers make money. There are also brokers who charge a separate fee instead of making profits in the form of spread. Below are the ECN and STP spreads for the GBP/ILS Forex pair.

ECN: 54 pips | STP: 56 pips

Fees

Every time we place a trade, some commission must be paid to the brokers, and that is known as a fee. This fee varies from broker to broker. For instance, there is no fee charged on STP account models, but ECN brokers do charge some fee.

Slippage

The arithmetic difference between the expected price of a trader and the price at which the trade is executed is known as slippage. It can occur mostly when the market is volatile & fast-moving. Another reason when the slippage may occur is when we place a huge number of orders at the same time.

Trading Range in GBP/ILS

The trading range here is to measure the volatility of the GBP/ILS pair. Whether we make a profit or loss in a given time period depends on the movement of a currency pair that can be assessed using the trading range table. It is a representation of the min, avg, & max pip movement in a currency pair.

Procedure to assess Pip Ranges

  1. Add the Average True Range indicator to your price chart
  2. Make sure to set the period to one
  3. Then add a 200-period Simple Moving Average to ATR
  4. Shrink the chart in order to assess a significant period
  5. Select the timeframe of your choice
  6. Floor level must be measured and set that value as the min
  7. 200-period SMA must be measured and set that value as average
  8. Finally, measure the peak levels and consider this as Max values.

GBP/ILS Cost as a Percent of Trading Range

The cost of trade depends on the broker and mostly varies based on the market’s volatility. The below tables represent the cost variation in terms of percentages.

ECN Model Account

Spread = 54 | Slippage = 3 |Trading fee = 5

Total cost = Slippage + Spread + Trading Fee = 3 + 54 + 5 = 62


STP Model Account

Spread = 56| Slippage = 3 | Trading fee = 0

Total cost = Slippage + Spread + Trading Fee = 3 + 56 + 0 = 59

Trading the GBP/ILS

The GBP/ILS is an exotic-cross currency pair and is a trending market. We consider the market to be trending when the price generally moves in one direction, either downwards or upwards. As seen in the Range table, the average pip movement on the 1-hour time frame is 112. This clearly shows that the pip movements are normal, and this currency pair is tradable.

Note that the higher the volatility, the lower is the cost of the trade. However, this is not an advantage as it is risky to trade highly volatile markets. Let’s take, for example, in the 1M time frame, the Maximum pip range value is 3469, and the minimum is 1080. When we compare the fees for both the pip movements, we find that for 1080pip movement fess is 5.74%, and for 3469pip movement, fess is only 1.79%.

So, we can confirm that the prices are higher for low volatile markets and low for highly volatile markets. It is recommended to trade when the market volatility is around the average values, but experienced traders who strictly follow money management can trade in a volatile market. The volatility here is moderate, and the costs are a little high compared to the maximum values. But, if our priority is towards reducing costs, we may trade when the volatility of the market is around the maximum values.

Categories
Forex Assets

Asset Analysis – Exploring The GBP/AED Forex Currency Pair

Introduction

We all know that official currencies of the two countries are paired for being exchanged in reference to each other. In GBP/AED, GBP stands for the British pound sterling, and it is is the official currency of the United Kingdom. It is also the 4th most traded currency in the Forex Market and stands right after USD, EURO and YEN. Whereas the AED is known as the United Arab Emirates Dirham, and it is the official currency of the UAE.

GBP/AED

GBP/AED is the abbreviation of the Pound sterling against the Emirati Dirhams. In currency pairs, the first currency is the base currency, while the second currency is the quote currency. In this case, GBP is the base currency, and AED is the quote currency.

Understanding GBP/AED

In the Forex market, if the base currency’s value goes down, the value of the quote currency goes up and vice versa. Also, when we buy a currency pair, we buy the base currency and implicitly sell the quote currency.

The market value of GBP/AED determines the strength of AED against the GBP that can be easily understood as 1GBP is equal to how much AED. So if the exchange rate for the pair GBP/AED is 4.5748, it means that we need 4.5748 AED to buy 1 GBP.

Spread

Forex brokers have two different prices for currency pairs: the bid and ask price. The bid price is the selling price, and ask is the buy price. The difference between the ask and the bid price is called the spread. Spread is basically a type of commission by which brokers make their money. Below are the ECN and STP spread values for the GBP/AED pair.

ECN: 27 pips | STP: 30 pips

Fees

Each time we place a trade, we need to pay some commission on it. A Fee is simply that commission we pay to the broker for opening a particular position. The fee also varies from the type of broker we use; for example, there is no fee on STP account models, but a few pips on ECN accounts.

Slippage

Slippage refers to the difference between the trader’s expected price and the actual price at which the trade is executed. It can occur at any time but mostly happens when the market is fast-moving and volatile. Also, it occurs at the times when we place a large number of orders at the same time.

Trading Range in GBP/AED

The trading range here is to measure the volatility of the GBP/AED pair. Whether we make a profit or loss in a given time period depends on the movement of a currency pair that can be assessed using the trading range table. It is a representation of the minimum, average, and maximum pip movement in a currency pair. This can be evaluated simply by using the ATR indicator combined with 200-period SMA.

Procedure to assess Pip Ranges

  1. Add the ATR indicator to your chart
  2. Set the period to 1
  3. Add a 200-period SMA to this indicator
  4. Shrink the chart so you can assess a significant period
  5. Select your desired timeframe
  6. Measure the floor level and set this value as the min
  7. Measure the level of the 200-period SMA and set this as the average
  8. Measure the peak levels and set this as Max.

GBP/AED Cost as a Percent of the Trading Range

The cost of trade mostly depends on the broker and varies based on the volatility of the market. This is because the total cost involves slippage and spreads apart from the trading fee. Below is the representation of the cost variation in terms of percentages. The comprehension of it is discussed in the following sections. We will look into both the ECN model and the STP model.

ECN Model Account

Spread = 27 | Slippage = 3 |Trading fee = 5

Total cost = Slippage + Spread + Trading Fee = 3 + 27 + 5 = 35

STP Model Account

Spread = 30| Slippage = 3 | Trading fee = 0

Total cost = Slippage + Spread + Trading Fee = 3 + 30 + 0 = 33

Trading the GBP/AED

The GBP/AED is an exotic-cross currency pair and is mostly ranging. The volatility of this currency pair is on the lower side. As seen in the Range table, the average pip movement on the 1-hour time frame is only 64. This clearly shows that if we trade in this pair, we will have to wait for a more extended period of time to get some good profit because of such a less movement in the pips.

Note that the higher the volatility, the lower the cost of the trade. However, this is not an advantage as it is risky to trade highly volatile markets. Let’s take, for example, in the 1M time frame, the Maximum pip range value is 3825, and the minimum is 923. When we compare the fees for both the pip movements, we find that for a 923 pip movement, the fee is 3.79%, and for 3825pip movement, fess is only 1.07%.

So, we can confirm that the prices are higher for low volatile markets and low for highly volatile markets. It is safe to trade when the volatility is around the average values, but experienced traders who strictly follow money management can trade the volatile markets as the cost of trade is less there. Cheers!

Categories
Forex Assets

Analyzing The GBP/TWD Forex Currency Pair

Introduction to GBP/TWD

GBP stands for British pound sterling, and it is typically known as Pound. It is the official currency of the United Kingdom and some other countries like Jersey, South Georgia, and Guernsey. The pound is also the 4th most traded currency in the foreign exchange after USD, EUR & YEN. Whereas TWD is the abbreviation of The New Taiwan dollar. The central bank of Taiwan issues this currency.

GBP/TWD

Currency pairs are the national currencies from two countries coupled for being exchanged in reference to each other. In the Forex market, one currency is always quoted against the other. GBP/TWD is the abbreviation for the Pound sterling against the New Taiwan dollar. In this case, the first currency(GBP) is the base currency, and the second(TWD) is the quote currency.

Understanding GBP/TWD

In Forex, to find out the relative value of one currency, we need another currency to compare. If the value of the base currency goes down, the value of the quote currency goes up and vice versa. The market value of GBP/TWD determines the strength of TWD against the GBP. This can be easily understood as 1GBP is equal to how much of TWD. So if the exchange rate for the pair GBP/TWD is 37.093, it means we need 37.093 TWD to buy 1 GBP.

Spread

Forex brokers have two different prices for currency pairs: the bid and ask price. The bid price is the selling price, and ask is the buy price. The difference between the ask and the bid price is called the spread. Spread is basically a type of commission by which brokers make their money. Below are the ECN and STP for the pair GBP/TWD.

ECN: 49 pips | STP: 52 pips

Fees

Each time we place a trade, we need to pay some commission on it. A Fee is simply that commission we pay to the broker for opening a particular position. The fee also varies from the type of broker we use; for example, there is no fee on STP account models, but a few pips on ECN accounts.

Slippage

Slippage refers to the difference between the trader’s expected price and the actual price at which the trade is executed. It can occur at any time but mostly happens when the market is fast-moving and volatile. Also, sometimes when we place a large number of orders at the same time.

Ranges in GBP/TWD

The Range is a measure of volatility. It tells how much the currency pair has moved in a determined period. Whether a trader makes a profit or loss in a given time period depends on the movement of a currency pair and can be determined using the trading range table. It is a representation of the minimum, average, and maximum pip movement in a currency pair. This can be evaluated simply by using the ATR indicator combined with 200-period SMA.

Procedure to assess Pip Ranges

  1. Add the ATR indicator to your chart
  2. Set the period to 1
  3. Add a 200-period SMA to this indicator
  4. Shrink the chart so you can assess a significant period
  5. Select your desired timeframe
  6. Measure the floor level and set this value as the min
  7. Measure the level of the 200-period SMA and set this as the average
  8. Measure the peak levels and set this as Max.

GBP/TWD Cost as a Percent of the Trading Range

The cost of trade mostly depends on the broker and varies based on the volatility of the market. This is because the total cost involves slippage and spreads apart from the trading fee. Below is the representation of the cost variation in terms of percentages. The comprehension of it is discussed in the following sections. We will look into both the ECN model and the STP model.

ECN Model Account

Spread = 49 | Slippage = 3 |Trading fee = 5

Total cost = Slippage + Spread + Trading Fee = 3 + 49 + 5 = 57

STP Model Account

Spread = 52| Slippage = 3 | Trading fee = 0

Total cost = Slippage + Spread + Trading Fee = 3 + 52 + 0 = 55

Trading the GBP/TWD Forex Pair

The GBP/TWD is an exotic-cross currency pair and is a ranging market. A market is said to be ranging when the price hits the support and resistance at least three times. As seen in the Range table, the average pip movement on the 1-hour time frame is only 47. This clearly shows that if we trade in this pair, we will have to wait for a more extended period of time to get some good profit because of such a less movement in the pips.

Here in GBP/TWD, TWD is considered to be an emerging currency. Note that the higher the volatility, the lower is the cost of the trade. However, this is not an advantage as it is risky to trade highly volatile markets.

For example, in the 1M time frame, the maximum pip range value is 3009 and in minimum pip range, the value is 687. When we compare the fees for both the pip movements, we find that for 687 pip movement fees is 8.30%, and for 3009pip movement, fess is only 1.89%.

So, we can infer that the cost of trade is higher in the low volatile markets and high in the highly volatile markets. It is recommended to trade when the volatility is around the minimum values. The volatility here is low, and the costs are a little high compared to the average and the maximum values. But, if our priority is not towards reducing costs, we may trade when the volatility of the market is around the maximum values.

Categories
Forex Assets

Exploring The GBP/HKD Forex Exotic Currency Pair

Introduction

GBP Pound sterling, also known as the pound, is the official currency of the United Kingdom and many others. It is one of the oldest currencies and is further divided into pence. Where in HKD is known as Hong Kong Dollar, and it is the official currency of Hong Kong. One HKD is divided into 100 cents.

GBP/HKD is the abbreviation for the Pound sterling against the Hong Kong Dollar. Here, the first currency (GBP) is the base, and the second currency (HKD) is the quote currency. It is classified as an exotic-cross currency pair.

Understanding GBP/HKD

In Forex, to find out the relative value of one currency, we need another money to compare. The market value of GBP/HKD determines the strength of HKD against the GBP, i.e., It can simply be understood as 1GBP is equal to how much HKD, so if the exchange rate for the pair GBPHKD is 9.254. It means that we need 9.254 HKD to buy 1 GBP. If the value of the base currency goes down, the value of the quote currency goes up and vice versa.

Spread

Forex brokers have two different prices for currency pairs: the bid and ask price. The bid price is the selling price, and ask is the buy price. The difference between the ask and the bid price is called the spread. The spread is how brokers make their money. For this currency pair, the spread values for ECN & STP brokers are as follows.

ECN: 33 pips | STP: 36 pips

Fees

A Fee is simply the commission we pay to the broker on each position we open. There is no fee on STP account models, but a few pips on ECN accounts.

Slippage

Slippage refers to the difference between the trader’s expected price and the actual price at which the trade is executed. It can occur at any time, but it mostly happens when market orders are placed during high volatile conditions. It may also occur when large orders are placed at a time.

Trading Range in GBP/HKD

The amount of money we win or lose in a given amount of time can be assessed using the trading range table. The following table is a representation of the minimum, average, and maximum pip movement in a currency pair. This can be assessed very easily by using the Average True Range (ATR) indicator combined with 200-period SMA.

Procedure to assess Pip Ranges

  1. Add the ATR indicator to your chart
  2. Set the period to 1
  3. Add a 200-period SMA to this indicator
  4. Shrink the chart so you can assess a large time period
  5. Select your desired timeframe
  6. Measure the floor level and set this value as the min
  7. Measure the level of the 200-period SMA and set this as the average
  8. Measure the peak levels and set this as Max.

GBP/SGD Cost as a Percent of the Trading Range

The cost of trade varies based on the volatility of the market. This is because the total cost involves slippage and spreads apart from the trading fee. Below is the representation of the cost variation in terms of percentages. The comprehension of it is discussed in the coming sections.

ECN Model Account

Spread = 33 | Slippage = 3 |Trading fee = 5

Total cost = Slippage + Spread + Trading Fee = 3 + 15 + 5 = 41

STP Model Account

Spread = 36 | Slippage = 3 | Trading fee = 0

Total cost = Slippage + Spread + Trading Fee = 3 + 19 + 0 = 39

Trading the GBP/HKD Currency Pair

The GBPHKD is an exotic-cross currency pair and is a normal ranging market. For instance, the average pip movement on the 1H timeframe is only 49 pips. Note that the higher the volatility, the lower is the cost of the trade. However, this is not an advantage as it is risky to trade highly volatile markets.

Also, the larger/smaller the percentages, the higher/lower are the costs on the trade. So, we can infer that the costs are higher for low volatile markets and high for highly volatile markets. To reduce our risk, it is recommended to trade when the volatility is around the minimum values. The volatility here is low, and the costs are a little high compared to the average and the maximum values. But, if your priority is towards reducing costs, you may trade when the volatility of the market is around the maximum values.

Advantage from Limit orders

When orders are executed as market orders, there is slippage on the trade. But, with limit orders, there is no slippage as such. Only trading fees and the spread will be taken into consideration to calculate the total costs. This method will bring down the cost significantly.

Categories
Forex Assets

Trading The GBP/THB Forex Exotic Pair

Introduction

GBP

Pound sterling, also know as the pound, is the official currency of the United Kingdom and many others. The Pound sterling is the oldest currency and even the fourth most-traded currency in the foreign exchange market, after the United States dollar, the euro, and the Japanese yen.

THB

Thai Bhat is the official currency of Thailand. It’s divided into 100 satangs, According to Bloomberg, the Thai baht was the world’s best-performing currency in 2018, and since then, Thai baht is the 10th most frequently used world payment currency.

GBPTHB is the abbreviation for the Pound sterling against the Thai baht. Here, the GBP is the base currency, and the THB is the quote currency. It is classified as an exotic-cross currency pair.

Understanding GBP/THB

In Forex, to find the relative value of one currency, we need another money to compare. The market value of GBPTHB determines the cost of THB that is required to buy one GBP. It can simply be understood as 1GBP is equal to how much THB, so if the exchange rate for the pair GBPTHB is 1.6894. It means that we need 38.92 THB to buy 1 GBP.

Spread

Forex brokers have two different prices for currency pairs: the bid and ask price. Here the “bid” price at which you can SELL the base currency, and The “ask” price is at which you can BUY the base currency. Hence, the difference between the ask and the bid price is called the spread. The spread is how brokers make their money. Some broker Instead of charging a separate fee for trading, they already have the fees inbuilt in the spread.

ECN: 28 pips | STP: 31 pips

Fees

A Fee is simply the commission you pay to the broker on each position you open. There is no fee on STP account models, but a few pips on ECN accounts.

Slippage

slippage refers to the difference between the trader’s expected price and the actual price at which the trade is executed. It occurs when market orders are placed during high fast-moving, highly volatile as well as when large orders are placed at a time.

 Trading Range in GBP/THB

The amount of money you will win or lose in a given amount of time can be assessed using the trading range table. This is a representation of the minimum, average, and maximum pip movement in a currency pair.

Procedure to assess Pip Ranges

  1. Add the ATR indicator to your chart
  2. Set the period to 1
  3. Add a 200-period SMA to this indicator
  4. Shrink the chart so you can assess a large time period
  5. Select your desired timeframe
  6. Measure the floor level and set this value as the min
  7. Measure the level of the 200-period SMA and set this as the average
  8. Measure the peak levels and set this as Max.

GBP/THB Cost as a Percent of the Trading Range

The cost of trade varies based on the volatility of the market. This is because the total cost involves slippage and spreads apart from the trading fee. Below is the representation of the cost variation in terms of percentages. The comprehension of it is discussed in the next sections.

ECN Model Account

Spread = 28 | Slippage = 3 |Trading fee = 5

Total cost = Slippage + Spread + Trading Fee = 3 + 28 + 5 = 36

STP Model Account

Spread = 31 | Slippage = 3 | Trading fee = 0

Total cost = Slippage + Spread + Trading Fee = 3 + 31 + 0 = 34

Trading the GBP/THB

The GBPTHB is an exotic-cross currency pair and is a normal ranging market. For instance, the average pip movement on the 1H timeframe is only 82 pips. Note that the higher the volatility, the lower is the cost of the trade. However, this is not an advantage as it is risky to trade highly volatile markets.

Also, the larger/smaller the percentages, the higher/lower are the costs on the trade. So, we can infer that the prices are higher for low volatile markets and high for highly volatile markets.

To reduce your risk, it is recommended to trade when the volatility is around the minimum values. The volatility here is low, and the costs are a little high compared to the average and the maximum values. But, if you’re priority is towards reducing costs, you may trade when the volatility of the market is around the maximum values.

Categories
Forex Assets

Trading The GBP/SGD Exotic Currency Pair

Introduction To GBP & SGD Pairs

GBP

Great Britain Pound is also known in some contexts as the pound or sterling. It is the official currency of the United Kingdom and many British overseas territories. It is subdivided into 100 pence. The Pound Sterling is the oldest currency in continuous use, and also the fourth most-traded currency in the Forex market, after the United States dollar, the euro, and the Japanese yen.

SGD

The Singapore dollar is Singapore’s official currency, and it is divided into 100 cents. This currency is the thirteenth most traded currency in the world by value.

GBPSGD is the abbreviation for the Pound sterling against the Singapore Dollar. It is classified as an exotic-cross currency pair. In this currency pair, the GBP is the base currency, and the SGD is the quote currency.

Understanding GBP/SGD

In Forex, in order to find out the relative value of one currency, we need another currency to compare. It shows how much the GBP (the base currency) is worth as measured against the SGD (quote currency). It can simply be understood as 1GBP is equal to how much SGD. So if the exchange rate for the pair GBPSGD is 1.6894. It means that one GBP costs 1.6894 SGD.

Spread

The spread is the difference between the Bid (Sell) price and the Ask (Buy) price of an asset. The spread is how brokers make their money. Some broker Instead of charging a fee for performing a trade, the cost is built as a difference between the buy and sell prices of the currency pair.

ECN: 15 pips | STP: 19 pips

Fees

A Fee is simply the commission we pay to the broker on each position we open. There is no fee on STP account models, but a few pips on ECN accounts.

Slippage

Slippage is the difference between the price at which the trader wants to execute the trade and the price at which the trade is effectively executed. Slippage can occur at any time but is mostly happens when the market is very Volatile.

Trading Range in GBP/SGD

The amount of money we will win or lose in a given amount of time can be assessed using the trading range table. This is a representation of the minimum, average, and maximum pip movement in a currency pair.

Procedure to assess Pip Ranges

  1. Add the ATR indicator to your chart
  2. Set the period to 1
  3. Add a 200-period SMA to this indicator
  4. Shrink the chart so you can assess a large time period
  5. Select your desired timeframe
  6. Measure the floor level and set this value as the min
  7. Measure the level of the 200-period SMA and set this as the average
  8. Measure the peak levels and set this as Max.

GBP/SGD Cost as a Percent of the Trading Range

The cost of trade varies based on the volatility of the market. This is because the total cost involves slippage and spreads apart from the trading fee. Below is the representation of the cost variation in terms of percentages. The comprehension of it is discussed in the coming sections.

ECN Model Account

Spread = 15 | Slippage = 3 | Trading fee = 5

Total cost = Slippage + Spread + Trading Fee = 3 + 15 + 5 = 23

STP Model Account

Spread = 19 | Slippage = 3 | Trading fee = 0

Total cost = Slippage + Spread + Trading Fee = 3 + 19 + 0 = 22

Trading the GBP/SGD currency pair

The GBPSGD is an exotic-cross currency pair and is a normal ranging market. For instance, the average pip movement on the 1H timeframe is only 62 pips. Note that the higher the volatility, the lower is the cost of the trade. However, this is not an advantage as it is risky to trade highly volatile markets.

Also, the larger/smaller the percentages, the higher/lower are the costs on the trade. So, we can infer that the costs are higher for low volatile markets and high for highly volatile markets.

To reduce the risk, it is recommended to trade when the volatility is around the minimum values. The volatility here is low, and the costs are a little high compared to the average and the maximum values. But, if you’re priority is towards reducing costs, you may trade when the volatility of the market is around the maximum values.

Also, we can take advantage of the Limit orders to reduce costs. When orders are executed as market orders, the risk of slippage always persists. But, with the help of limit orders, we can completely avoid slippage, thereby reducing the overall trading cost. When slippage is Zero, only trading fees and the spread will be taken into consideration to calculate the total costs. Hence, it brings down the cost significantly.