Introduction
CHF/SAR is the acronym for the Swiss Franc against the Saudi Riyal. It is classed as an exotic currency pair as it usually has moderate trading volume. In this case, the Swiss Franc (on the left) is the base currency, and the Saudi Riyal (on the right) is the quote currency. The SAR (Saudi Riyal) is the official currency of Saudi Arabia, and one SAR is divided into 100 halalas.
Understanding CHF/SAR
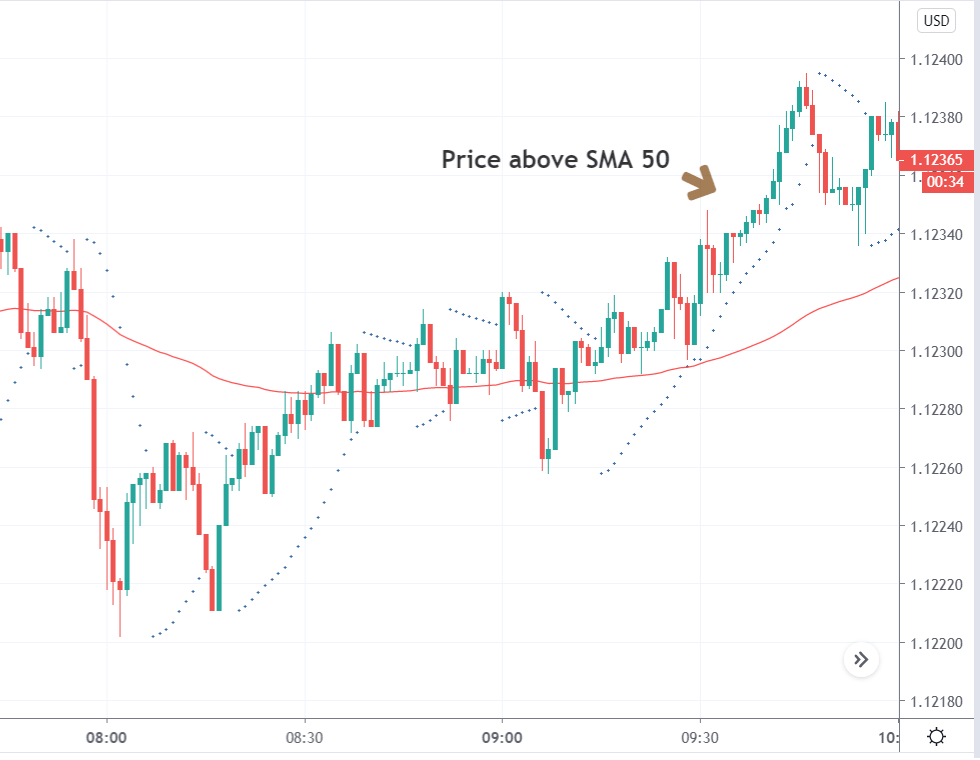
To find out the comparative value of one currency, we require an additional currency to compare. If the base currency’s value goes down, the value of the quote currency moves up and contrariwise. If the market cost of this pair is 4.0742, then this amount of SAR is required to buy one unit of CHF.
Spread
Forex brokers have two distinct prices for currency pairs, which are classified as the bid and ask price. The bid price is the offering price, and ask is the buy price. The distinction between the ask and the bid price is known as the spread. The spread is how brokers make their income. Below are the spreads for CHF/SAR currency pairs in both ECN & STP brokers.
ECN: 9 pips | STP: 14 pips
Fees
A Fee is basically the compensation we pay to the broker each time we execute a spot. There is no compensation charged on STP account models, but a few additional pips are charged on ECN accounts.
Slippage
Slippage refers to the distinction between the trader’s anticipated price and the original price at which the trade is executed. It can occur at any time but often occurs when the market is fast-phased and volatile. Also, sometimes slippage occurs when we place a large number of orders at the same time.
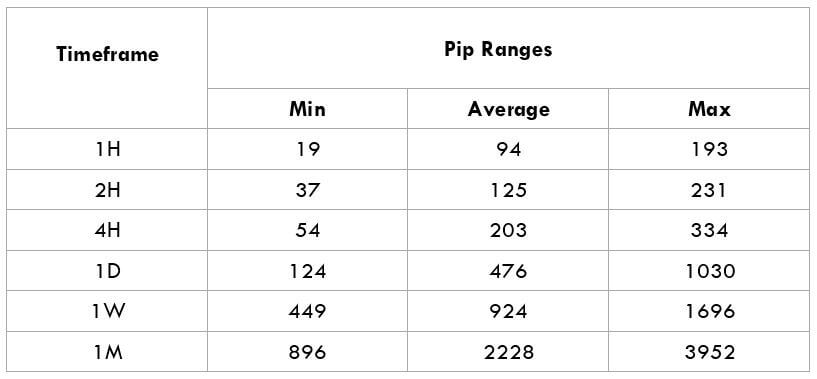
Trading Range in CHF/SAR
The amount of money we will earn or lose in a specific timeframe can be evaluated using the trading range table. It is an illustration of the minimum, average, and maximum pip movement in a currency pair. This can be assessed simply by using the ART indicator with 200-period SMA.
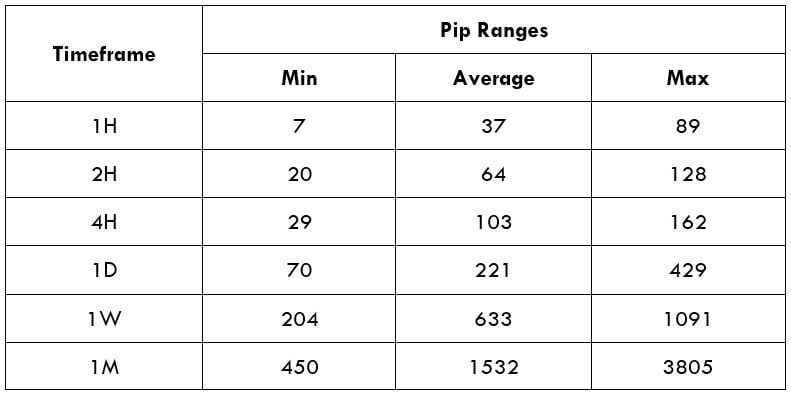
Procedure to assess Pip Ranges
- Add the ATR indicator to your chart
- Set the period to 1
- Add a 200-period SMA to this indicator
- Shrink the chart so you can assess a large time period
- Select your desired timeframe
- Measure the floor level and set this value as the min
- Measure the level of the 200-period SMA and set this as the average
- Measure the peak levels and set this as Max.
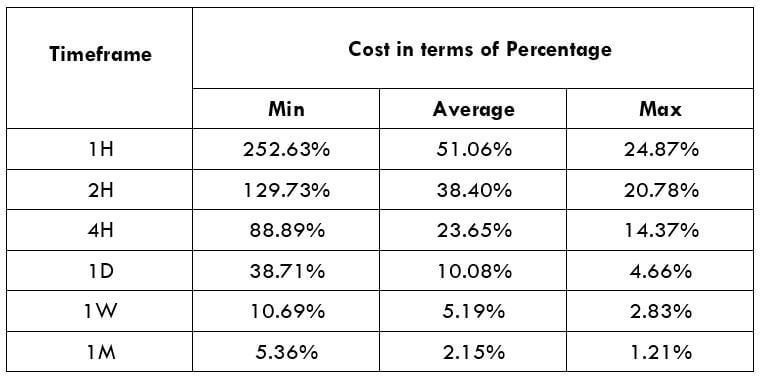
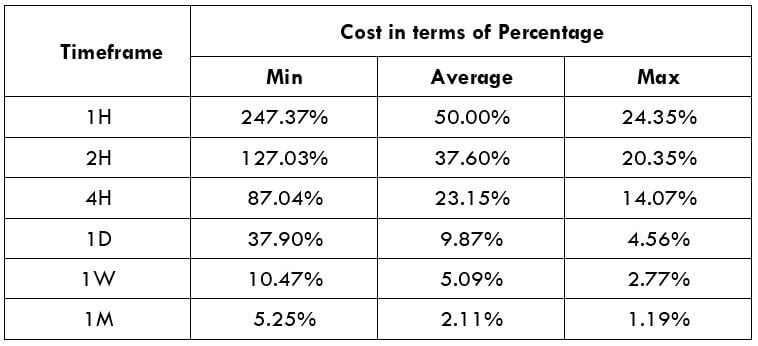
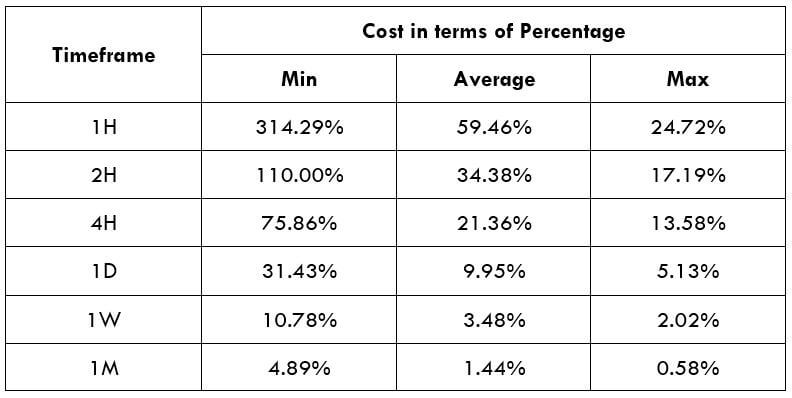
CHF/SAR Cost as a Percent of the Trading Range
The cost of trade widely varies on the broker and differs based on the volatility of the market. This is because the total cost also includes slippage and spreads, excluding the trading fee. Below is the interpretation of the cost variation in terms of percentages. The understanding of it is discussed in the subsequent sections.
ECN Model Account
Spread = 9 | Slippage = 5 |Trading fee = 8
Total cost = Slippage + Spread + Trading Fee = 5 + 9 + 8 = 22
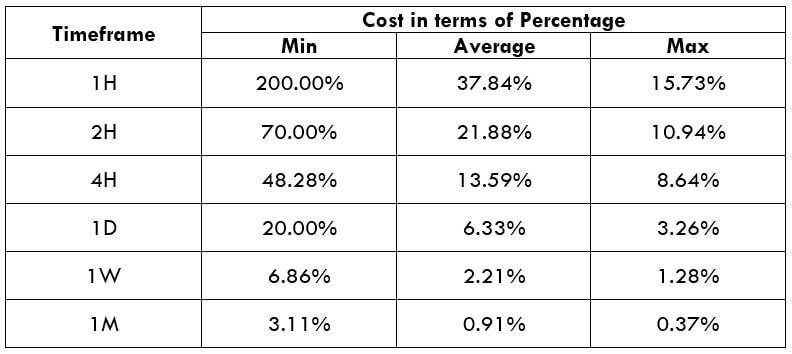
STP Model Account
Spread = 14 | Slippage = 5 | Trading fee = 0
Total cost = Slippage + Spread + Trading Fee = 5 + 14 + 0 = 19

The ideal way to trade the CHF/SAR
The CHF/SAR is an exotic-cross currency pair, and it is volatile. For example, the average pip movement on the 1H timeframe for this pair is ~37pips. From the earlier tables, it is clear that the higher the volatility, the lower is the cost of the trade. Nevertheless, this is not an added benefit, as it is risky to trade when the markets are incredibly volatile.
Trading in such timeframes will ensure low expenses just as reduced liquidity. It will also involve fewer costs by placing orders using limit/pending orders instead of market orders. This will substantially reduce the total cost with slippage being zero.
STP Model Account (Using Limit Orders)
Spread = 14 | Slippage = 0 | Trading fee = 0
Total cost = Slippage + Spread + Trading Fee = 0 + 14 + 0 = 14
While reading the above tables, if the ratios are larger, more significant are the trade costs. Likewise, if the proportions are small, lower are the costs. This can be inferred as the trading costs are more significant for low volatile markets and smaller for high volatile markets. I hope this article will support you to trade this pair in a much efficient way. Cheers!