Introduction
The abbreviation of CHF/BLR is Swiss Franc, paired with the Brazilian Real. In this pair, CHF is the native currency of Switzerland and is also the fifth vastly traded currency in the Forex market. Likewise, BRL stands for the Brazilian Real, and it is the official currency of Brazil. This is classified as an exotic Forex pair.
Understanding CHF/BRL
In the Forex market, to ascertain the relative value of one currency, we need another currency for comparison. When we buy a currency (recognized as the base currency), we are indirectly selling another currency (known as the quote currency). The market value of CHF/BRL helps us to comprehend the power of BRL against the CHF. So, if the trade rate for the pair CHF/BRL is 5.7715, it means to buy 1 CHF, we need 5.7715 BRL.
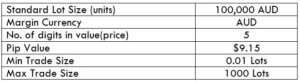
CHF/BRL Specification
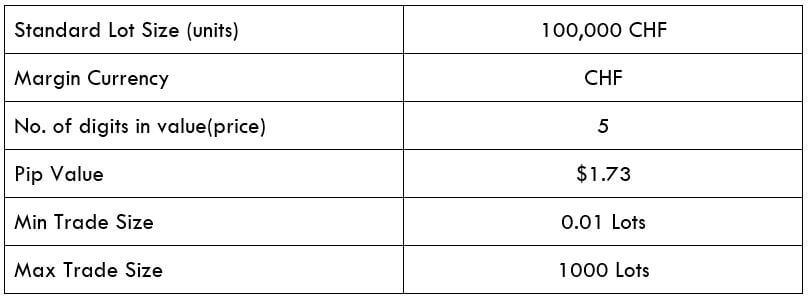 Spread
Spread is the difference among the bid-ask price that is set at the exchanges. Below are the spread values of the CHF/BRL currency pair in both ECN & STP accounts. The spread charges for ECN and STP brokers for CHF/BRL pair are as follows:
ECN: 24 | STP: 29
Fees
For every spot, a trader enters the stockbroker charges a specific fee for it. Traders must know that this fee is charged only on ECN accounts and does not apply to STP accounts.
Slippage
Slippage is the price distinction between the broker executed price and the trader execution price. The difference is caused due to the market’s high volatility and slow execution speed.
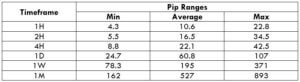
Trading Range in CHF/BRL
A trading range is the explanation of the volatility in CHF/BRL in numerous timeframes. The values are attained from the Average True Range indicator. One can use the table as a risk management tool to distinguish the profit/loss that a trader is possessed.
Below is a table indicating the minimum, average, and max pip movement in several timeframes.
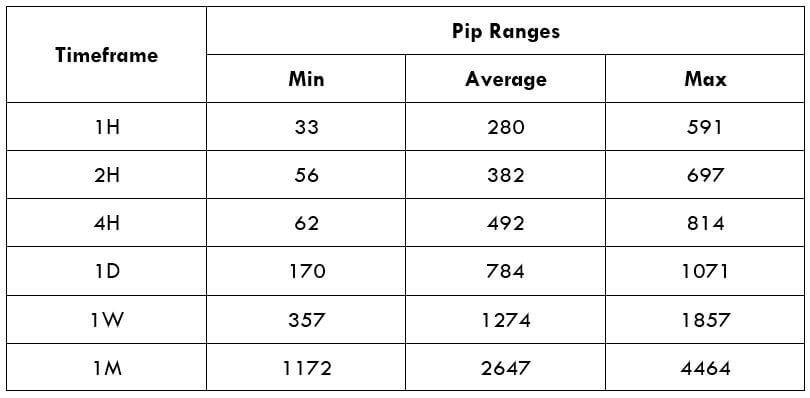
Procedure to assess Pip Ranges
- Add the ATR indicator to your chart
- Set the period to 1
- Add a 200-period SMA to this indicator
- Shrink the chart so you can assess a large time period
- Select your desired timeframe
- Measure the floor level and set this value as the min
- Measure the level of the 200-period SMA and set this as the average
- Measure the peak levels and set this as Max.
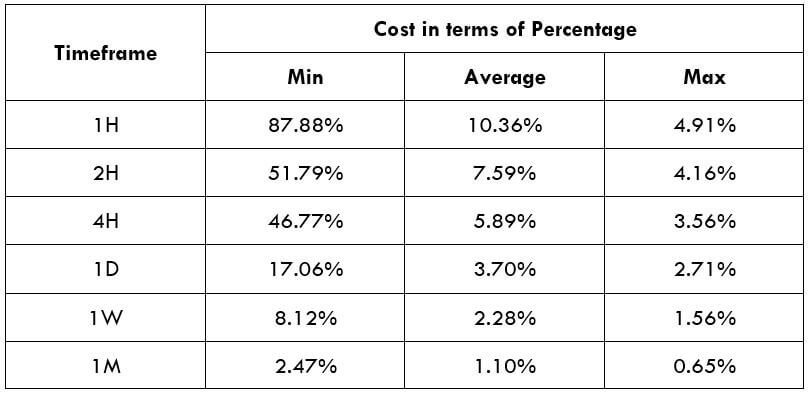
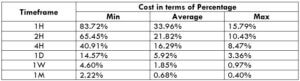
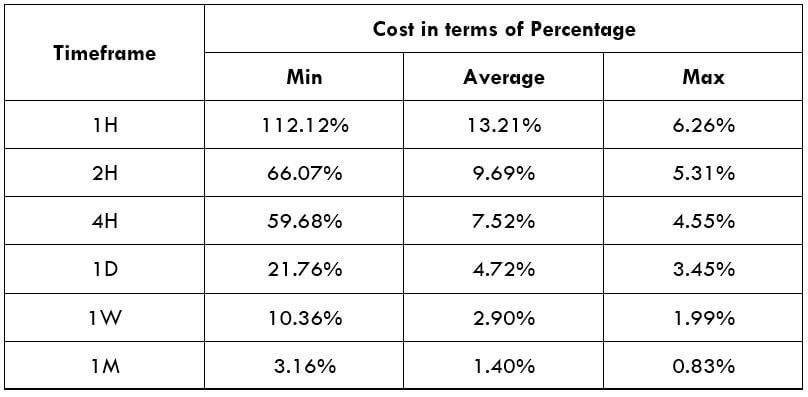
CHF/BRL Cost as a Percent of the Trading Range
The total cost of the trade changes based on the volatility of the market, hence we must number out the occasions when the costs are less to place ourselves in the market. The table below displays the variation in the costs based on the change in the market’s volatility.
Note: The ratio represents the relative scale of costs and not the fixed costs on the trade.
ECN Model Account
Spread = 24 | Slippage = 5 | Trading fee = 8
Total cost = Slippage + Spread + Trading Fee = 5 + 24 + 8= 37
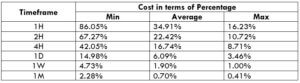
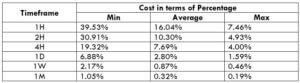
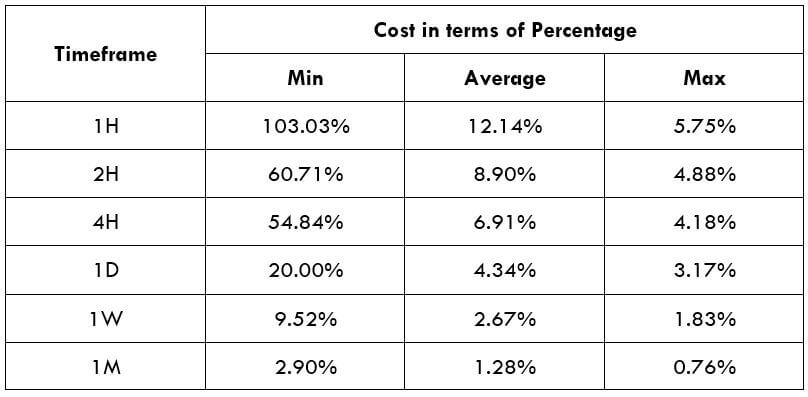
STP Model Account
Spread = 29 | Slippage = 5 | Trading fee = 0
Total cost = Slippage + Spread + Trading Fee = 5 + 29 + 0 = 34
The Ideal way to trade the CHF/BRL
With the help of the above tables, let us assess these two factors to the trade the CHF/BRL. Volatility and cost are two elements a trader must consider for trading any security in the Forex market.
In various timeframes, we can see the pip movement being very high between the minimum volatility and the average volatility. As a day trader, the aim is to make profits from the pip variation in the market. It becomes tricky to extract some profits from the market if there are no variations in the pip value.
When the cost goes higher, the volatility of the market decreases. In other words, the market with high volatility have minimal costs. To strike a balance between the volatility and the cost, traders should find an appropriate time when the volatility is close to the average values or slightly about it.
Additionally, traders can also reduce their total costs by placing ‘limit orders’ instead of ‘market orders.’ This will ultimately cut the slippage on the trade and consequently lower the total cost. In the below example, the total cost would decrease by five pips, which is a modest reduction for just altering the type of order execution.
STP Model Account (With Limit Orders)
Total cost = Slippage + Spread + Trading Fee = 0 + 29 + 0 = 29