Introduction
The global macro analysis of the USD/CAD pair involves the analysis of both the endogenous and exogenous factors inherent for both currencies. For this analysis, we’ll focus on analyzing those factors, which significantly impact both these currencies.

Endogenous factors are the fundamental economic factors that drive the GDP and economic growth in a country. These factors include fundamental economic indicators unique to a particular country. Note that although the fundamental economic indicators primarily drive an economy’s GDP, they can also be used to predict interest rate policies that impact the value of a currency. Therefore, we will analyze the endogenous factors that affect both the USD and the CAD.
Exogenous factors are the economic factors that define the relationship between these two currencies.
Ranking Scale
The endogenous factors are ranked on a sliding scale from -10 to +10; it shows their inflationary and deflationary impact on the respective currencies. This ranking scale is determined by the YTD change of the fundamental indicator being reviewed.

In this article, let’s first analyze the Endogenous factors that affect our base currency, that is, the USD.
USD Endogenous Analysis – Summary
While analyzing the endogenous factors affecting the USD, we have focused only on the indicators that significantly impact the economy. Due to the US’s coronavirus-induced economic recession, we can expect a net deflationary impact on the USD. The USD endogenous factors recorded a score of -19.1, implying a deflationary effect on the USD. This essentially means that according to these indicators, the USD has lost its value since the beginning of this year.

Unemployment rate
In the US, the rate of unemployment is used to determine the total percentage of the workforce that is actively looking for gainful employment.

The changes in the unemployment rate are also used to gauge the US economic recovery during the coronavirus pandemic. Reduction in the unemployment rate means that the economy is rebounding since we can deduce that when more companies resume operations, more workers are employed.
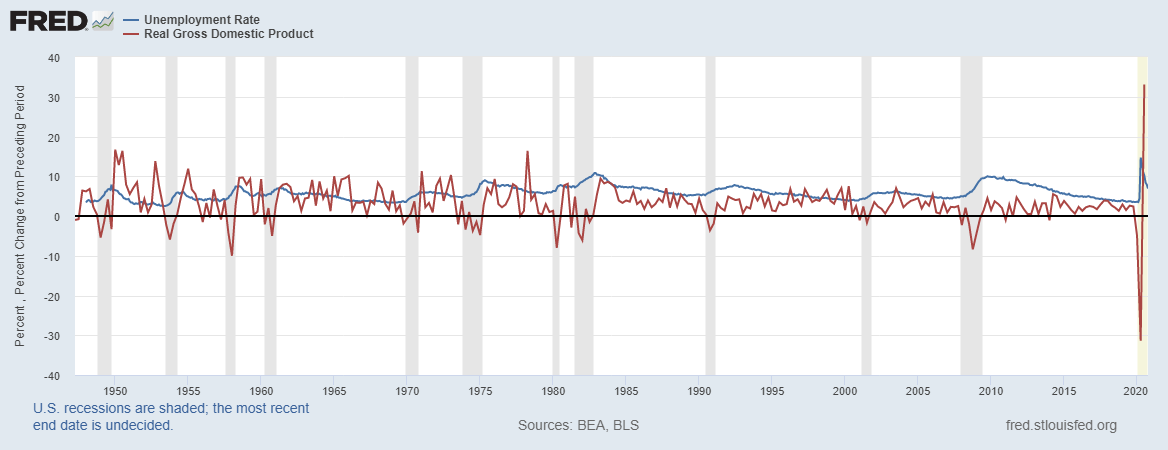
The most recent unemployment rate for the US was 6.9% for October 2020. Notably, this is a significant decline from the historic highs of 14.7% registered in May 2020. Our correlation analyses assign the US unemployment rate a score of -8 in 2020, meaning that the unemployment rate had a deflationary impact on the USD in 2020.
ISM Manufacturing PMI
The Institute of Supply Management (ISM) Manufacturing Purchasing Managers Index (PMI) compiles data on over 400 US companies. This indicator tracks the changes in new export orders, imports, production, supplies and deliveries, inventories, price, employment, new orders, and the backlog of orders. The components of the indicator are weighted as follows: 30% for new orders, 25% for production, 20% for employment, 15% for deliveries, and 10% for inventories.
The US manufacturing sector accounts for about 20% of the overall GDP. When the index is above 50, it shows that the manufacturing sector is expanding, while a reading below 50 shows the sector is contracting.

The most recent publication of the ISM manufacturing PMI for October 2020 was 59.3 showing that the US manufacturing sector is expanding. Our correlation analysis gives the ISM manufacturing PMI a score of 3, meaning it had an inflationary effect on the USD in 2020.
ISM Non-manufacturing Purchasing Managers Index (ISM NMI PMI)
This indicator tracks the activities of over 370 purchasing and supply executives across 62 different services industries. The index aggregates the diffusion of the business activity, new orders, employment, and supplier deliveries in equal weights and seasonally adjusted.
Note that the services sector in the US contributes to about 80% of the overall GDP. When this index above 50, it means that the services sector is expanding. A reading below 50 shows the sector is contracting.
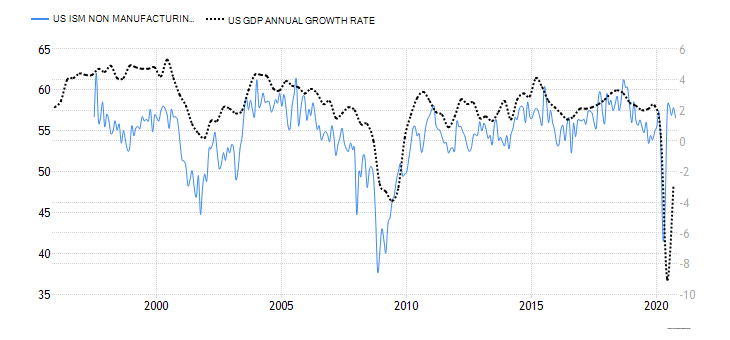
Based on our correlation analysis, we assign the ISM non-manufacturing PMI a score of 4.4. It means it had an inflationary impact on the USD in 2020.
US rate of inflation
The inflation rate measures the changes in the prices of a basket of goods and services consumed by households. The consumer price index for all urban consumers (CPI-U) gives a better overview of the general population’s inflation rate since urban areas are generally the most populated.
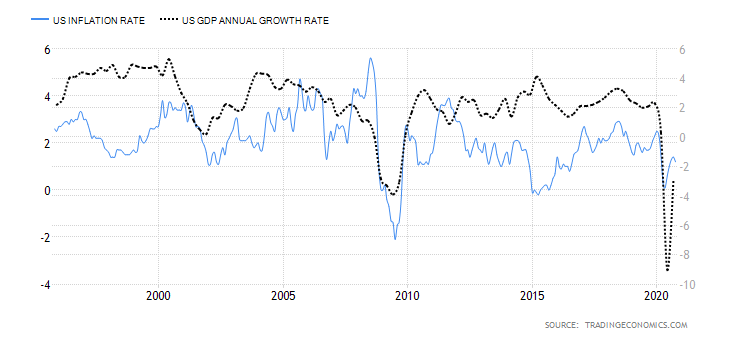
A rapidly increasing inflation rate forebodes future interest rate hikes, which have an inflationary effect on the USD. A consistently dropping inflation rate could imply that interest rate cuts are looming, which depreciates the currency.
Our correlation analysis assigns the US rate of inflation a score of -6, meaning it had a deflationary impact on the USD.
Gross Federal Debt to GDP ratio
This indicator measures the sustainability of the government’s debt. Effectively, the debt to GDP ratio compares what a country owes to what it produces hence showing its ability to repay its debts. This ratio can be used to determine when a government’s debt is getting unsustainably high. Hence, the higher the ratio, the more likely the default.
While it is normal for countries to operate budget deficit, increasing debt to GDP ratio is acceptable only when the country can sustainably finance its debt repayments at no expense to economic development. Note that the expansionary effect of higher debt to GDP ratio results in lower interest rates, hence, depreciating the domestic currency.
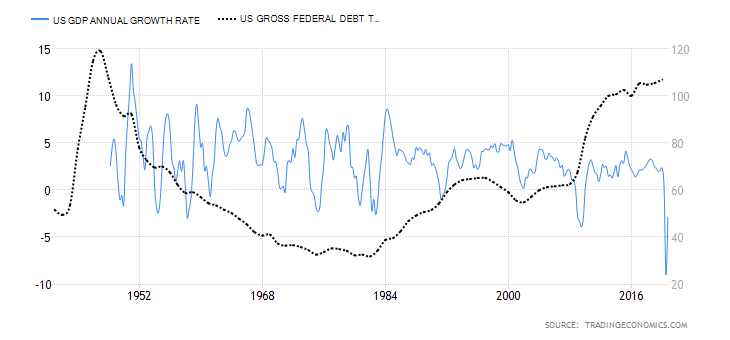
In 2020, the US debt to GDP ratio is 120; and according to our correlation analysis, we assign a score of -9.5, meaning it had a deflationary impact on the USD.
US Consumer Sentiment
The consumer confidence index is used to measure three aspects of the economy from the consumer’s perspective. It measures the consumers’ views on the prevailing economic conditions, their longer-term view on the economy, and personal financial situation.
The surveyed consumers and the questions posed are designed to represent all American households as accurately as possible statistically. Therefore, lower consumer sentiment means that consumers are more likely to reduce their consumption expenditure. Higher consumer sentiment implies that they are likely to increase their expenditure in the economy resulting in higher GDP.
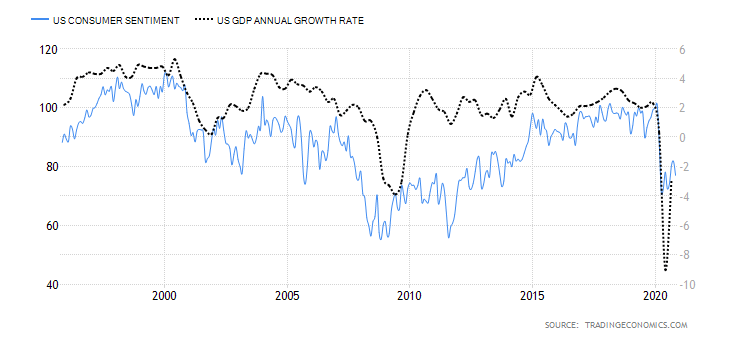
The most recently published data on the US Michigan Consumer Sentiment showed the consumer sentiment was at 77 in November 2020 from yearly highs of 101 in February 2020. From our correlation analysis, we assign the consumer sentiment a score of -3, meaning it had a deflationary impact on the USD.
In the next article, you can find the endogenous analysis of CAD in the USD/CAD currency pair.